Dec 1, 2014 - ... are coated with a layer of recognition molecules and measuring the electron ..... support vector machine10 available from https://github.com/.
NIH Public Access Author Manuscript Nat Nanotechnol. Author manuscript; available in PMC 2014 December 01.
NIH-PA Author Manuscript
Published in final edited form as: Nat Nanotechnol. 2014 June ; 9(6): 466–473. doi:10.1038/nnano.2014.54.
Single Molecule Spectroscopy of Amino Acids and Peptides by Recognition Tunneling Yanan Zhao1,2,*, Brian Ashcroft2,*, Peiming Zhang2, Hao Liu2,3, Suman Sen2,3, Weisi Song2,3, JongOne Im1,2, Brett Gyarfas2, Saikat Manna2,3, Sovan Biswas2,3, Chad Borges2,3, and Stuart Lindsay1,2,3 1Department 2Biodesign
of Physics, Arizona State University, Tempe, AZ 85287
Institute, Arizona State University, Tempe, AZ 85287
3Department
of Chemistry and Biochemistry, Arizona State University, Tempe, AZ 85287
NIH-PA Author Manuscript
Abstract The human proteome has millions of protein variants due to alternative RNA splicing and posttranslational modifications, and variants that are related to diseases are frequently present in minute concentrations. For DNA and RNA, low concentrations can be amplified using the polymerase chain reaction, but there is no such reaction for proteins. Therefore, the development of single molecule protein sequencing is a critical step in the search for protein biomarkers. Here we show that single amino acids can be identified by trapping the molecules between two electrodes that are coated with a layer of recognition molecules and measuring the electron tunneling current across the junction. A given molecule can bind in more than one way in the junction, and we therefore use a machine-learning algorithm to distinguish between the sets of electronic ‘fingerprints’ associated with each binding motif. With this recognition tunneling technique, we are able to identify D, L enantiomers, a methylated amino acid, isobaric isomers, and short peptides. The results suggest that direct electronic sequencing of single proteins could be possible by sequentially measuring the products of processive exopeptidase digestion, or by using a molecular motor to pull proteins through a tunnel junction integrated with a nanopore.
NIH-PA Author Manuscript
The proteome is likely a much better molecular indicator of the current health status of humans than the genome,2 but proteomic data are harder to acquire.3 Protein sequences deduced from cDNA lack information about alternative splicing and post-translational modifications. Low concentrations of DNA and RNA are readily amplified by PCR, but there is no similar technique available for proteins. Thus, there may be many rare protein
Correspondence and requests for material should be addressed to SL. *These authors contributed equally Author Contributions YZ and HL carried out tunneling measurements with assistance from SS, WS and JI. BA wrote the SVM code and analyzed data. BG contributed to the analysis. SM carried out force spectroscopy experiments. CB and SB carried out the electrospray MS. PZ and SL designed experiments and SL wrote the paper. Competing Financial Interests YZ, PZ and SL are named as inventors in patent applications. SL is cofounder of a company based on this technology. Additional Information Supplementary Information accompanies this paper.
Zhao et al.
Page 2
NIH-PA Author Manuscript
variants yet to be discovered at concentrations that are well below the detection limits of current techniques.4 In view of this, a single-molecule technique for protein sequencing is critical in identifying biomarkers and enabling the real-time diagnostic possibilities that follow. We are currently developing recognition tunneling (RT) as an electronic single molecule sequencing method for DNA. Here, we show that the method also works to identify individual amino acids and peptides, and so may open the way to single-molecule protein sequencing.
Recognition Tunneling
NIH-PA Author Manuscript
In recognition tunneling (Figure 1a), two metal electrodes, separated by a gap of about two nanometers, are covered with a layer of recognition molecules that are strongly-bonded to the electrodes. The recognition molecules form weaker, non-covalent, contacts with target analyte molecules. Single molecule signals dominate when a sharp electrode is used because the signal from the shortest path is by far the largest. When a small bias ( 90% accuracy (with 65% of the signals rejected as common, as might be expected given the sequence homology). Thus multiple peptides may be separated from each other, even when the difference is just one residue in four. This suggests that amino acid variants of proteins can be detected. In addition single molecule sequencing of proteins may be possible, particularly if residues can be presented to a tunnel gap sequentially. In this pilot study, high concentrations (~100 μM) were used to ensure rapid diffusion of analytes into the tunnel gap (though concentrations down to 1 μM worked). Sample concentrations can easily be reduced by micro- or nano-fluidic injection of samples into the tunnel gap. Of significant interest is incorporation of tunnel junctions into nanopores, where capture assisted by electrophoresis24 or electroosmosis25, could reduce this concentration to the pM range.
Bonding in the RT Junctions NIH-PA Author Manuscript
All seven analytes form stoichiometric adducts with one or two ICA molecules, as demonstrated by ESIMS (Figures S11 and S12 and Tables S6 and S7). ICA was designed to bond DNA bases, but the DFT calculated structures in Figures 1a and S1 show that amino acids can be captured by hydrogen bonding to ammonium and carboxylate groups of their zwitterionic centers. However, the observation that peptides generate RT signals that are different from those generated by amino acids (Table S5a), suggests that other types of binding motif are possible. How many such motifs might occur? To address this question for the case of the amino acids, we used an algorithm that identifies clusters of data26 to locate such clusters in the 24 dimensional-space occupied by the most significant signal features from single spikes (Figure S16). Three distinct clusters were found for six of the amino acids (Table S9) with only two for N-methylglycine, methylation presumably blocking a bonding site.
NIH-PA Author Manuscript
We examined bonding further using force spectroscopy. A dipeptide (Cys-Gly) was attached to an AFM tip through a PEG linker via the thiol of the cysteine residue and single-molecule rupture forces recorded (a hexane terminated PEG was used as a control). When the peptide retracted from an ICA coated gold surface, bond-rupture events were observed. The distribution of rupture forces (Figure S14) is consistent with two hydrogen bonds.17
Conclusions In conclusion, RT generates complex signals, the basis of a new form of molecular spectroscopy for identifying a potentially vast range of chemicals at the single molecule level. It discriminates between members of molecular classes, like enantiomers and isobaric isomers, analytes which present challenges to other analytical techniques. RT has the potential for numerous significant advantages over a variety of current types of instrumentation and analytical methods that require chemical labeling or complex and expensive instrumentation such as mass spectrometers. Instrumentation, for single molecule analysis and protein sequencing that integrate RT and nanopore technologies on a solid-state
Nat Nanotechnol. Author manuscript; available in PMC 2014 December 01.
Zhao et al.
Page 7
NIH-PA Author Manuscript
device platform, would likely be substantially smaller, less expensive, have lower operating costs and be more robust. Individual amino acids can be identified with high accuracy. In the near-term, a microreactor containing an exo-peptidase should be able to identify the terminal sequence of proteins by feeding the digest to the tunnel gap and analyzing the time dependent signal (Fig. S7). We have also shown that peptide chains generate distinctive and reproducible signals. With RT tunnel junctions integrated into nanopores, it may very well prove possible to carry out continuous strand sequencing of proteins (a molecular motor being used to feed entire proteins into nanopores27). The real power of RT as a chemical spectroscopy lies in the possibility of massively parallel detection using large-scale integration of solid-state devices. Such devices are under development in our lab.
Methods Preparation of analytical solutions
NIH-PA Author Manuscript
Amino acids were obtained from Sigma Aldrich (>98% purity) and dissolved in 1mM phosphate buffer (pH 7.4) made using water from a Milli-Q system with specific resistance of ~18 MΩ-cm and total organic carbon contamination below 5 ppb. Peptides were obtained from CPC Scientific and solutions prepared as for the amino acids. Preparation of probes and substrates Pd substrates were deposited on a 750μm silicon wafer using e-beam evaporation of 100 nm of Pd onto a 10 nm Ti adhesion layer. Probes were etched11 from 0.25 mm Pd wire (California Fine Wires). They were insulated with polyethylene to leave the metal end open with a linear dimension a few tens of nm. Probes were tested to ensure that leakage current was < 1pA in the standard buffer solution at 0.5V bias. This is because ionic leakage current cannot be simply subtracted from the signal because of its distance dependence,28 so leaky probes result in errors in the set point current. For functionalization, insulated probes and the Pd substrates were first cleaned by rinsing them with ethanol and H2O, dried with nitrogen, and then immersed in a solution of ICA13 (0.5 mM) in ethanol. After ~16 h, the probe and substrate were removed, rinsed with ethanol, gently dried with nitrogen, and used immediately. Tunneling measurements
NIH-PA Author Manuscript
We used two different PicoSPM’s (Agilent Technologies, Chandler) equipped with custom LabView interfaces for data acquisition. Tunnel current was sampled at 50 kHz. The -3dB bandwidth of the current to voltage converter was 7 kHz, but useful signals were obtained out to the Nyquist limit of 25 kHz after correction for the instrumental response (Figure S8). The liquid cells were cleaned in Piranha (note solutions are potentially explosive and must be handed with extreme care) and rinsed with Milli-Q water and ethanol. The current set point was set to 4 pA with 0.5V bias applied (probe positive, as this results in less leakage), and the probe approached with integral and proportional gains set to 1.0. The surface was scanned to ensure that the grain structure of the Pd was clearly visible (Fig. S9). The microscope was left to stabilize for at least two hours before signals were recorded and then the integral and proportional gains reduced to 0.1.The control (1.0 mM phosphate buffer at pH 7.4) was run before an amino acid solution was measured. Recordings are distorted by
Nat Nanotechnol. Author manuscript; available in PMC 2014 December 01.
Zhao et al.
Page 8
NIH-PA Author Manuscript
movement of the Z PZT during runs in which a series of high amplitude spikes are recorded, but this artifact is common to all analytes and incorporated into the training of the SVM. We used different batches of substrates and probes for each run, usually recording four runs for each analyte. We also alternated measurements between different instruments. In this way, the influence of small changes in experimental conditions could be removed from the final analysis. SVM Analysis We used the kernel-mode support vector machine10 available from https://github.com/ vjethava/svm-theta. Each spike above 15pA in amplitude was characterized using the features listed in Table S2. The shape of each spike was characterized by constructing a FFT. The resulting Fourier amplitude distribution was then down sampled using linear interpolation into nine bins of equal frequency interval from zero to 25 kHz. FFT amplitudes (prior to downsampling) were averaged across three equally-spaced frequency intervals (0– 2.7 kHz, 8.4–11.1 kHz and 22.3–25 kHz) and these averages were used as additional features.as was the ratio of the highest to lowest FFT bins useful (Peak Hi/Lo ratio, Fig. 4g).
NIH-PA Author Manuscript
Clusters contain additional information. They are identified with a Gaussian-broadening algorithm as described in Figure 2. 9 The peaks used to locate the clusters were subject to a 15 pA threshold, but once a cluster was identified, all of the data in it was used for the analysis, so amplitudes down to the baseline were included (c.f., Fig. 3a). Distributions of cluster lengths for various analytes are shown in Figs. S10a and b. We also developed a series of features to describe these clusters (Table S2). These included the spike frequency within a cluster, as well as the Fourier spectrum of the whole cluster (deconvolved for instrumental response by spectral division). Clusters contain many more data points than individual spikes, so the downsampling of the FFT was much finer, with a total of 61 bins used (each one corresponding to 25 kHz/61 or 410 Hz in width). The method of Noll23 was used to calculate the cepstrum amplitudes from the Fourier transform of the power spectrum, downsampling again to 61 frequency bins.
NIH-PA Author Manuscript
In order not to bias the analysis towards features with bigger numerical values and ranges, we rescaled all features as follows: The distribution of each signal feature was measured for one amino acid (in this case, arginine for the amino acid analysis, and glycine for the peptide analysis), The scale factor and additive constant required to move the mean of the distribution to zero and the standard deviation to 1.0 was calculated. Feature values for all of the other analytes were remapped using the same linear transformation. Feature selection was performed in 3 stages. First, those features that showed too much linear correlation were removed. The normalized correlation between different pairs of features (x,y) was defined in the usual way, σxy = 〈(x − x̄)(y − ȳ)〉 where we normalized the components using σxx = 1. All of the data from the entire pool was used to generate a correlation matrix where correlations are shown by off-diagonal elements (Fig. S4). Trial and error resulted in rejecting all feature combinations for which σxy ≥ 0.7. We chose one feature from each overly correlated set to represent the set in the next stage of analysis.
Nat Nanotechnol. Author manuscript; available in PMC 2014 December 01.
Zhao et al.
Page 9
NIH-PA Author Manuscript
Second, a comparison was performed for each feature for its variation over repeated experiments on the same analyte versus the variation between the different analytes. Histograms of all feature values (c.f. Figs 3 and 4) were compiled for each experimental run for a given analyte. The absolute values of the differences between the normalized histograms were accumulated to give an “in-group” fluctuation. The same procedure was carried out for all possible pairs of analytes to give an “out-group” measure of fluctuation. Parameters were then ranked by the magnitude of the ratio of out-group to in-group fluctuation and the bottom 15 parameters dropped (Table S3). Last, the usefulness of the remaining features was evaluated by determining the identification accuracy obtained with a randomly selected group of them. A tree-search was used to maximize the efficiency of this process. This led to the 52 features (Table S4) used in the analysis reported in Table 1. Full details of the SVM (written in Matlab) can be found in a download of the data analysis code available from https://svmsignalanalysis.codeplex.com/. ESIMS
NIH-PA Author Manuscript
Solutions of amino acids (100 μM), ICA (100 μM), and ICA (100 μM) mixed with each of the amino acids in 1:1 and 2:1 molar ratios (200 μM ICA) were prepared by dissolving them into water. Samples were injected into a Bruker MicrOTOF-Q electrospray ionization quadrupole time-of-flight (ESI-Q-TOF) mass spectrometer, and tandem mass spectrometry was used to confirm the composition of mass peaks from adducts. We checked that the lack of buffer did not hinder the acquisition of RT signals (Figure S13). Full details of the methods and analysis are given in the supporting information. Force Spectroscopy A Cys-Gly dipeptide was ligated to a PEG tether (N=36) which was in turn attached to a SiN AFM probe (VeecoProbes) using click chemistry.29 Force curves (Figure S14) were collected in aqueous buffer over a gold-coated mica substrate covered with a monolayer of ICA. Full details of the sample preparation, data acquisition and analysis are given in the supporting information.
Supplementary Material NIH-PA Author Manuscript
Refer to Web version on PubMed Central for supplementary material.
Acknowledgments Shuai Chang assisted in the original survey of amino acids. We thank Pei Pang, Predrag Krstic, Carlos HernandezSuarez and William Offenberg for useful discussions. This work was supported in part by a DNA sequencing technology grant from the NHGRI, HG 006323.
References 1. Huang S, et al. Identifying single bases in a DNA oligomer with electron tunneling. Nature Nanotechnol. 2010; 5:868–873. [PubMed: 21076404] 2. Uhlen M, Ponten F. Antibody-based Proteomics for Human Tissue Profiling. Molecular & Cellular Proteomics. 2005; 4:384–393. [PubMed: 15695805]
Nat Nanotechnol. Author manuscript; available in PMC 2014 December 01.
Zhao et al.
Page 10
NIH-PA Author Manuscript NIH-PA Author Manuscript NIH-PA Author Manuscript
3. National Research Council (US) Committee on Intellectual Property Rights in Genomic and Protein Research and Innovation. Reaping the Benefits of Genomic and Proteomic Research: Intellectual Property Rights, Innovation, and Public Health. National Academies Press (US); 2006. 4. Archakov AI, Ivanov YD, Lisitsa AV, Zgoda VG. AFM fishing nanotechnology is the way to reverse the Avogadro number in proteomics. Proteomics. 2007; 7:4–9. [PubMed: 17154275] 5. Chang S, et al. Electronic Signature of all four DNA Nucleosides in a Tunneling Gap. Nano Letts. 2010; 10:1070–1075. [PubMed: 20141183] 6. Huang S, et al. Recognition tunneling measurement of the conductance of DNA bases embedded in self-assembled monolayers. J Phys Chem C. 2010; 114:20443–22044. 7. Lindsay SM, et al. Recognition Tunneling. Nanotechnology. 2010; 21:262001–262013. [PubMed: 20522930] 8. Friddle RW, Noy A, De Yoreoa JJ. Interpreting the widespread nonlinear force spectra of intermolecular bonds. Proc Natl Acad Sci (USA). 2012; 109:13573–13578. [PubMed: 22869712] 9. Chang S, et al. Chemical Recognition and Binding Kinetics in a Functionalized Tunnel Junction. Nanotechnology. 2012; 23:235101–235115. [PubMed: 22609769] 10. Chang CC, Lin CJ. LIBSVM : a library for support vector machines. ACM Transactions on Intelligent Systems and Technology. 2011; 2:27–52. 11. Chang S, et al. Palladium Electrodes for Molecular Tunnel Junctions. Nanotechnology. 2012; 23:425202. [PubMed: 23037952] 12. Tuchband M, He J, Huang S, Lindsay SM. Insulated gold scanning tunneling microscopy probes for recognition tunneling in an aqueous environment. Rev Sci Instrum. 2012; 83:015102. [PubMed: 22299981] 13. Liang F, Li S, Lindsay SM, Zhang P. Synthesis, Physicochemical Properties and Hydrogen Bonding of 4(5)- Substituted-1H-imidazole-2-carboxamide A Potential Universal Reader for DNA Sequencing by Recognition Tunneling. Chemistry - a European Journal. 2012; 18:5998–6007. 14. Daniel JRM, Friess SD, Rajagopalan S, Wendt S, Zenobi R. Quantitative determination of noncovalent binding interactions using soft ionization mass spectrometry. International Journal of Mass Spectrometry. 2002; 216:1–27. 15. Nesatyy VJ. Mass spectrometry evaluation of the solution and gas-phase binding properties of noncovalent protein complexes. International Journal of Mass Spectrometry. 2002; 221:147–161. 16. Sreekumar A, et al. Metabolomic profiles delineate potential role for sarcosine in prostate cancer progression. Nature. 2009; 457:910–914. [PubMed: 19212411] 17. Fuhrmann A, et al. Long lifetime of hydrogen-bonded DNA basepairs by force spectroscopy. Biophys J. 2012; 102:2381–2390. [PubMed: 22677392] 18. Tsutsui M, Taniguchi M, Yokota K, Kawai T. Identification of Single Nucleotide via Tunnelling Current. Nature Nanotechnol. 2010; 5:286–290. [PubMed: 20305643] 19. Zwolak M, Di Ventra M. Electronic Signature of DNA Nucleotides via Transverse Transport. Nano Lett. 2005; 5:421–424. [PubMed: 15755087] 20. Cover TM. Geometrical and Statistical properties of systems of linear inequalities with applications in pattern recognition. IEEE Transactions on Electronic Computers. 1965; EC-14:326–334. 21. Jethava V, Martinsson A, Bhattacharyya C, Dubhashi D. The Lovász θ function, SVMs and finding large dense subgraphs. Neural Information Processing Systems (online). 2012:1169–1177. 22. Kühnle A, Linderoth TR, Hammer B, Besenbacher F. Chiral recognition in dimerization of adsorbed cysteine observed by scanning tunnelling microscopy. Nature. 2002; 415:891–893. [PubMed: 11859364] 23. Noll AM. Short-Time Spectrum and Cepstrum Techniques for Vocal-Pitch Detection. J Acoustical Soc Am. 1964; 36:296–302. 24. Wanunu M, Morrison W, Rabin Y, Grosberg AY, Meller A. Electrostatic focusing of unlabelled DNA into nanoscale pores using a salt gradient. Nature Nanotechnol. 2010; 5:160–165. [PubMed: 20023645] 25. Keyser U. Controlling molecular transport through nanopores. J Roy Soc Interface. 2011; 8:1369– 1378. [PubMed: 21715402]
Nat Nanotechnol. Author manuscript; available in PMC 2014 December 01.
Zhao et al.
Page 11
NIH-PA Author Manuscript
26. Chiu S. Fuzzy model identification based on cluster estimation. Journal of Intelligent & Fuzzy Systems. 1994; 2:267–278. 27. Nivaia J, Marks DB, Akeson M. Unfoldase-mediated protein translocation though an alphahemolysin pore. Nature Biotechnol. 2013; 31:247–250. [PubMed: 23376966] 28. Bard, AJ.; Fan, FRF.; Mirkin, MV. Electroanalytical Chemistry. Bard, AJ., editor. Vol. 18. 1994. p. 243-371. 29. Senapati, S.; Manna, S.; Lindsay, SM.; Zhang, P. Application of catalyst-free click reactions in attaching affinity molecules to tips of atomic force microscopy for detection of protein biomarkers. Langmuir. 2013. dx.doi.org/10.1021/la4039667
NIH-PA Author Manuscript NIH-PA Author Manuscript Nat Nanotechnol. Author manuscript; available in PMC 2014 December 01.
Zhao et al.
Page 12
NIH-PA Author Manuscript NIH-PA Author Manuscript
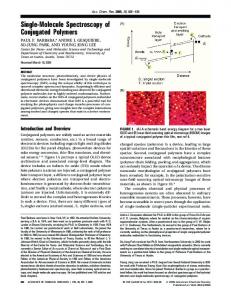
Figure 1. Recognition tunneling (RT)
NIH-PA Author Manuscript
(a) Recognition molecules (1H-imidazole-2-carboxamide, ICA) are strongly attached to a pair of closely spaced electrodes, displacing contamination and forming a chemically well defined surface. An analyte (here shown as L-ASN) is captured by non covalent interactions (blue bars show H-bonds) with the recognition molecules. The bonding pattern is specific to the analyte. The red arrow shows the orientation of the molecular dipole for L-ASN. This orientation is different when D-ASN is captured (Fig. S1). (b) ESIMS shows that stoichiometric adducts form between reader molecules here illustrated for 2:1 complexes of ICA and L-ASN. Data for other analytes are given in Tables S6 and S7. How RT signals are generated: (c) Picturing the analyte as amass (sphere) trapped by a pair of springs that represent the non-covalent bonds, the extent of analyte motion, X(t), depends on the strength of the springs. (d) A simple sinusoidal motion of the analyte (blue trace) produces a series of sharp current spikes (red trace) because of the exponential dependence of tunnel current on position. (e) and (f) are simulations for random thermal excitation of a strongly (e) and more weakly (f) bonded analyte, showing how the current fluctuations are much bigger when the bonding is weaker (red traces). The simulations are carried out as described in Huang et al.1
Nat Nanotechnol. Author manuscript; available in PMC 2014 December 01.
Zhao et al.
Page 13
NIH-PA Author Manuscript NIH-PA Author Manuscript
Figure 2.
NIH-PA Author Manuscript
Examples of RT signals from amino acids. GLY (a) and its N-methylated modification, sarcosine (mGLY) (b). Enantiomers L-ASN (c) and D-ASN (d). Isobaric isomers LEU (e) and ILE (f). (g) shows data for the charged amino acid, ARG. (h) is control data from buffer solution alone. The insets are expanded traces (current scale 150 pA, time scale 20 ms) displaying the complex peak shapes that are important features in the analysis of these data. (i) Signal trace for ARG, color-coded according to the peak assignments made by a machine learning algorithm (green = correct, red = wrong call, black = “water peak”, yellow = common to all amino acids). The red bars at the bottom mark signal clusters generated by a particular single-molecule binding event. Automatic cluster-identification was done by placing Gaussians of unit height and full-width of 4096 data points (1 data point = 20 us) at the location of each spike (j), summing them (k), and assigning a cluster to regions where this sum exceeds 0.05. This choice picks out obvious single molecule events well (cf. Fig. 5).
Nat Nanotechnol. Author manuscript; available in PMC 2014 December 01.
Zhao et al.
Page 14
NIH-PA Author Manuscript NIH-PA Author Manuscript
Figure 3.
NIH-PA Author Manuscript
Signal features identify analytes: (a) Peak amplitudes are exponentially distributed so provide little discrimination. Assigning the larger spikes to mGLY (red curve) yields an accuracy (p=0.58) only slightly better than random (0.5). Particular Fourier components (Table S1) of the clusters (b and c) show more separation, producing 74% (b) and 67% (c) accuracies if called solely on the more probable value of the feature. The way in which these Fourier components reflect peak shapes in a cluster is illustrated by the signal traces inset in (b) and (c), each trace having the feature value pointed to. The high amplitude of highfrequency components of the mGLY signals (inset in c) is evident in the sharper spikes. Accuracy improves when multiple features are used together. (d) Shows a 2D plot of probability density as a function of the two FFT feature values. The color scale shows mGLY data points as red and LEU points as green. Calling all the spikes with pairs of feature values that fall in the green regions as LEU and all the spikes with pairs of features that fall in the red regions as mGLY produces a correct call 95% of the time. Only the yellow regions yield ambiguous calls.
Nat Nanotechnol. Author manuscript; available in PMC 2014 December 01.
Zhao et al.
Page 15
NIH-PA Author Manuscript NIH-PA Author Manuscript
Figure 4.
Closely related pairs of analytes can be significantly separated (>80%) using just two signal features together. All data are for pure solutions of one analyte. Chiral enantiomers D-ASN and L-ASN (a,b,c), GLY and mGLY (d,e,f), and the isobaric isomers LEU and ILE (g,hi) are quite well separated in a 2D probability density maps (c, f and i) even when the distributions of any one signal feature are almost completely overlapped in 1D (a,d,g,b,e and h see Methods and Table S1 for a description of these features). The 2D maps plot probability densities for the analyte pairs (color coded as listed at the top) as a function of both the features that, by themselves, produce separations only a little above random (0.51 to 0.64). Probabilities of making a correct call based on the probability densities are marked on c, f and I, and calculated as described in the caption for Figure 3.
NIH-PA Author Manuscript Nat Nanotechnol. Author manuscript; available in PMC 2014 December 01.
Zhao et al.
Page 16
NIH-PA Author Manuscript NIH-PA Author Manuscript
Figure 5.
NIH-PA Author Manuscript
A mixture produces alternating cluster signals as different molecules diffuse into and out of the gap. (a) Signal trace obtained with a 1:1 mixture of L- and D- asparagine. The Support Vector Machine assignments are coded purple (D-ASN) and yellow (L-ASN) (black spikes are unassigned). Each cluster (red tags) contains only one type of signal, as shown statistically in (b). The red points are for 556 raw data clusters and the blue points are for 400 clusters that remain after filtering for common signals. After filtering (blue points), no mixed clusters survive, with all of the clusters being 100% L- or D-ASN signals. Quantification of the L/D ratio using SVM trained on pure samples is shown in (c). The measured ratio increases with actual ratio in the samples but the calibration depends on whether the number of signal spikes (red) or clusters (blue) is used, probably reflecting differential binding. Error bars are from repeated runs and repeated samplings.
Nat Nanotechnol. Author manuscript; available in PMC 2014 December 01.
NIH-PA Author Manuscript
NIH-PA Author Manuscript 98.77 99.99
5
95.14
1
3
ARG_L
Number Spikes
99.99
99.62
94.99
ASN_D
99.99
99.99
96.99
ASN_L
99.99
99.62
97.24
GLY
99.99
99.99
96.87
ILE
99.99
99.55
94.36
LEU
99.99
99.99
96.45
mGLY
Accuracy with which any one of seven pure analytes is identified from the total pool of data taken from all seven pure samples using 52 signal features together. Results in the first row are based on a single spike. The subsequent rows are based on a majority vote using 3 and 5 spikes taken from different signal clusters. These results were obtained with the noise-filter soft margin set to reject ~ 70% of the data spikes.
NIH-PA Author Manuscript
Table 1 Zhao et al. Page 17
Nat Nanotechnol. Author manuscript; available in PMC 2014 December 01.