intersected an imaginary circle concentric on the fixation point. The curves .... pattern (i.e., the distance between two target symbols) was exactly twice as long as one .... a draw program to draw the curves with a series of straight line segments. ...... suggesting that subjects were tracing the arc joining the two Xs in order to ...
Memory & Cognition
1991. 19. 21-36
Size invariance in curve tracing PIERRE JOLICOEUR and MARGARET INGLETON University of Waterloo, Waterloo, Ontario, Canada Subjects decided whether two dots were on the same curve or on different curves in patterns consisting of two curves and two dots in displays that had an exposure duration of 200 msec or that remained in view until the subjects' response. The overall size of the patterns was varied by a factor of two. Furthermore, across experiments, we manipulated the predictability of the size of the pattern on a particular trial. On half of the trials, the two dots were on the same curve; across these trials, the distance between the dots, along the curve, was manipulated systematically while the Euclidean distance between the dots was held constant. On the other half of the trials, the two dots were on different curves. The time to respond same increased monotonically as curve distance between the dots increased, suggesting that subjects mentally traced the curve in order to perform the task. The absolute size of the pattern had little or no effect on the response times, indicating that it was curve distance relative to the overall pattern size, rather than absolute distance, that controlled response times. Furthermore, expectancies about pattern size had essentially no effect on performance. Taken together, the results suggest that the rate of tracing is determined by various stimulus properties that covary with the overall size of the pattern on which tracing takes place, such as the distance between the traced curve and nearby distractor curves, or the curvature of the traced curve.
Contours, outlines, and boundaries playa fundamental role in human vision (e.g., Biederman, 1985, 1988; Cavanagh, 1987; Hubel & Wiesel, 1968; Treisman & Gelade, 1980; Ullman, 1984). In this paper, we investigate a possible process, curve tracing, that could be involved in the processing of information about contours and curves in visual displays. Curve tracing is thought to be a rapid visual process that can track along a contour internally (without eye movements). The empirical signature of curve tracing is that the time to perform the task should increase as the distance along the curve separating the target information increases, assuming that other relevant potential contributors to response time have been controlled (Jolicoeur, 1988; Jolicoeur, Ullman, & Mackay, 1986, 1990; McCormick & Jolicoeur, 1990a; Pringle & Egeth, 1988).
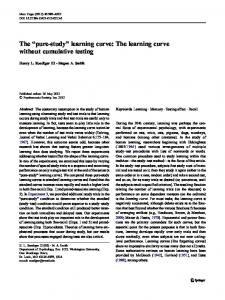
except that Xs were used instead of dots (dots were used in the present study). Across trials, the two Xs could either be on the same curve or on different curves. One of the Xs, the central X, always appeared on the central curve at the location formerly occupied by the fixation point. A second, noncentral, X could appear at one of four distances along the same curve or at one of four locations on the other curve. In same-eurve trials, distance was measured as the distance required to travel along the curve from the central X to the noncentral X and was expressed in degrees of visual angle. The Euclidean distance between the two Xs was held constant at 1.8 0 of visual angle by placing the noncentral X at locations where the curves intersected an imaginary circle concentric on the fixation point. The curves displayed in Figure 1 show this distance as 1.5 on the small pattern and 3.0 on the large pattern, which were the distances used in the present study. After either restricted (250 msec) or unlimited (2,500 msec) stimulus exposure, the time to respond that the two Xs were on the same curve increased monotonically as the distance separating the Xs along the curve increased. The time to respond that the two Xs were on different curves was generally slower than was the time to respond that the two Xs were on the same curve. Curve distance is not defined for different trials. Furthermore, the apparent rate of curve tracing was not affected by exposure-duration conditions, which suggests that eye movements were not necessary to perform the task and were not the cause of the increased response time with increasing curve distance. This, in turn, suggests that curve tracing is an "internal" perceptual mechanism that can operate quickly on the information gleaned from a single glance at a visual display. 0
The Experimental Task In this section, we review briefly the tracing paradigm developed by Jolicoeur et al. (1986). Subjects decided whether two Xs were on the same curve or on two different curves as quickly as possible while keeping errors to a minimum. Each display consisted of two nonintersecting curves and two Xs. The displays in the Jolicoeur et aI. (1986) paper were similar to those shown in Figure 1,
We thank James Chumbley, Alinda Friedman, and two anonymous reviewers for comments on an earlier version of this article. We also thank Keith McGowan and Richard Crispin for technical assistance. This research was supported by Grant 00P0000795 from the Natural Science and Engineering Research Council of Canada awarded to Pierre Jolicoeur. Correspondence may be sent to Pierre Jolicoeur, Department of Psychology, University of Waterloo, Waterloo, Ontario N2L 3Gl, Canada.
21
0
Copyright 1991 Psychonomic Society, Inc.
22
JOLICOEUR AND INGLETON
Figure 1. Example stimuli with (top figure) and without (bottom figure) construction constraints shown. The top pattern shows the four possible locations of the noncentral dot that yield a S/J1IIe trial. The distance between the dots, along the curve, was 4· in large patterns and 2· in small patterns. The dotted circle, not present in stimuli shown to subjects, was used to construct displays in which the Euclidean distance between the clot at fixation and the noncentral dot was constant for all displays and all curve distances (3.0· in large patterns and 1.5· in small ones). The bottom (i.e., small) pattern shows one of the four possible locations of the dot in a different trial. All dimensions on small patterns were exactly half those shown for large patterns.
Curve Tracing and Size Invariance The main focus in the present paper concerns the scale at which tracing takes place. By scale we mean the spatial size or resolution of the operator(s) that support curve tracing. One interpretation of the results of previous studies of curve tracing is that the to-be-traced curve is tracked by a local operator and that the rate at which this operator can follow the curve is limited. It follows from these assumptions that tracing a longer piece of curve would, all else being equal, take longer than tracing a shorter piece of curve. The main task of the local operator is to ensure that the tracing process remains "on curve,"
so that the process will not accidently begin to track the wrong curve and produce the wrong answer. One way to achieve this goal is to require that only a single curve be contained within the processing scope of the operator (see Jolicoeur et al., 1990; Mahoney & Ullman, 1988). Jolicoeur et al. (1990) hypothesized that the rate oftracing should be proportional to the size of the local tracing operator. This constraint falls out of the following considerations: Suppose that a local operator shifts along the curve in discrete steps. The maximum step size that the operator can take would be limited by the size of the operator, otherwise it could jump to the wrong curve. We assume that the general relationship between operator size and tracing rate would apply even if the operator tracked a curve in a smooth and continuous fashion, but this is clearly an assumption. These suggestions concerning the nature of the tracing mechanisms bear some similarity to the notion of a "beam" of attention, which has been proposed or assumed by a number of researchers (e.g., Eriksen & Hoffman, 1972; Posner, 1980; Remington & Pierce, 1984; Shulman, Remington, & Mclean, 1979; Tsal, 1983; but see Eriksen & Murphy, 1987; Yantis, 1988). For example, Humphreys (1981) suggested that the width of the "attentional focus," or in his words, the "span of visual attention," can vary under some conditions (see also LaBerge, 1983). In our case, under the appropriate stimulus conditions, such as spatial isolation of the target curve (Jolicoeur et al., 1990), a wider beam or operator could be used, which could result in faster tracing. Jolicoeur et al. (1990) found some evidence consistent with the hypothesis that tracing is supported by a local operator with variable size and that tracing speed varies with the size of the operator. They asked subjects to decide whether two dots were on the same straight line or on two different lines in displays that were covered by a large number of equally spaced parallel lines. Response time increased as the distance between the dots increased; this effect was magnified as the separation between the lines was decreased. That is, the effects of curve distance became larger when distractor curves were brought into greater proximity to a target curve. This pattern of results would be expected if the proximal distractor curves caused a local operator to become smaller (possibly so as to contain only a single curve) and if the rate of tracing was slower when the operator had a smaller scope. The suggestion is that, in general, the rate of tracing is not constant nor is it fixed entirely by low-level properties of the visual system. Rather, the rate of tracing would appear to depend on a number of properties of the curve to be traced and of the visual context in which that curve is embedded (see also McCormick & Jolicoeur, 199Ob). The present experiments were designed to provide converging evidence consistent with the model of tracing discussed above and proposed by Jolicoeur et al. (1990). We varied the overall size of the visual displays, which were similar to those used by Jolicoeur et al. (1986). Increasing the size of the stimulus, while keeping the thickness of lines and the size of targets the same, systematically
CURVE TRACING increases the absolute length of the curve to be traced in order to travel from one target to the other (e.g., from one X to the other in the Jolicoeur et al., 1986, experiments). Note, however, that although the absolute distance between targets varies, the distance, relative to the overall pattern size, does not. Suppose that the mechanisms that support our ability to mentally trace curves does not have the ability to adjust the size or scope of the processor that tracks the curve. In this case, we would expect that the scope of the operator would be relatively small, which would enable the system to trace curves even in a cluttered display (with many nearby distractor curves). If so, we would expect that tracing would proceed at a fixed rate by shifting a finely focused beam along the length of curve between targets. Increasing the size of the pattern, and thus the absolute distance to be traced, would increase the amount of time required in a directly proportional way. On the other hand, if the size of the operator can be varied, and if the rate of tracing is variable, then absolute distance could increase without necessarily being accompanied by an increase in tracing time. At least two properties of the displays used in the present experiments that covary with display size could be responsible for such a change in tracing rate (measured in absolute visual angle): (1) the distance between the curve to be traced and other elements in the display, and (2) the curvature of continuous curves in the display. There is some evidence that both of these properties may have an effect on tracing rate. Jolicoeur et al. (1990) report results suggesting that the rate of tracing is slower for trajectories with higher curvature (see also Pringle & Egeth, 1988). The increased distance between the target curve and distractors could also allow the tracing operator postulated by Jolicoeur et al. (1990) to enlarge its processing scope, which would be accompanied by a corresponding increase in tracing speed. Thus, both of these factors could allow tracing to proceed at an increased rate, which could compensate for the greater distance that needs to be traced on a larger pattern. Of course, it remains to be seen whether one would obtain any compensation, partial compensation, total compensation, or even overcompensation in tracing rate for a given change in pattern size. Perhaps the most interesting result would be essentially perfect compensation, which would be advantageous from the point of view of maintaining a certain degree of' 'processing constancy" as pattern size varies (with viewing distance, for example).
The Experiments To discover whether or not the visual system can adjust the rate of tracing for different pattern sizes, the present studies used a modified version of the "two-Xs-on-acurve" paradigm investigated by Jolicoeur et al. (1986). The most important manipulation was that the size of the curve displays was varied over a 2: 1 ratio. Thus, in terms of absolute length, one unit of curve distance on a large
23
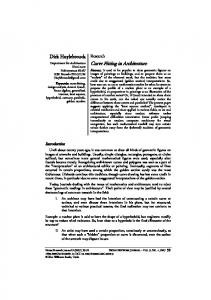
pattern (i.e., the distance between two target symbols) was exactly twice as long as one unit on a small pattern. Although the displays varied in overall size, the thickness of the curves and the size of the target symbols were constant across displays with different sizes and, thus, could not produce differences across size conditions (e.g., by making the symbols less visible and more difficult to find in smaller displays). The symbols in the present experiments were yellow dots rather than Xs. There was one difference between the displays that we did not control: the eccentricity of the curves and dots, which was greater for the larger patterns. As it turns out, however, the results show that this difference was not important, unless greater eccentricity made the curves and dots easier to process, which is the opposite of what we would expect. In the following paragraphs, we consider a number of potential outcomes from the experiments that would bear directly on the conceptions of tracing outlined above. Suppose that tracing mechanisms operate at a fixed rate. If so, absolute distance in visual angle should determine tracing time. The time taken to trace one unit on a large pattern, therefore, should equal the time taken to trace two units of a small pattern. Plotting the expected same response times for large versus small patterns against the number of units traced would produce an interaction between distance and pattern size in which the slope of the effect for large patterns is twice that for small patterns. This predicted pattern of results is shown in Figure 2, Panel A. The 2: 1 slope difference in functions would reflect an equivalent rate of tracing for the two pattern sizes and, thus, complete size dependence. Alternatively, in a more flexible system in which tracing rate is adjustable, there is no reason to predict a 2: 1 difference in time to trace one 'unit' on a large pattern relative to a small one. Distances that are twice as long need not take twice as long to trace. One possibility is that the 2: 1 size difference is compensated perfectly (e.g., by adjusting the size of the tracing operator), effectively adjusting the speed of shifting the beam. If so, it should take as long to trace one unit of a large pattern as it does one unit of a small pattern. Graphically, this particular hypothesis would predict overlapping and identical functions for the large and small patterns when response times are plotted against relative distance. This predicted pattern of results is shown in Figure 2, Panel B. Note here that the equivalence of functions would reflect a 2: 1 difference in absolute tracing rates (i.e., in terms of visual angle traversed) across the two pattern sizes and, thus, complete size invariance in terms of observed response times. There are other possibilities in addition to the above two. It is possible also that we may find incomplete compensation or perhaps even overcompensation for changes in pattern size. Also, we could find main-effect differences across conditions; these differences could reflect adjustments made in response to the overall pattern size
24
JOLICOEUR AND INGLETON
PREDICTIONS A:
Size Dependence
LARGE w ::!E
F
w
(f)
z
oQ.
small
(f)
W
a: w
>
~
w
a:
B: Size Invariance w ::!E
F
w
LARGE small
(f)
Z
oQ. (f)
W
a: w
>
~
w a:
1__+-1 ----+-----+-----+-1- 1 2 3 4 RELATIVE DISTANCE (UNITS) - SAME small:
2
4
6
LARGE
4
8
12
8 16
ABSOLUTE DISTANCE (DEGREES) - SAME
Figure 2. Predicted results for the present studies for the two classes of models. Panel A depicts a difference in the functions relating response times to distance, reflecting equivalent tracing rates, as predicted from models incorporating size dept:ndence. Panel B depicts equivalent functions, reflecting rate differences that are proportional to size differences, as predicted by models incorporating size invariance.
(e.g., the time to adjust the scope of a local operator could be different for the two pattern sizes).
EXPERIMENT 1 In Experiment I, the size of stimulus patterns was changed from block to block. Presenting the trials blocked by size should give subjects the opportunity to display complete size invariance, if this is possible, even if it takes some time to make "global" adjustments to various possible parameters of mechanisms used during tracing. There were also two exposure-duration conditions: limited (200 msec) and unlimited (until the subject's response).1 The limited condition was included to limit the potential usefulness of eye movements. Evidence for tracing under these conditions suggests that the processes
that support tracing are rapid internal perceptual mechanisms. This desirable outcome was compromised by the fact that brief exposures tend to be associated with higher error rates, which can complicate the interpretation of response times. Thus, we also included the unlimited condition, for which we expected lower error rates. Method Subjects. The subjects were 32 University of Waterloo undergraduates between the ages of 18 and 44 years. They were paid to participate in this study. Half of the subjects were in the limitedexposure group and half were in the unlimited-exposure group. There were 8 males and 8 females in each group. All subjects had normal or corrected-to-normal vision. None had participated previously in a curve-tracing equipment. Stimuli. A stimulus consisted of a pattern of two nonintersecting white curves and two yellow dots that could lie either on the
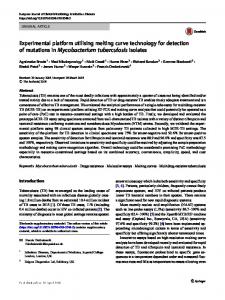
CURVE TRACING same curve or on different curves. An example of a pattern is depicted in Figure I. One of the dots in every display, the central dot, appeared at the center of the display at the location previously occupied by the fixation point. This location in the display was also the center of an imaginary circle used to constrain the curves. The circle, represented by a dotted line in Figure I, was never present in an actual display. The central curve passed through the central dot and then meandered through the display, intersecting the circle in at least four locations. The other, different, curve also intersected the circle at four locations. The four points of intersection of each of the two curves with the circle were the eight possible locations of the second, noncentral, dot. Therefore, in each size condition, the retinal eccentricity of the noncentral dot and the Euclidean distance between the two dots was constant across all displays. In same trials, curve distance was defined as the distance traveled along the curve separating the central dot and the noncentral dot. This distance can be expressed in absolute terms, using visual angie as the measure, or in relative terms, using the distance between the central dot and the first noncentral dot location as the basic unit of distance. The results shown in Figures 4-8 are plotted against relative distance, with the absolute distance corresponding with small and large patterns also listed below the abscissa. The curves were constructed such that the distance along the curve separating consecutive dot locations was a constant and was equal to one unit of relative curve distance. There is no clear definition of curve distance in the case of different trials. Nine patterns, eight experimental and one practice, differing only in the shapes of the curves, were drawn on an Amiga 1000 computer in high-resolution interlaced mode, using antialiased lines (Field, 1984; Tanner, Jolicoeur, Cowan, Booth, & Fishman, 1988) that produced smooth curves that were not perceivably jaggy. These curves had previously been composed by hand so as to satisfy all the design criteria and were then encoded on the computer by copying the curves onto a transparency that was taped to the screen and using a draw program to draw the curves with a series of straight line segments. The program stored only the coordinates of the end points of these line segments. The nine pairs of curves are displayed in Figure 3, with a central dot and the eight possible noncentral dots. Each of the nine basic patterns could be presented at one of two sizes (see Figure I). The large size was double the small size. For patterns displayed at the small size, the average size was 65 mm x 65 mm. The viewing distance was 930 mm, and, thus, the small patterns subtended visual angles of 4 ° and the large patterns subtended 8°. One unit of curve distance was equivalent to 2° on a small pattern and 4° on a large pattern. Thus, the four possible curve distances were equivalent to 2°, 4 °,6°, and 8° for small patterns, and 4°, go, 12°, and 16° for large patterns. The retinal eccentricity of the noncentral dot from the central dot was 1.5 ° for small patterns and 3 ° for large patterns. Dots were 0.3 ° in diameter and curves were 0.06° thick for both pattern sizes. Finally, each pattern was presented in two orientations, upright or inverted (rotated by 180°), which was done to reduce the chance that subjects would recognize particular patterns and dot configurations and use their memory to retrieve a response rather than relying on perception. Presenting the patterns upside down also ensured that the direction of tracing into the left or right visual field would be equated across all conditions. Procedure. The SUbjects were seated in a well-lit room, facing the monitor, using a chin rest to maintain a constant viewing distance. The task was to respond as quickly and as accurately as possible, while keeping errors to a minimum, by pressing a button with the index finger of one hand if the two dots were on the same curve or by pressing another button with the other hand if the two dots were on different curves. Hand of response was counterbalanced over subjects; half of the subjects of each gender in each group responded same with the dominant hand and different with the nondominant hand, which was reversed for the other half of the subjects.
25
~~»2 (1 )
(21
(3)
~~~ (4)
(5)
(9)
~
(8)
(9)
(7)
Figure 3. The nine pairs of curves used in the experiments (the bottom right pair was used in practice trials only). In this figure, all eight noncentral dots are shown for each pair of curves; there were only two dots in the displays shown to subjects. A trial began with the presentation of a central, yellow, fixation dot. After 750 msec, a stimulus pattern was presented such that the fixation dot now served as the central dot of the display. In the limited-exposure condition, the target stimulus was exposed for 200 msec and its offset was followed by a blank screen until a response was made. In the unlimited-exposure condition, the target stimulus remained in view until a response was made. A millisecond clock was started at the onset of the target stimulus and was stopped when a response was registered. The screen remained blank for 3 sec following the response, while the next stimulus was accessed and readied for presentation. After instructions were given, the subject initiated practice trials and experimental trials by pressing a key on the computer keyboard when he/she was ready to start a block of trials. Within blocks, trials proceeded at a fixed response-trial interval of 3 sec. The subjects' responses, same or different, and response times to the nearest millisecond were recorded for each experimental trial. Each subject responded to two full sets of combinations of the eight patterns, the two orientations, the two sizes, the four dot 10eations, and the two responses, for a total of 512 experimental trials, The 512 trials were presented to the subjects in four blocks of 128, with a brief rest period between blocks. Large and small patterns were presented in separate blocks. The subjects were presented two blocks of small patterns and two blocks of large patterns in an ABBA counterbalanced design, with half of the subjects receiving blocks ordered small-Iarge-Iarge-small (SLLS) and the other half of the subjects receiving blocks ordered large-small-small-Iarge (LSSL). The subjects were informed that size would change between blocks but that, within any given block, size would remain constant. A block consisted of eight subblocks of 16 trials, in which each pattern occurred once at each orientation. On half of these 16 trials, the noncentral dot was displayed on the central curve (same trials), twice at each of the four possible curve distances; on the remaining half, it was displayed on the noncentral curve (different trials),
26
JOLICOEUR AND INGLETON
twice at each of the four possible locations on the noncentral curve. Within and between subblocks, trials were randomly presented, with the constraints that a pattern at either orientation would not be repeated on successive trials and that the same response (either same or different) would not be repeated on more than four successive trials. A new randomization oftrials fulfilling all of the above constraints was generated for each subject. Each experimental block was preceded by at least one block of 16 practice trials in which the pattern size was the same as in the upcoming experimental trials. Two practice blocks, one for each size, were created and used for every subject. These trials consisted of a randomly ordered sequence of the practice pattern at the two orientations, with the four dot locations and the two responses, the latter being constrained to appear in no more than four consecutive trials. An accuracy rate of 94% (15 correct out of 16) in the practice trials was required in order to proceed to the experimental trials. If, after 16 practice trials, this accuracy criterion was not reached, another block of 16 practice trials was presented automatically. This procedure could be repeated four times. All subjects reached 94% accuracy on or before the fourth block of practice trials. The subjects were given no performance feedback during the experimental trials. Each subject was self-paced, with respect to length of rest periods, but was encouraged to take at least a short break between each block of 128 trials. On average, the subjects took about 1 h to complete the experimental session.
Results Response times. Response times in trials with a correct response were sorted into 32 cells for each subject. The cells corresponded with the factorial combination of responses (same/different) x block (two at each size) x size (small/large) x distance (4; this was a dummy variable for different trials). Thus, the data were pooled across orientations and the eight sets of curves for the analyses described here. The data in a cell were screened for outliers using the following algorithm. The mean response time and the standard deviation were computed with the smallest and largest observation in that cell temporarily excluded. Then, the smallest and largest observations were compared against the temporary mean plus or minus four times the standard deviation (M±4SD). If either the smallest or the largest response time (or both) were outside of the limits, it was declared an outlier and excluded from further analysis, and the algorithm was applied to the remaining numbers recursively, until all the remaining values were within limits. At that point, the final mean was computed, including the smallest and largest numbers that had been temporarily excluded in the last iteration. This procedure resulted in the exclusion of 2.54% of the correct responses. 2 The results for different trials were examined to ensure that the subjects were able to perform the task. To do so, the means from each cell were subjected to an analysis of variance, such as the one described below for same responses only, but the present analysis included response as an additional within-subjects factor. The mean response time for same responses was 837 msec and the mean for different responses was 1,060 msec [F(l,28) = 47.38, P < .0001]. Errors were defined as trials in which the subject made the wrong response (these did not include trials for which the response time was an outlier). The
error rate was 6.4% for same responses and 3.1 % for different responses [F(l,28) = 14.64, P < .0007]. The means of the correct same trials, averaged over patterns and orientations, were submitted to a mixedmodel analysis of variance in which exposure duration and block order (SLLS/LSSL) were between-subjects factors and size (small/large), block (first vs. second, at a given size), and distance were within-subjects factors. The mean of these means, averaged across subjects, for each distance, each exposure duration, and each size can be seen in Figure 4. In the analysis of variance and in Figure 4, curve distance is expressed in units relative to the overall pattern size. There are a number of results that are immediately apparent upon looking at Figure 4. First, the time to respond that the two dots were on the same curve increased monotonically with increasing curve distance [F(3,84) = 40.29, P < .0001], suggesting that the subjects traced the curves to perform the task. Second, there were little or no effects of changing the size of the patterns. The main effect of size was not significant [F(l,28) = 1.24, P > .27], and size did not interact significantly with exposure-duration conditions [F(l,28) = 1.97, P > .17]. Perhaps even more importantly, the effects of distance on response times were essentially identical across small and large patterns (F < 1) and across combinations of size and exposureduration conditions (F < 1). These results are what we would expect if there was complete compensation by tracing mechanisms for the increased size of the patterns. Third, response times were faster in the limited-exposure condition than in the unlimited-condition, although this effect was only marginal in the analysis of variance [F(l,28) = 3.76, P < .063]. Block order effects. We also examined the various counterbalancing factors to discover whether the effects described above changed in important ways depending on testing order. For any given subject, the four blocks of trials were coded as the 2 x 2 combination of pattern size (large or small) and whether a block was the first or second block within each size. In general, the effects that were significant in the analysis of variance appear to be due to practice. For completeness, we list here all the effects that were significant. The subjects were faster on the second block (798 msec) at a particular size than on the first block (876 msec)[F(l,28) = 41.30, P < .0001]; the effects of distance were slightly larger on the first block than on the second [F(3,84) = 2.87, P < .042]. Both of these significant effects probably reflect nothing more than practice. Unexpectedly, the SLLS group (753 msec) responded faster overall than did the LSSL group (921 msec) [F(l,28) = 5.80, P < .023]. We have no ready explanation for this difference. The group factor also interacted with pattern size (for the SLLS group, small = 787 msec, large = 719 msec; for the LSSL group, small = 902 msec, large = 938 msec) [F(l,28) = 15.01, P < .0006]. A likely explanation for this difference is that practice effects tend to be larger early in the course of learning
CURVE TRACING
27
Figure 4. Mean response time (in milliseconds) and percent error rate for JIIIM trials in Experiment 1 for each exposure condition, each dBaoce, and each pattern size. Circles denote JIIIM trials. Also depicted is the mean response time for dqfermt trials for each exposure condition and each pattern size, coUapsed across distaDce. Squares denote dqfermt trials. Open symbols denote the limited-exposure condition. Filled symbols denote the unlimited-exposure condition.
than later on. Thus, for the group that started with large patterns, we would expect longer responses to large patterns than to small ones, and for the group that started with small patterns, we would expect longer responses to small patterns than to large ones, as we found. Neither of the above effects entered into significant interactions with the distance factor, suggesting that the rates of tracing were not affected strongly by these group and block effects [for the block order (SLLS/LSSL) X distance interaction, F(3,84) = 1.41, P > .24; for the block order X size X distance interaction, F(3, 84) = 1. 31, P > .27]. There were no other significant effects in the analysis of variance. Errors. The mean percent error rate for same trials, averaged across subjects, for each distance, each exposure duration, and each size, is shown at the bottom of
Figure 4. Curve distance is plotted in units relative to the overall pattern size. The means were submitted to the same analyses used for response times. As in the response-time results, there are a number of results that are immediately apparent upon looking at Figure 4. First, there were more errors in the limited condition than in the unlimited condition [F(l,28) = 13.73, P < .001]. Second, there were more errors as the distance between the dots along the curve increased [F(3,84) = 18.11, P < .0001], which mirrored the pattern of results for the response times. Third, the effect of distance on error rates was larger in the limitedexposure group than in the unlimited-exposure group [F(3,84) = 5.51, P < .002]. Given the brief exposure duration in the limited group, it is possible that these subjects were processing a fading representation of the stimulus. This representation could have become increasingly
28
JOLICOEUR AND INGLETON
more difficult to use as the distance to be traced increased, given that more time was required to complete processing in that condition. There was no overall difference in the error rates for small versus large patterns [F(l,28) = 2.40, p > .13]. However, the difference in error rates across pattern size was different across the two exposure-duration conditions [F(1,28) = 6.50,p < .017]. As can be seen in Figure 4, small patterns were associated with higher error rates than were larger patterns in the limited condition, whereas there was virtually no difference in the unlimited condition. Separate analyses on the results for each exposure condition showed that the small-large difference was significant in the limited condition [F(l,14) = 4.86, P < .045], but not in the unlimited condition [F(l, 14) = 1.84, P > .19]. It is possible that some of these effects were due to speed-accuracy tradeoffs (e.g., a tendency for error rates to increase more across distance for small patterns than for large ones in the limited condition, which may have masked an advantage for large patterns overall). However, what we want to emphasize is that the direction of these effects is such that our main conclusion is unaffected-the slope of the distance function was not steeper for larger patterns than it was for small ones for either errors or response times. Block order effects. We also examined the various counterbalancing factors to discover whether or not the effects described above changed in important ways. There were many significant effects involving block order. In general, as in the response-time results, they seemed to reflect simple practice effects. There was one effect, however, that we cannot describe simply: the five-way exposure duration X block order X size X block (first or second, at a given size) x distance interaction [F(3,84) = 5.16, P < .0026]. The relevant means are presented in Table 1. In the main, the effects of pattern size tended to be small, and it seems reasonably safe to interpret the response-time results without strong concern for speedaccuracy tradeoffs for all but the tradeoff in overall response time and errors across the unlimited and the limited conditions.
Discussion Overall, the results were more consistent with complete compensation for changes in pattern size than with any of the other alternatives mentioned in the introduction. The effects of distance on response times were equivalent across patterns of different size when size was expressed in units relative to the overall pattern size (see Figure 4). Another way to think about this result is that, in order to produce the observed pattern of means, the absolute rate of tracing in terms of visual angle traversed per unit time would have to have been roughly twice as fast in blocks of trials involving large patterns than as it would have to have been in blocks with small patterns. These results will be discussed in more detail in the General Discussion. An interpretation of the error-rate results was complicated by a significant higher order interaction involving the block-order counterbalancing variables. When collapsed across all these variables, however, the results seem more consistent with complete size invariance than with any other alternative, as is evident in Figure 4. This slight complication in the present experiment can be taken as an incentive to seek converging evidence for what otherwise appeared to be a clear-cut pattern of results in favor of size invariance. We sought that converging evidence in Experiments 2 and 3.
EXPERIMENT 2 The results of Experiment 1 suggest that the rate of curve tracing varies proportionally with pattern size. However, it is important to determine not only if blocking the trials by the size of patterns maximized rate differences, as was expected, but if in fact it produced rate differences that would not be observed without blocking. For example, it could be that the size invariance demonstrated in Experiment 1 is possible only under restricted conditions in which the scale at which tracing takes place is roughly constant across trials. This could have been the case if, for example, the blocking procedure permitted a difficult and slow global adjustment to some mechanism involved
Table 1 Mean Percent Error Rate for Each Exposure Duration, Each Block Order (SLLS/LSSL), Each Pattern Size, Each Block (First or Second at a Given Size), and Each Distance in Experiment 1 SLLS Distance 1 2 3 4 1 2 3 4
Small First Second 0.8 0.8 1.6 3.1 9.4 13.3 18.8 38.3
Large
First
Second
LSSL Small Large First Second First Second
0.8 0.8 2.3 4.7
Unlimited Exposure 0.0 1.6 0.8 1.6 0.8 2.3 2.3 3.1 2.3 5.5 5.5 9.4
0.8 0.8 2.3 4.7
1.6 0.8 3.1 2.3
0.8 0.8 0.8 4.7
5.5 6.2 8.6 24.2
Limited Exposure 3.9 3.9 10.9 7.8 5.5 5.5 5.5 10.9 11.7 15.6 21.1 22.7
2.3 5.5 6.2 11.7
6.2 6.2 10.2 18.0
1.6 3.1 6.2 7.0
CURVE TRACING in tracing that might not have been possible if pattern size was changed from trial to trial. In Experiment 2, the size of patterns varied randomly from trial to trial so that the subjects could not anticipate which of the two sizes would appear next. Method Subjects. The subjects were 32 University of Waterloo undergraduates between the ages of 17 and 35 years. They were paid to participate in this study. Half of the subjects were in the limitedexposure group and half were in the unlimited-exposure group. There were 8 males and 8 females in each group. All subjects had normal or corrected-to-normal vision. None had participated previously in a curve-tracing experiment. Stimuli and Procedure. The stimuli were those used in Experiment I. Pattern size varied randomly from trial to trial, with the constraint that a particular size could not be repeated on more than four consecutive trials. The other blocking constraints employed in Experiment I were also met. For each subject, subblocks of 16 trials within the first two and last two blocks of trials used in Experiment I were combined into new subblocks of 32 trials, wherein each pattern in each size format occurred twice, once upright and once inverted. The 512 trials were presented in four blocks of 128, with a rest period between blocks. Also, 16-64 practice trials of randomly mixed size preceded each experimental block. The subjects were informed that pattern sizes would change randomly from trial to trial. Otherwise, the task, instructions, and procedure were the same as those in Experiment I. The subjects took approximately I h to complete the experimental session.
Results Response times. The response times were first screened for outliers using the procedure detailed in Experiment I, which resulted in the rejection of 1.88% of the correct response times. Following the outlier-identification procedure, the mean response time was computed for each subject, each exposure-duration condition, each pattern size, each response, and each distance by averaging across patterns and orientations. The relevant means are displayed in Figure 5. Correct response times and percent error rates were initially analyzed, including the factors of block, response, size, and distance. We found the expected practice effects across blocks, but there were no differences in the trends over distance between blocks for the two sizes. For this reason, the block factor was excluded from further consideration. As in Experiment I, the results for different trials were examined to ensure that the subjects were able to perform the task. To do so, the means from each cell were subjected to an analysis of variance like the one described below for same responses only, but the present analysis included response as an additional within-subjects factor. The mean response time for same responses was 806 msec and the mean for different responses was 1,019 msec [F(I,30) ::: 159.13,p < .0001]. The error rate was 5.6% for same responses and 3.6% for different responses [F(l,30) = 10.47, P < .003]. The means of the correct same trials were submitted to a mixed-model analysis of variance in which exposure duration was a between-subjects factor and in which size
29
(small/large) and distance were within-subjects factors. As in Experiment I, on average, response time increased monotonically with increasing curve distance [F(3,90) ::: 60.04, p < .0001], suggesting that the subjects traced the curves to perform the task. Unlike in Experiment I, however, there were a number of significant effects involving pattern size. Responses were faster for large patterns than for small ones [F(l,30) ::: 18.46, p < .0002]. Furthermore, the effects of distance depended significantly on the joint effects of pattern size and exposure duration [F(3,90) ::: 4.00, p < .011]. We examined this interaction in more detail by performing separate analyses on the results from each exposure duration. The interaction between size and distance was not significant in the limited condition [F(3,45) ::: 1.71,p > .17] but was significant in the unlimited condition [F(3,45) = 3.35, P < .028]. As can be seen in Figure 5, the magnitude of the distance effect was smaller for large patterns than for small patterns, which suggests, if anything, some degree of overcompensation for pattern size. There were no other significant effects in the analysis of same trials. Errors. The mean percent error rate is graphed for each distance, each exposure duration, and each pattern size in the bottom panel of Figure 5. These error rates were submitted to the same type of analysis as that used for the response times. There were more errors in the limitedexposure condition than in the unlimited-exposure condition [F(l,30) = 23.88, p < .0001]. The error rate increased with increasing curve distance [F(3,90) ::: 15.75, p < .0001], and this increase was larger in the limited condition than in the unlimited condition [F(3,90) ::: 3.86, p < .012]. As in Experiment I, the larger error rate in the limited condition was accompanied by faster response times (although the response time difference was not significant) than in the unlimited condition. For the other effects, the pattern of error rates did not suggest speedaccuracy tradeoffs. Sequential analysis. In addition to the above analyses, we also subjected the results for same trials to an analysis in which we conditionalized trials depending not only on the size of the pattern on that trial, but also on the size of the pattern on the preceding trial. We called a trial congruent for size if the present size matched that of the preceding trial. The analysis was otherwise identical to the one described above for response times. The means for each exposure duration, each distance, and each size condition (congruent-small, congruent-large, incongruent-small, and incongruent-large) are shown in Figure 6. As is evident in Figure 6, conditionalizing trials on the size of the preceding trial did not modulate the magnitude of the distance effect, as suggested by the nonsignificant interaction between preceding size, present size, and distance [F(3,90) ::: 1.04, p > .37], and this effect did not depend on exposure duration (F < I). These
30
JOLICOEUR AND INGLETON • small
1100
• LARGE
1050 ~
1000 small
w
~
f=
UNLIMITED EXPOSURE
950
c small
w
C/)
z
LARGE
900
0 LARGE
amall LARGE
0
0..
C/)
w
IT:
850
z