Sketch-Finder: efficient and effective sketch-based retrieval for large image collections Michel Crucianu† Cnam-CEDRIC, France Email:
[email protected]
Carlos A. F. Pimentel Filho∗ , Arnaldo de A. Ara´ujo∗ ∗ Federal University of Minas Gerais Computer Science Department Belo Horizonte - MG - Brazil Email: {fragapimentel,arnaldo}@dcc.ufmg.br
†
Val´erie Gouet-Brunet†,‡ IGN - Laboratoire MATIS Email:
[email protected] ‡
SF
SF
EI
EI
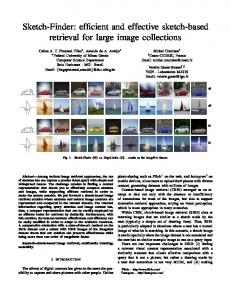
Fig. 1.
Sketch-Finder (SF) vs. Edgel-Index (EI) – results on the ImageNet dataset.
Abstract—Among various image retrieval approaches, the use of sketches lets one express a precise visual query with simple and widespread means. The challenge consists in finding a content representation that allows you to effectively compare sketches and images, while supporting efficient retrieval in order to make the system scalable. We put forward a sketch-based image retrieval solution where sketches and natural image contours are represented and compared in the wavelet domain. The relevant information regarding query sketches and image content has, thus, a compact representation that can be readily employed by an efficient index for retrieval by similarity. Furthermore, with this solution, the balance between effectiveness and efficiency can be easily modified in order to adapt to the available resources. A comparative evaluation with a state-of-the-art method on the Paris dataset and a subset with 535K images of the ImageNet dataset shows that our solution can preserve effectiveness while being more than one order of magnitude faster. Keywords-sketch-based image retrieval; multimedia indexing; scalability.
I. I NTRODUCTION The advent of digital cameras has given to the users the possibility to capture and share pictures with other people. Online
photo-sharing such as Flickr1 on the web, and Instagram2 on mobile devices, allow users to upload their photos with diverse content, generating datasets with millions of images. Content-based image retrieval (CBIR) emerged as an attempt to deal not only with the absence or insufficiency of annotations for most of the images, but also to support alternative retrieval approaches, relying on visual perception, which is more appropriate in many scenarios. Within CBIR, sketch-based image retrieval (SBIR) aims at returning images that are similar to a sketch made by the user (typically a simple set of drawing lines). Thus, SBIR is particularly adapted in situations where a user has a mental image of what he is searching. In this scenario, a sketch image is useful specially when the image dataset is not annotated and the user has no similar example image to use as a query input. There are two important challenges in SBIR: (i) finding a relevant visual content representation associated with a similarity measure that allows effective comparison with a query that is not a picture, but rather a drawing made by a user that sometimes is not very skillful, and (ii) making 1 Flickr
– http://www.flickr.com/ – http://instagram.com/
2 Instagram
retrieval scalable to large image datasets by building an appropriate index structure able to better exploit the content representation and similarity measure. If a good solution is to be found, we consider that those challenges should not be separately addressed. Thus, we put forward here a solution where sketches and natural contours extracted from the images are represented and compared in the compressed-domain of wavelets. The relevant information regarding to image content (as well as query sketches) has, thus, a compact representation that can be readily employed by an efficient index for retrieval by similarity. Our goal is to retrieve in large datasets all images that are visually similar to the objects shape of the query sketch at similar scale, position and rotation. Contributions: The main contributions of the present paper are: A new approach for sketch-based image retrieval using the compressed-domain index. Regarding to the description and indexing of the image dataset, a new visual word3 structure is proposed in order to represent and encode image edges in a compact set or the contour signature. This visual word structure is based on the wavelet coefficient and presents a very compact information of the image contours. The visual word is composed of the wavelet coefficient spatial position, its sign and the orientation of the edges. These compact contour signatures, make the dataset index much smaller than traditional approaches, also it is possible to set the desired size of the contour signature, and by consequence the total index size. A new similarity measure is proposed for comparing the contour signatures. This similarity is based on computing the number of visual words matched between the query sketch and the target images. In this similarity measure, we also consider the visual word weight according to its importance as described in Section II. The proposed approach uses an index stored on disc with efficient data structures granting the growth of the image dataset without depending on memory limitations, thus allowing big data sketch-based image retrieval. A. Related work Effectiveness was the major issue in SBIR since the introduction of this research area in the early 1990’s. However, significant advances in efficiency were only made recently (e.g., [1]), making practical applications possible. Among the existing SBIR proposals, we focus on [2], [3], [1], [4], [5], which we consider particularly relevant. In [2], the authors used the wavelet domain to represent the images of the dataset. The wavelet decomposition allows a good image approximation with just a few amount of data. This same property is successfully used for lossy image compression [6]. Typically, in this context, just a few wavelet coefficients with the largest magnitude are used to represent an approximation of the original image, allowing the construction of a very small index for the dataset. The mentioned approach 3 The “visual words” come from a “dictionary” induced by quantizing the feature space of a low-level local descriptor.
uses query-by-painting [7] and the query may be interactive, i.e., while the user draws the query image, a preview of the results is automatically shown. In the work [1], named Edgel Index (EI), a black and white line-based sketch approach is presented for a contour-based matching algorithm. This approach estimates the similarity between a sketch and natural image contours. The authors index the edge segments split in six orientations, and evaluate their method in a collection of more than two million images. The problem of this approach is the high memory cost to hold the dataset index in main memory, which restricts this approach to the size of the available memory. The authors of [3] employed a method based on histograms of local edge orientations, yielding invariance to scale and translation. The drawback of this work is the small dataset used in the experiments, which contains less than 1.4K images. In [4], the authors presented a benchmark approach for the SBIR task in large image dataset with a new descriptor based on the “bag-of-features”. They also presented an study with human comparison and comprehension about how line-based sketches and real images are similar or not. A similar approach in terms of memory cost saving is presented in [5]. This SBIR application is also based on the approach [1], and the authors focused on the idea of SBIR for mobile devices. The approach also splits the image edges in six orientations. Then, they applied to each edge orientation map, the Distance Transform (DT). After, the high-dimensional DT features are projected in a compact binary hash. The authors affirmed that the retrieval performance is competitive to [1] and requires only 3% of the memory storage comparing to EI. B. Technique overview Next section provides a detailed description of our approach. Content representation and the associated similarity measure are presented first, then we focus on the index structure supporting scalable retrieval. The comparative evaluation is shown in Section VI. A smaller image dataset is used for selecting appropriate parameters for the content representation and for the similarity measure. A second dataset of more than 535K images issued from ImageNet is then employed for comparing both the effectiveness and the efficiency of our proposal with those of [1]. II. S KETCH -F INDER A PPROACH In this section, we describe our proposal approach, named here Sketch-Finder. As the name suggests, the present approach is focused on sketch-based image retrieval. Our objective in this work is to improve memory saving and speed retrieval efficiency. In order to achieve these objectives, we use here the compressed-domain index based on the wavelet decomposition. The Sketch-Finder is an approach for black and white sketches. These sketches consist of edges that describe important contours of the images. Here, we consider that the more a query and a target image have edges at the same or
Image
Image resize 256 x 256
Contour Detection UCM
Threshold
(a)
Orientation Estimation
Dilation of Oriented Maps
Wavelet Transform
Wedgels
Fig. 2. Sketch-finder natural image processing workflow – in this sequence: image input; contour detection; thresholding; edges orientation estimation; dilation of the oriented edges; standard Haar wavelet decomposition; set of wedgels result.
1200
600
00 (b)
...
... 1200
600
00 (c)
...
... 1200
600
00
(a)
(d)
...
(b)
...
Fig. 4. Visual features extraction: (a) image contours map; (b) estimation of edge orientation and segmentation; (c) dilation of the oriented edges; (d) wavelet domain representation of the ten most positive coefficients (white dots) and the ten most negative coefficients (black dots). (c)
Fig. 3. Contour detection examples from natural images using the ultrametric contour map (UCM) algorithm and their respective thresholded images with threshold = 0.27 in [0, ..., 1]. (a) Natural images; (b) hierarchical contour map; and (c) the thresholded contour map.
near position, the more similar the two images are. The same idea is used by [1]. The main difference between our approach and [1] is that we compare the edge similarity of two images in a representation of the wavelet domain, while [1] computes directly in the pixel domain. Also, to better compare the edges of the images, it is important to estimate and split the edges in different orientations, thus, edges at the same position but in different orientation are not considered the same. III. I NDEXING P ROCESS AND S IMILARITY M EASURE We represent the visual features with a new entity based on the wavelet coefficient. Here we name this entity as wedgel. This visual word is based on the wavelet coefficient described by [2] plus its orientation edge map source. In our approach, the visual word is represented as a quadruple (x, y, s, θ), where (x, y) represent the wavelet coefficient spatial position, s the coefficient quantized sign (+1 or -1) and θ the edge map orientation used before the wavelet transform. To process the image dataset and extract the proposed visual features, i.e., the wedgels, each image of the dataset is processed as illustrated in Fig. 2. A detailed description of each processing step is given in the following text. Image resize. In order to have all images with the same size, important for matching the spatial position (x, y) of the wedgels, all images are resized to the same pattern, 256 ×
256 pixels. Although the image aspect ratio is lost, all the images, as well as the sketch, use the same aspect ratio and the distortion in position is naturally compensated by the spatial approximation of the visual features obtained in the next steps. Contour detection. Because our approach uses black and white line-based sketches, we need to detect the natural contours of the images. As such, a good algorithm of contour detection is fundamental for the success of this approach. To obtain the natural contours, we use the hierarchical Ultrametric Contour Map (UCM) algorithm, with the default parameters, described in [8]. As far as we know, this high level contour detection is the state-of-the-art in literature. Fig. 3 (a) presents some natural images and Fig. 3 (b) shows the results obtained by the application of the UCM algorithm. Threshold. To obtain the most important object contours, the result given by the UCM algorithm is then thresholded with value 0.27 in the interval [0, ..., 1], as shown in Fig. 3 (c). Orientation estimation. The edge orientations are estimated and quantified in six intervals, i.e., −15◦ ∼ 15◦ , 15◦ ∼ 45◦ , ..., 135◦ ∼ 165◦ . Fig. 4 (b) illustrates the edge orientation estimation obtained from Fig. 4 (a). In this figure, we show just three orientations to simplify the idea and illustration. Also, the three orientations are represented in different colors, although actually each orientation is a grey-level image. Dilation. The oriented edges are dilated with a cross structured element of size 3×3. This dilation is applied d times or iterations until the desired dilation is reached. In this paper, we call a dilated orientation map with d iteration as window size or simply window. The higher the number of iterations, the larger is the window. Fig 4 (c) presents an illustration of the dilation window obtained from Fig 4 (b). More details on the number of iterations are given in Section VI-A (Parameter
Tuning). Wavelet transform. For each oriented binary image or dilated map, the standard Haar wavelet transform [9], [10]) is applied following the algorithm described in [2]. Just the n largest positive and negative coefficients are used to encode each contour dilated map θ. With this data, the wedgel (x, y, s, θ) is finally composed and combined to create the contour image signature for each image of the dataset. In this proposed configuration, the dictionary of wedgels has 256×256×2×6 = 786432 possible visual words or elements. Some statistics on the real number of used words are presented in Table IX. Further details on the wavelet transform algorithm used in this approach are presented in [2]. The similarity measure between the query sketch Q and the target image T of the dataset in the Sketch-Finder approach is inspired by the distance used in [2]. In that approach, the more similar the query and target images are, the more matches of great magnitude wavelet coefficients at the same spatial position and sign are computed. Considering the problem of computing the similarity between the contour signature of a query sketch Q and a potential e y, s, θ, f ] and Te[x, y, s, θ, f ] represent target image T , let Q[x, the [x, y] − th truncated quantized wavelet coefficient of Q and T with sign s = (+1 or − 1), orientation θ and dilation window f . Here, we can use one or more different version of window dilation, where f represents the window dilation and win the total of different window configurations used. Further, e = Te), which evaluates let us consider the equality operator (Q e e to 1 when Q = T and 0 otherwise. We propose a similarity function based on the sum of matched wedgel weights between the contour signature of Q and T written as: win X 6 X X e Te) w(Q, (1) f =1 θ=1 e[x,y,s,θ,f ]6=0 x,y,s,θ,f :S e Te) = α · bin(x, y) · (Q[x, e y, s, θ, f ] = Te[x, y, s, θ, f ])+ w(Q, e y, s, θ, f ] = Te[x, y, s, θ, f ]) (1 − α) · p(θ, f ) · (Q[x, ni (f ) The wedgel weight w is determined according to their spatial position given by the bin function and/or by the estimation of the number of edges of Q given by the p function. The variable α, within the interval [0, ..., 1], gives a linear interpolation between the weights of bin and/or p. The nearer α is to 0, the more p weights are important, while the nearer to 1, the more bin weights are considered. The objective of the function p is to give more importance to orientation maps with larger number of edges rather than orientations with few edges or empty. The number of dilation iterations at window f is represented by ni (f ). As each orientation map has a fixed number of wedgels, empty orientation or with just a few edges has the potential to count the same similarity of an orientation full of edges, thus, the division
by ni (f ) aims to provide a good balance of the weights at different window dilation sizes. Once the weights of p are given by average grey level of each dilated orientation map of the sketch, larger dilation windows without the division by ni (f ) should have higher relevance, which is not desired. In this case, a simple way to measure the amount of edges in order to know the importance of the orientation, thus the weights of the wedgels, is to use the average value of grey level of the orientation map θ. The higher the average value is, the more edges are present. Also, this strategy approximates our approach to the idea of the similarity measure presented in [1]. The average value of grey level of the orientation map θ at window dilation f is given within the interval [0.1, ..., 1], so as the minimum value of the weight is 0.1, orientation maps empty or with just a few edges are also considered, but with small similarity contribution. Given the average value of grey level within [0, ..., 1], the weight for p is given by Eq. 2: mg + 0.1 (2) 10 where mg represents the average value of the grey level at orientation θ within the interval [0, ..., 1] and wa represents the weight for p within [0.1, ..., 1]. The weights of bin are shown in Table I. Considering the input query sketch Q as a binary image, we used the same weights of grey level channel given in [2]. wa = mg −
bin(x, y) := min{max{x, y}, 5}
(3)
IV. Q UERY P ROCESS The query process has some common steps to the indexing workflow described in Section III: image resize; orientation estimation; dilation; and wavelet transform. The contour detection is not necessary because the sketch is already a contour entity and the threshold is not applied because we consider that the input is already binary. Fig. 5 presents the query workflow of the sketch-finder and we describe in following just the processes not in common to those explained in Section III. Similarity measure. In this step, the wedgel words obtained from the sketch are used to load its correspondent inverted files list to the main memory. After, we measure the similarity with Eq. 1. More details about the inverted files are described in Section V. Sorting the similarity. Once we have the similarity of the sketch to the images of the dataset, we sort the similarity using the quick sort algorithm and present the k most relevant results to the user. In our prototype, we present the results in a (HTML) page format. A text file is also created with all results for precision×recall [11] evaluation of effectiveness. V. I NDEX S TRUCTURE The compact Sketch-Finder index was designed to support efficient query processing. Faster querying is a consequence of less visual words to process and it allows to have larger image dataset index to be hold on the main memory. Another
600
(a)
...
Fig. 5. Query workflow – in this sequence: the sketch input; sketch resize; edges orientation estimation; dilation of the oriented edges; standard Haar wavelet decomposition; similarity measure of the sketch contour signature; sorting the similarity results; and display of the classified results. TABLE I C OEFFICIENT POSITION WEIGHTS 0
1
2
3
4
5
4.04
0.78
0.46
0.42
0.41
0.32
advantage of the proposed approach is the possibility to control the index size according to the best balance between better precision of results vs. efficiency in terms of faster retrieval, in a similar way it is possible to choose the best balance of image quality vs. compression rate in formats like JPEG [12] and JPEG2000 [13]. Furthermore, it is possible to have different indexes on disk and load the best one according to the available memory resources of the machine. To improve the efficiency, the “matching” of wedgels is performed by retrieving all n inverted lists of images (IDs) of each wedgels (x, y, s, θ) present on the sketch contour signature. After we sort the result of the similarity between the sketch and the dataset images. Fig. 6 shows the index structure. Fig. 6 (a) presents the dilated edgel maps in the wavelet domain, already quantized with the ten most positive and negative wavelet coefficients. The negative coefficients are represented by a black dot, while the positive ones are represented by white dots. To simplify the idea, here we illustrate just three orientations, although actually we have six. In Fig. 6 (b), we present the wedgel dictionary (x, y, s, θ), and in Fig. 6 (c), we represent the list of images IDs associated with each wedgel of the dictionary. VI. E XPERIMENTAL E VALUATION In this section, we first employ a relatively small image dataset (Paris Dataset) to select appropriate parameters for the content representation and for the similarity measure. Then, we compare both, the effectiveness and the efficiency of our proposal to those of the method in [1], on a second dataset of more than 535K images issued from ImageNet4 . The Paris Dataset is a homogeneous collection of 6,412 images collected by the Visual Geometry Group (VGG5 ) from Flickr. The dataset is grouped by 11 particular famous landmarks of Paris (La Defense, Tour Eiffel, Hotel des Invalides, Mus´ee du Louvre, Moulin Rouge, Mus´ee d’Orsay, Notre Dame, 4 ImageNet
– http://www.imagenet.org/ Geometry Group – http://www.robots.ox.ac.uk/˜vgg/data/parisbuild ings/index.html 5 Visual
...
...
...
IMG ID 1
... IMG ID 5
... IMG ID 0
IMG ID 5
IMG ID 7
IMG ID 1
...
(c)
bin
...
Result Display
(b)
weight
1200
IMG ID 9
IMG ID 9
...
Sorting the Similarity
Similarity measure (wedgels)
Wavelet Transform
00
Dilation of Oriented Maps
Orientation Estimation
...
Sketch
Image resize 256 x 256
IMG ID 5
Fig. 6. Edges Indexing using inverted files: (a) wavelet domain representation; (b) set of wedgels or dictionary; and (c) inverted list of image IDs.
Panth´eon, Pompidou, Sacr´e Cœur and Arc de Triomphe). Also, there is one general category of all kinds of images from Paris. The Building and Vehicle ImageNet Dataset is a subset of the ImageNet2011 fall release. Two main categories and all their subcategories were selected (Building Edifice (n02913152) and Vehicle (n04524313)) performing a total of more than 535,000 images. It is important to note that the ground-truths we employed for these datasets were not designed specifically for SBIR, but rather corresponds to a higher-level semantics. The images inside each class may present the same object at different viewpoint, shape, rotation, scale and position. It follows that the performance measure we obtained with these groundtruths are, naturally, much lower than should be expected on a ground-truth specifically designed for SBIR. There are, however, many images showing very similar items from similar viewpoints and having similar positions, that are relevant for the evaluation of SBIR. Furthermore, since our approach and the method in [1] make similar assumptions regarding the queries, we believe the comparison is fair with these groundtruths. A. Parameter Tuning Some parameters have to be well set in order to have a good precision×recall in the sketch-finder. To get the best results, the following parameters were evaluated: (i) number of dilation iterations (window size), (ii) number of wedgels per contour signature, (iii) number of different combined window sizes and (iv) different similarity functions. In this section, we show the results of these comparisons using the Paris dataset and the VGG ground-truth. For the EI parameters, we used the original parameter of their approach in the image resolution, i.e., 200×200. In order to preserve the equality of the the dataset, we used the same contour detection used for the sketch-finder (UCM) and threshold = 0.27. For the dilation we tried several configurations finding that 28 iterations brings the best average precision for
TABLE II AVERAGE PRECISION AT RANK POSITION Pn ( IN %) S INGLE WINDOW DILATION EXPERIMENT
TABLE IV AVERAGE PRECISION AT RANK POSITION Pn ( IN %) VARIATION IN α – S ETTING THE SIMILARITY WEIGHTS
Iterations
2
5
10
15
20
25
30
35
40
45
P5
0.64
0.68
0.69
0.70
0.70
0.71
0.72
0.71
0.68
0.66
P10
0.44
0.50
0.55
0.55
0.57
0.58
0.57
0.54
0.55
0.56
P15
0.36
0.42
0.49
0.48
0.51
0.51
0.51
0.48
0.49
0.48
P20
0.32
0.38
0.44
0.47
0.44
0.45
0.46
0.45
0.44
0.44
α
0
0.2
0.4
0.6
0.8
1
P5
0.72
0.68
0.68
0.67
0.66
0.66
P10
0.57
0.53
0.52
0.51
0.50
0.50
P15
0.51
0.48
0.46
0.45
0.45
0.45
P20
0.46
0.43
0.42
0.42
0.41
0.41
TABLE III AVERAGE PRECISION AT RANK POSITION Pn ( IN %) VARIATION IN THE NUMBER OF WEDGELS
TABLE V AVERAGE PRECISION AT RANK POSITION Pn ( IN %) C OMBINATION OF MULTIPLE WINDOWS
Wedgels
120
144
168
192
216
240
264
288
312
336
360
P5
0.74
0.70
0.72
0.70
0.72
0.70
0.71
0.72
0.71
0.71
0.71
P10
0.56
P15
0.48
P20
0.44
0.56 0.48 0.44
0.57 0.49 0.44
0.57 0.50 0.46
0.57 0.50 0.44
0.57 0.51 0.47
0.58 0.50 0.45
0.56 0.49 0.45
0.57 0.51 0.45
0.57 0.49 0.45
win
10-20
10-30
10-40
15-30
20-25-30
10-20-30
10-25-40
15-30-45
P5
0.71
0.72
0.75
0.74
0.74
0.76
0.79
0.74
P10
0.58
0.59
0.61
0.60
0.58
0.58
0.62
0.61
P15
0.51
0.52
0.53
0.53
0.49
0.53
0.54
0.53
P20
0.46
0.47
0.49
0.48
0.44
0.49
0.49
0.48
0.57 0.49 0.45
the EI. This parameter is used as default for the EI in the comparisons with the sketch-finder shown here. In our experiments, we consider the precision of the first 20 classified images as a parameter for measuring the quality of queries. The evaluation takes into consideration the first 5 rank positions P5 , the first 10 rank positions P10 , and so on, until the 20th rank position P20 . We present the average precision obtained with the average of the 55 queries on the Paris dataset. Contour dilation size For single window dilation (win = 1), we tried different sizes of dilation to find the best configuration. Some images present better precision with smaller windows, while other queries work better with larger ones. Table II shows experimental results with average precision for all the queries. Varying the number of wedgels In lossy image compression like JPEG2000 [13], it is possible to choose the size of the image file accepting a lower quality. In JPEG2000, the image compression and its quality is determined by the number of wavelet coefficients selected. In a similar way, the representation of the contour image approximation is determined by the number of wedgels, which is also based on the wavelet coefficient. When only a few number of wedgels are used, the contour signature does not represent the image edges accurately, and in the other hand, using a significant number can make the index too large. To discover the best number of wedgels, we experimented a variation between 120 and 360 elements per contour signature. Table III shows the precision results. Although using more wedgels increases the precision on the first 20 rank positions, the differences are not very significant, and in the same queries, the use of more than 264 wedgels decreases the precision. Overlapping several dilations For multiple window dilation, we combined the comparison of wedgels obtained in more than one dilation size of edge
map. As shown in the experiments, evaluating different contour dilation sizes (Table II), the best results are obtained with sizes between 10 and 35 iterations (in the average), however, some individual queries are best classified even with 5 or 45 iterations. In this way, we built experiments combining contour dilations between 10 and 45 iterations. Some combinations with 2 or 3 window dilations were experimented. The results confirm that this combination increases the precision and Table V presents the results with different window combinations. The size of the contour signature in this experiment is always 120 wedgels and the labels A-B (for two windows) or A-BC (for three windows) of Table V represent the number of iterations respectively for the windows A, B and C. Experimenting different similarity functions This experiment varies the α parameter in order to choose the best similarity function. The relation between the weights of the function bin and wa are changed by the α parameter. This parameter varies from 0 (considering just wa ) to 1 (considering just bin). We also consider four intermediate levels between wa and bin. The experiments are done with one window dilation of 30 iterations and 120 wedgels per contour signature. Table IV presents the results. The best configuration is α = 0 which means that the bin function is not important and can be eliminated in Eq. 1, i.e., the wedgel importance is proportional and just related to the number of edges in their orientation map. VII. E VALUATION ON THE I MAGE N ET S UBSET To evaluate the ImageNet subset, we built a ground-truth based on the one used for the Paris dataset. Among the large number of object categories and subcategories, 15 were selected on which the objects were most homogeneous in terms of position, rotation and scale. Within these 15 categories, 10 were selected for the vehicle subset (dump-cart, automobile, scooter, serving-cart, velocipede, airplane, helicopter, ship, motorcycle and ambulance) and five for the building subset (governmental building, house, rotunda, oast house and opera
house). Like the evaluation of the Paris dataset, we considered the occurrence of the object in the subset label, even knowing that the subset has the same object in different positions, scale and rotations. The experiments used five UCM natural contours of each category of the ImageNet dataset, and as such, the 15 categories used totalled 75 queries. For each category we evaluated the average precision×recall curves of the five queries on each category and the average precision of all 75 queries. To compare our approach with the (EI) [1], we considered the first 50 ranked results. In these experiments, nine of the fifteen ImageNet categories used were best classified by our approach. Fig 7 presents the fifteen average Precison×Recall curves, one for each category. Fig. 8 presents the precision×recall curve for the first fifty results (although, in our tables we present the average precision results only for the first 20 ranked images).
Precision %
Ambulance
1
Edgel-Index Sketch-Finder
0.8
0.8
0.6
0.6
0.7
0.4
0.4
0.6
0.2
0.5
0
0.5 Recall %
0.4
0.01
2
3
0.02
0.03
0.04
4
0
0
0.2
0.4
0.6
0.8
−3
Gov. Building
x 10
0.8
0.6
0.6
0.4
0.4
0.2
0.2
0
2
4
Helicopter
1
0.8
0
6
8
0
0
1
2
3
1
x 10
Motorcycle
1
0.4
1
0.6 0.4
0.6
0.2 0
2
4
6
0.4
0
2
4
6
1
3
4 −3
x 10
Scooter
0.6
0.7
0.2 0
0.01
0.02
0.03
0.04
Serving Cart
1
0
0.01
0.02
0.03
Ship
1
0.4
0.8
0.8
0.6
0.6
0.6
0.4
0.4
0.002 0.004 0.006 0.008 0.01 0.012
0.2
0
0.02
0.04
0.06
Velocipede Cart
1
0.8
0
0.4 0
0.5
0.2
1 −3
0.59
0.59
0.48
0.49
P15
0.42
0.43
P20
0.40
0.41
Sketch-Finder
EI
CPU AVG
8.84
418.07
CPU SD
1
405.36
To compare our approach with EI, we also evaluated the query time and, I/O reading and the size of the indexes. To evaluate the CPU and I/O of the queries, we used the subset of the ImageNet with 75 queries. The experiments with SketchFinder and EI approaches were evaluated in a machine with a 24 CPU Intel Xeon X5670 with 2.93GHz and 72Gb of RAM memory. Although we had 24 cores, the experiments used a single CPU thread and during the performance evaluation no other experiments was active.
Edgel-Index Sketch-Finder
0.8 0.6 0.4 0
0.002
0.004
0.006 0.008 Recall %
0.01
0.012
Fig. 8. Average Precision×Recall curves from 75 queries of the SketchFinder and EI approach on the ImageNet subset (535K). Both curves are representation of the first fifty results.
0.8
0.8
0.4
0.2
2
1
0.9
0.6
1
x 10
Rotunda
1
0.8
0
−3
x 10 Opera House
8
P5 P10
TABLE VII CPU: QUERY TIME IN SECONDS
0.2
0.2
−4
0
Oast House
0.8
0.8
0.6
0
4 −3
−4
0.8
EI
Average curve (75 queries)
x 10 House
1 −3
x 10
1
0.6
0
1
−3
0.8
0.2
0
x 10
Dumpcart
1
0.2
0
1
Automobile
1
0.8
Sketch-Finder
Precision %
Airplane
1 0.9
TABLE VI AVERAGE PRECISION AT RANK POSITION Pn ( IN %) AVERAGE P RECISION OF THE FIRST 20 RANKED POSITIONS (I MAGE N ET )
0
0.005
0.01
0.015
0.02
0.025
x 10
Fig. 7. Average Precision×Recall curves by object of the Sketch-Finder and EI approach on the ImageNet subset (535K). Each curve represents the average Precision×Recall of five queries. The continuous blue line represents the curve of the EI approach while the dashed red line represents the SketchFinder. Both curves are representation of the first fifty results
Table VI presents the average precision of all 75 queries for both approaches. This experiment uses the following parameters: three windows dilations, 10, 25, 40 iterations on each window, 120 wedgels per contour signature and α = 0. According to the results, we consider that both approaches are equivalent in their effectiveness for large datasets.
Regarding to the CPU cost, we did not consider the time of I/O. The benchmark of the CPU cost is presented in seconds in Table VII, with its average (AVG) and standard deviation (SD) of the 75 queries. The I/O was measured in bytes and Table VIII presents average I/O and the standard deviation. We can detach the smaller variation on the query speed as shows the standard deviation in Table VII. This statistical measure presents a fewer CPU query time variation when compared to the EI approach. The reason for the less variation time in the query speed comes from fixed number of wedgels to compose the contour signature. Thus, the sketch-finder always processes the same number of wedgels to measure the similarity of the query sketch to the dataset of images. Moreover, in sketch-finder it is possible to have a better estimation of the time on each query. Both approaches are implemented as inverted files lists of image ID’s and the indexes are stored on disk. Although the original implementation of the EI approach is in main
TABLE VIII I/O IN BYTES Sketch-Finder
EI
I/O AVG
1.59×10⁸
2.84×10⁹
I/O SD
1.56×10⁷
2.83×10⁸
TABLE IX N UMBER OF USED WORDS IN THE wedgel DICTIONARY Iterations
NIL
Used words (%)
2
418783
53.25
5
149378
18.99
10
59808
7.60
15
43667
5.55
20
37102
4.72
25
31270
3.98
30
29905
3.80
memory, we used disk implementation in order to have the same criteria of evaluation. Further, on disk it is possible to have a scalable approach in the size of the dataset, that can grows. As shown in Table VII, the average CPU time of the queries in the Sketch-Finder is more than 47 times faster. This occurs because the Sketch-Finder has less index files to read and process. Additionally, the standard deviation is smaller in the Sketch-Finder due to the number of inverted files to be read, which is a fixed number of wedgels. This is an advantage for the Sketch-Finder approach, because we can have a better estimation of the query time without much variation. Our index is much smaller than the EI approach. An index with a single window dilation and 120 wedgels is less than 6% of the size of the EI. As shown in Table VIII, the index data reading on disk by the Sketch-Finder approach is less than 6% of the amount read by the EI approach, giving to the Sketch-Finder a much faster reading of index. Although the proposed wedgel dictionary maximum size is 256 × 256 × 2 × 6 = 786432, in practice the real number of visual words is much smaller due to the concentration of wedgels near to the coordinate (0, 0). Informally, The more far is the wedgel position to (0, 0), the less likely it is to have a wedgel inverted list. To show the real number of inverted list in several configurations of edge dilation, Table IX presents this data obtained also from the ImageNet dataset. All the index experiments are taken from 40 coefficients per orientation map, i.e., 240 wedgels per contour signature. We present the variation in the number of edge dilation before the wavelet transform affecting the Number of Inverted Lists (NIL). We also present in Table IX the percentage of words used of the dictionary.
VIII. C ONCLUSION This paper presented an approach for SBIR tasks in large image datasets. The proposed similarity measure uses the
compressed-domain of the wavelets where the more quantized coefficients are matches between the sketch and the contours of the target image, the more similar they are. The coefficients have weights based on the number of edges in their orientation maps, what is expected due to the larger amount of details. The results demonstrated that our approach is equivalent to the (EI) [1] in terms of effectiveness, however, significantly more efficient in terms of space and faster in query time for very large datasets. The experiments confirmed that the number of dilations of the contours, in fact, significantly, changes the precision of results, while increasing the number of wedgels increases the precision, but not significantly. This enforces that we can choose the size of the index without resulting in a considerable difference on the query results. ACKNOWLEDGMENT The authors are grateful to CNPq, CAPES, FAPEMIG and COFECUB, for the financial support to this work. R EFERENCES [1] Y. Cao, C. Wang, L. Zhang, and L. Zhang, “Edgel index for large-scale sketch-based image search,” in CVPR, 2011, pp. 761–768. [2] C. E. Jacobs, A. Finkelstein, and D. H. Salesin, “Fast multiresolution image querying,” in Proceedings of SIGGRAPH 95, Aug. 1995, pp. 277– 286. [3] J. Saavedra and B. Bustos, “An improved histogram of edge local orientations for sketch-based image retrieval,” in Pattern Recognition, ser. Lecture Notes in Computer Science, M. Goesele, S. Roth, A. Kuijper, B. Schiele, and K. Schindler, Eds. Springer Berlin Heidelberg, 2010, pp. 432–441. [4] M. Eitz, K. Hildebrand, T. Boubekeur, and M. Alexa, “Sketch-based image retrieval: Benchmark and bag-of-features descriptors,” IEEE Transactions on Visualization and Computer Graphics, vol. 17, no. 11, pp. 1624–1636, 2011. [5] K.-Y. Tseng, Y.-L. Lin, Y.-H. Chen, and W. H. Hsu, “Sketch-based image retrieval on mobile devices using compact hash bits,” in Proceedings of the 20th ACM international conference on Multimedia, ser. MM ’12. New York, NY, USA: ACM, 2012, pp. 913–916. [6] R. A. DeVore, B. D. Jawerth, and B. J. Lucier, “Image compression through wavelet transform coding.” IEEE Transactions on Information Theory, vol. 38, no. 2, pp. 719–746, 1992. [7] C. C. Venters, R. J. Hartley, and W. T. Hewitt, “Content-based image retrieval query paradigms,” in Encyclopedia of Information Science and Technology (I), 2005, pp. 556–563. [8] P. Arbelaez, M. Maire, C. Fowlkes, and J. Malik, “Contour detection and hierarchical image segmentation,” IEEE Trans. Pattern Anal. Mach. Intell., vol. 33, no. 5, pp. 898–916, May 2011. [9] C. K. Chui, An introduction to wavelets. San Diego, CA, USA: Academic Press Professional, Inc., 1992. [10] E. J. Stollnitz, T. D. DeRose, and D. H. Salesin, “Wavelets for computer graphics: A primer, part 1,” IEEE Comput. Graph. Appl., vol. 15, no. 3, pp. 76–84, May 1995. [11] J. Davis and M. Goadrich, “The relationship between precision-recall and roc curves,” in Proceedings of the 23rd international conference on Machine learning, ser. ICML ’06. New York, NY, USA: ACM, 2006, pp. 233–240. [12] R. Ansari and N. Memon, The JPEG lossy image compression standard. Academic Press, 2000. [13] C. Christopoulos, A. Skodras, and T. Ebrahimi, “The JPEG2000 still image coding system: An overview,” IEEE Transactions on Consumer Electronics, vol. 46, pp. 1103–1127, 2000.