2011 IEEE Symposium on Visual Languages and Human-Centric Computing
SketchSet: Creating Euler Diagrams using Pen or Mouse Mengdi Wang, Beryl Plimmer, Paul Schmieder
Gem Stapleton
Peter Rodgers
University of Auckland, NZ {mwan071,bpli001,psch068}@ec.auckland.ac.nz
University of Brighton, UK
[email protected]
University of Kent, UK
[email protected]
Aidan Delaney University of Brighton, UK
[email protected] Abstract—Euler diagrams form the basis of various visual languages but tool support for creating them is generally limited to generic diagram editing software using mouse and keyboard interaction. A more natural and convenient mode of entry is via a sketching interface which facilitates greater cognitive focus on the task of diagram creation. Previous work has developed sketching interfaces for Euler diagrams drawn with ellipses. This paper presents SketchSet, the first sketch tool for Euler diagrams whose curves can be circles, ellipses, or arbitrary shapes. SketchSet allows the creation of formal diagrams via point and click interaction. The user drawn diagram, in sketched or formal format, is automatically converted to a diagram in the other format, thus maintaining both views. We provide a mechanism that allows semantic differences between the sketch and the formal diagram to be rectified automatically. Finally, we present a user study that evaluates the effectiveness of the tool.
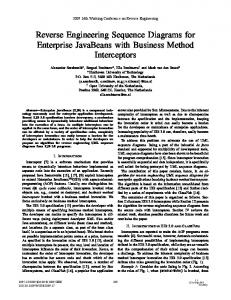
I. I NTRODUCTION Euler diagrams [5], a popular and widely used tool, are collections of labelled closed curves used to visualize relationships between sets, generalizing Venn diagrams [24]. They intuitively represent exclusion, containment and intersection of sets. An example is in Fig. 1, which shows a categorization of countries in the British Isles. The varied application areas
Fig. 1.
The British Isles [11].
of Euler diagrams include, for example: crime control [6], computer file organization [3], classification systems [23], education [12], genetics [15], and medicine [20]. In addition, they
978-1-4577-1247-0/11/$26.00 ©2011 IEEE
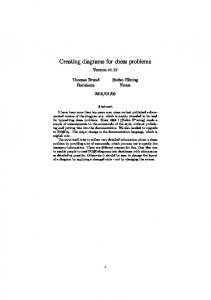
Fig. 2.
A sketch and its formal version.
form a component of many visual languages, such as spider diagrams [9], Euler/Venn diagrams [22], Venn-II diagrams [19], constraint diagrams [14], and concept diagrams [10], [16]. Given their wide-ranging practical use, there is a need to provide convenient ways of creating these diagrams in electronic form. Ideally, the software in which they are created will have some understanding of the diagram semantics, so it can further support the user in exploring the information conveyed. Currently, however, the manual creation of Euler diagrams in electronic form relies on unintuitive mouse and keyboard interfaces in software that has no semantic understanding of the diagram; typically, diagram creation relies on operations, such as pointing, clicking and dragging shapes on to the screen, for which the user needs to understand how to use the software. A natural creation method for general Euler diagrams is using a pen, but no intelligent tool support exists for this mode of entry; currently, the only sketching support restricts Euler diagrams to those drawn with circles and ellipses [4]. The lack of fully developed sketching support for Euler diagrams means that, in the vast majority of cases, when using a computer they must be drawn in off-the-shelf diagram editing tools. The current editing support does not provide a natural and convenient interface because the point-by-point specification of the diagrams’ curves is slow (compared to sketching) and the act of sketching is simple in comparison to using a diagram editor, such as those found in Microsoft’s Word or Visio packages.
75
Sketching the diagram is advantageous in that it allows the user to focus on the actual diagram creation rather than the interface of the editing tools, and it is a useful problem solving and communications technique [8]. In a sketching context, users can produce, evaluate, modify, refine and replace diagram components rapidly. The backtalk from the external representation of the diagram is considered an essential part of the cognitive support for design. Hand-drawing diagrams is more effective for external representation of a problem than using formal computer diagramming tools [7]. To possess these benefits, the computer-based sketch tools interaction must be carefully designed with particular attention to retaining the hand-drawn appearance in the initial stages of the diagram’s creation [17]. However, people often prefer more formal visualizations over the sketch [25]. Therefore, tools should facilitate dual representations and, moreover, allow the user to interact with both the sketch and formal diagram. A user-sketched Euler diagram can be seen on the left of Fig. 2 whereas a formal version is placed on the right. Sketch recognition software developed to date has focused on user interface design and graph oriented diagrams [13]. With respect to user interface design tools the sketched items are largely independent of each other. In graph oriented diagrams the spatial positioning of nodes and edges is not of semantic significance. By contrast, in Euler diagrams the spatial relationships between sketched items is fundamental to their semantics. In particular, it is important to maintain the relative intersection, containment and disjointness of the curves. To our knowledge, our work on Euler diagram sketching is the first to consider these types of complex spatial relationship for sketch recognition and forms an essential basis for devising sketching tools for the many notations that extend Euler diagrams. When converting a sketch of an Euler diagram to a formal representation, the curves are smoothed and, possibly, replaced with standard geometric shapes. This process can inadvertently alter the semantics. Thus, a sketching tool needs to be able to extract abstract representations, which capture the formal semantics, of the sketched and formal visualizations. This is a highly desirable feature, since it allows the software to determine, automatically, whether both the sketch and formal diagram have the same semantics. This permits the correction of differences, ensuring that the users’ intentions are preserved. The user interaction features of SketchSet, our Euler diagram sketching software, are described in section II. SketchSet converts a sketched Euler diagram into a formal visualization that contains circles, ellipses, arbitrary shaped curves, and text. In addition, the user can create formal diagrams via point and click interactions; SketchSet also converts formal diagrams into pseudo hand-drawn diagrams. The process enabling these conversions is described in section III. Section IV presents an algorithm for extracting an abstract representation of both sketched and formal Euler diagrams and describes the techniques that we employ to ensure that both the sketch and formal visualizations have the same formal semantics. We have conducted a user study evaluating SketchSet, presented
76
in section V. This paper extends [4], which considered Euler diagrams drawn with circles or ellipses. In particular, we now have: (a) the inclusion of arbitrary closed curves (blobs), (b) input and editing in the formal view, (c) production of sketches from formal diagrams, and (d) semantic matching via the computation of abstract representations. In addition, the usability study is a novel contribution and it resulted in a number of improvements to SketchSet’s interaction. II. E ULER D IAGRAM C REATION AND E DITING SketchSet allows the user to create Euler diagrams in two ways: via a sketching interface using a stylus or via a formal diagram interface using more traditional point and click operations. This tool is an extension of the existing SketchNode codebase [18]. This section describes the process of creating a sketch or formal diagram, along with the editing functionality provided within SketchSet. In the sketching interface, users create sketches by drawing as on a piece of paper; Fig. 3 shows a screenshot. A stylus stroke is immediately rendered on the canvas as digital ink. On completion of the stroke (stylus up event) it is passed to a gesture recognizer that we have generated using Rata.SSR [1], as described in [4]. We note, though, that a new recognizer was generated since we now allow users to sketch arbitrarily shaped closed curves, which we call blobs, rather than just circles and ellipses. The recognizer result may be one of four classes: the text class or one of the three curve classes, namely circle, ellipse or blob. Curves are immediately coloured, with a colour selected in sequence from a list of 16 colours, and filled with a lighter shade of the same colour. When text is entered it is taken to be a label associated with the closest unlabelled curve and is coloured similarly. This allows the user to readily check the association made by the software and, thus, have an opportunity to change the sketch if necessary. Misclassifications can be corrected by selecting the appropriate stroke in edit mode and tapping on the button for correct classification in the left hand panel of the user interface. The process of label assignment is done on-line, whilst the user is creating the diagram, and adjustments are made as the user performs edits. For instance, if a curve is deleted but its associate label remains then that label may be reassigned to the next closest curve, or assigned to no curve if every remaining curve already has a label. The usual editing functions are supported. In edit mode a stroke or group of strokes can be selected by tapping on the stroke or lassoing a group of strokes. The selected strokes can be moved or resized; when this happens, curve labels are moved with their curves. In erase mode, strokes are removed from the diagram. After any editing event, colouring is updated as appropriate. Progressive undo and redo are available by tapping the buttons at the top of the window. The formal interface provides similar functionality to the sketch interface. Based on experience with SketchNode [18], care has been taken to design simple interactions that are easy
maintained, for example. Of note is that a sketch representation of design problems has been shown to have advantages for eliciting self-talk back and feedback from others [7], [8], [25]. In addition, generating a realistic pseudo-sketch is non-trivial. This section describes the techniques that we have developed to handle this.
Fig. 3.
SketchSet’s sketching interface.
Fig. 4.
Rotating in the formal interface.
to perform with a stylus. A single tap on the canvas creates a circle and opens a textbox for the user to type in the label which is placed at the top left corner of the circle’s bounding box. In edit mode, a selected circle can be stretched to form an ellipse. Also when in edit mode, selected curves can be resized, moved and rotated as shown in Fig. 4. Erase and undo/redo are supported.
A. Converting Sketch to Formal We now describe the process by which we convert the sketched diagrams into formal diagrams. As mentioned in section II, each stroke is recognized immediately it is drawn. The strokes are classified into four categories (label, circle, ellipse, and blob) by the recognizer and the conversion process depends on the recognition results: 1) If an item is recognised as a label then it is sent to an off-the-shelf character recogniser and converted to a formal (type written) label: a formal label is added to the formal panel with the centre coordinate of the formal label the same as that of the original stroke. 2) If an item is recognised as a circle or ellipse it is converted to a formal circle or ellipse, respectively (section III-A1). 3) If an item is recognised as a blob then it is smoothed (section III-A2). 1) Converting Sketched Circles and Ellipses: The process of converting circles is simple: we only need to find the bounding box of the original stroke and create a circle inside the bounding box. Although ellipses look similar to circles, several more steps are necessary [4]. A sketched curve is represented internally by a sequence of points. We find the longest chord across the ellipse by taking the two points that are furthest apart in the internal representation and we then draw a line segment between them. We can calculate the rotation, α, of the sketched ellipse formed by this chord and the x-axis, as in Fig. 5.
α
Fig. 5.
Computing the angle of rotation.
major axis
III. C ONVERSION SketchSet maintains two parallel visualizations of the diagram, sketch and formal, so it must render sketched curves as formal curves and vice versa. Each part has its own challenges: when moving from sketch to formal one could inadvertently change the semantics, and when moving from formal to sketch one has to ensure that the hand-drawn appearance is
minor axis
Fig. 6.
Computing the minor axis.
Next, we rotate the sketched ellipse by α so that this chord is parallel to the x-axis. A standard algorithm is then used
77
to find a bounding box of the sketched ellipse, as shown in Fig. 6. This rectangle is used to create the formal ellipse: the centre of the ellipse is the centre of the rectangle, the major axis takes the width of the rectangle, and the minor axis is the height of the rectangle. Finally, the formal ellipse has rotation α, the same angle of rotation as the sketched version, shown in Fig. 5. Furthermore, we attempt to preserve user intent in this last step, with regard to approximate alignment with the x and y-axis. If α is within 10 degrees of 0 or 90 degrees then we round α accordingly to achieve alignment. 2) Converting Blobs: The last conversion process is when the curve is recognized as a blob. First, smoothing the curve is achieved by removing many of the points from the internal representation because, typically, digital ink capture is very detailed1 and thus includes many unintended wiggles. Only those points where the difference in the x or y value, as compared to x or y value respectively of the neighbouring points, is greater than a given threshold, currently set to 1000 himetric units – a value derived from experiments, are retained. This results in a smoother curve where sharp changes in direction are removed without changing the path of the curve too much. We note that SketchSet is implemented in c#, and the method GraphicsPath.AddClosedCurve(Point[] point) is used to automatically generate a smooth cardinal spline curve that travels through every point in the passed in array. Fig. 7 shows an example of curve smoothing.
Fig. 7.
Fig. 9.
Determining cases for closing curves.
in the sketch, a crosses itself, b is overlapping, and c has a gap. If the stroke crosses itself then the ends are trimmed to the intersection point. When the curve does not cross itself, to determine which of the other two cases exists we draw a line between the beginning and end points and another line between the beginning point and the second point on the curve (i.e. point 2), as shown in Fig. 9. If α is greater than than 90 degrees, we assume the ends do not overlap and can simply joint the start and the end point using a line. In the overlapping case, we draw a normal to the tangent of the sketched curve at each end point, see Fig. 10. We trim each end point back to the first point where the other end point’s normal intersects with the curve. We then simply join the close the curve by joining the new ends. The formal diagram in Fig. 8 shows the result of applying these operations to the sketch.
Smoothing blobs. Fig. 10.
Closing curves.
B. Converting Formal to Sketch
Fig. 8.
Sketched blobs and formal blobs.
Next, the ends of the stroke are joined to form a closed curve. There are three potential situations: the stroke crosses itself, there is a gap between the endpoints, or the stroke overlaps itself without crossing. Fig. 8 shows an example: 1 Digital ink capture is much more dense than mouse capture, storing 10 times as many points.
78
For this conversion process, we take a user created formal diagram and produce a visualization that looks as though it was hand-drawn. The best way that has been found to do this is by building libraries that contain sketched examples of curves and hand written examples of each letter [17]. Whenever we need to create a sketched shape from a formal shape, an example is taken from the library and resized to the bounding box of the formal shape. Currently we use a circle library and a text library. Since, in the formal interface of the software, ellipses can only be obtained by stretching circles, we stretch the corresponding stroke as well. The process of converting a formal diagram in to a sketched visualization can thus be summarized as: 1) If the user added a label then choose a hand-drawn label from a library of hand-drawn examples and scale appropriately.
2) If the user drew a circle then choose a hand-drawn circle from a library of hand-drawn examples and scale appropriately, 3) If the user drew an ellipse then this was done by distorting an already drawn circle. Thus, a corresponding distortion is applied to the hand-drawn circle. In all cases, the pseudo sketched stroke is placed on the sketching canvas with the same center coordinates as the corresponding formal syntax. Fig. 11 shows this process, with a formal diagram on the left and the conversion to a sketched version on the right. Here, the ‘sketched’ curves were chosen from the library, as explained above, and the curve labelled m was formed by distorting a circle that would have originally been drawn in the formal interface before the user stretched it into an ellipse.
Fig. 11.
Converting formal to sketch.
IV. A BSTRACT R EPRESENTATIONS A key feature of SketchSet is its ability to compute the abstract representation of both sketched and formal diagrams, allowing errors in conversion to be automatically rectified. In addition, the abstract representation is displayed to the user, providing feedback pertaining to the diagram semantics, allowing the user to adjust the sketch if the semantics are not as intended. This section describes the process by which we compute the abstract representation and the methods we have devised to rectify any differences between the sketched and formal viewpoints. A. Computing the Abstract Syntax SketchSet has a semantic understanding of the diagram in order to support intelligent user interaction, such as editing, and to ensure correctness of the conversion processes described above. Euler diagrams represent sets using curves and the diagram’s zones completely determine the relationships between the sets. That is, the zones present correspond to the semantics. A zone is a region that can be described as being inside some curves but outside the rest of the curves. For example, both the sketch and formal diagram in Fig. 12 have seven zones described by a (arising from the zone inside only the curve labelled a), b, ab, ac, d, ad, and bd. Such a list of zone descriptors is called an abstract representation. Our algorithm to compute the abstract representation is as follows. First we have three lists, called curveList, waitingList and zoneList. The curve list contains the curves in the diagram. The waiting list contains regions (for example, the set of points in the plane contained by a curve). Regions, with their
Fig. 12.
A sketch with its formal version.
descriptions, are added to the zone list in order to create the abstract representation. During the algorithm, the zone list may contain regions whose descriptions are not part of the abstract representation but these are removed at the last step; an example will be given below. We write d(r) to mean the description of a region, r. The region inside a curve, c, has description {l} where l is the label of c. 1) Initial Step: Draw a bounding box around the closed curves, and add the region inside the bounding box to the waiting list. The description of this region, r∅ , is denoted d(r∅ ) = ∅. 2) Zone List Creation Step: Take the first item in the waiting list, say region r1 , called the current region, and the region, say r2 , inside the first curve on the curve list. Add the region r to the end of the waiting list and add the ordered pair (r, d(r)) to the end of the zone list, where r = r1 ∩ r2
and
d(r) = d(r1 ) ∪ d(r2 ),
provided r contains some points (i.e. is not empty) and (r, d(r)) is not already on the zone list. Otherwise add nothing to the waiting list or the zone list. Iterate through the curve list until all curves have been considered. Remove the first item from the waiting list. Repeat step 2 until the waiting list is empty. 3) Zone List Refinement Step: Iterate through each item in the zone list. For each (ri , d(ri )), find the set of curves, C that do not have labels in d(ri ), and form the region, rC , that is their union. If ri ⊆ rC , then remove (ri , d(ri )) from the zone list. 4) Abstract Representation Extraction Step: Take the zone list and for each pair, (r, d(r)), in the list the description d(r) is in the abstract representation. To illustrate, we will run through the first steps of computing the abstract representation of the sketch in Fig. 12. We have curveList = (a, b, c, d) (blurring the distinction between the curves and their labels). Denote the region inside the bounding box of the sketch by r∅ , which is placed on waitingList, and denote the region inside each curve by ra , rb , rc and rd respectively. For the first iteration, we take r∅ (since this is the only item on the waiting list), and intersect it with ra (since a is the first curve in the curve list), then rb and so forth, removing r∅ from the waiting list. At this point we have waitingList = (ra , rb , rc , rd ) ( ) zoneList = (ra , {a}), (rb , {b}), (rc , {c}), (rd , {d}) .
79
For the second iteration, take ra from the waiting list and form intersections by proceeding through the curve list again. First, we encounter a, but ra ∩ ra = ra and (ra , {a}) is already on the zone list, so nothing is added to the waiting list or the zone list. Next, we encounter curve b, and ra ∩ rb = rab is not empty and has description {a, b}. So, we add (rab , {a, b}) to the end of the zone list and rab to the end of the waiting list. After iterating through all of the curves we have: waitingList = (rb , rc , rd , rab , rac , rad ) ( zoneList = (ra , {a}), (rb , {b}), (rc , {c}), (rd , {d}), ) (rab , {a, b}), (rac , {a, c}), (rad , {a, d}) . After the next full iteration, where the current region is rb , we add only rbd to the waiting list and (rbd , {b, d}) to the zone list. Continuing through the algorithm there are no further changes to the zone list and step 2 terminates with: ( zoneList = (ra , {a}), (rb , {b}), (rc , {c}), (rd , {d}), (rab , {a, b}), (rac , {a, c}), (rad , {a, d}), ) (rbd , {b, d}) . After iterating through the zone list, at step 3, exactly one of the pairs, namely (rc , {c}), is ‘covered’ by a region, rC , that is inside curves, namely ra and rb , whose labels are not in {c} (since the region rc is completely contained by ra ∪ rb ). Thus, the final zone list tells us that the abstract representation is {a}, {b}, {d}, {a, b}, {a, c}, {a, d}, {b, d}. Theorem 1. Let d be a formal Euler diagram. Then the algorithm to compute the abstract representation of d correctly produces the abstract representation of d. That is, the descriptions of the zones in d are precisely those in the abstract representation. Proof Sketch: The idea behind the algorithm is that the zone list creation step essentially starts by forming the regions inside each curve (i.e. a region inside one curve) by intersecting these regions with the bounding box. The second step forms regions that are inside two curves, by intersecting each region at the first step with the regions inside each of the other curves; this creates regions inside two curves. As the iteration proceeds, at the nth step, we create regions inside n curves. Clearly, this process will create at least as many regions as there are zones. Moreover, any region whose description does not correspond to a zone will be ‘covered’ by other regions and, thus, removed at step 3. The abstract representation extracted at step 4 correctly describes the zones in the diagram. The above theorem cannot immediately be stated for sketched Euler diagrams since the user may not have closed all of the curves. This means that the software has to automatically close the curves before it is meaningful to talk of the sketch’s zones. However, after any necessary curve closure has taken place the algorithm correctly produces the abstract representation of the adjusted sketch. Concerning computational complexity we observe:
80
(a) Step 2 iterates through the curve list, creating regions. An upper bound on the number of steps taken here is |C| × 2|C| × 2|C| where C is the set of curves in the diagram (2|C| is the largest number of zones that can be present). (b) Step 3 compares each item, (r, d(r)), in the zone list, of which there are potentially 2|C| , computes the curves whose labels are not in d(r), of which there are at most |C|, and then compares regions giving an upper bound of |C|2 × 2|C| comparisons. (c) Step 4 runs through the zone list, discarding all information about regions and, therefore, has at most 2|C| steps. Thus, the overall complexity is O(|C|2 × 2|C| ). Our algorithm can generate the abstract description of any Euler diagram, including those that possess the properties of concurrency, triple points, non-simple curves and disconnected zones. Hence, it improves on existing work that was limited to so-called well-formed Euler diagrams which do not allow any of these properties to be present [2]. The algorithm in [2], as with our algorithm, has a time complexity that is exponential in the number of curves. This is because the running time of both is dependent on the number of zones, and the maximum number of zones for a set of curves, C, is 2|C| . In most cases the number of zones is significantly smaller than the maximum 2|C| , meaning that in practice our algorithm often runs quickly. B. Rectification of Differences The zones in both the sketch and formal visualizations are recalculated after any change to a diagram. This allows us to check that the conversions have resulted in semantically matching diagrams. Emiprically, we have found no cases where formal diagrams converted to sketch do not have matching abstract representations. The most likely occurrence of a mismatch, converting a sketch to formal, is when a curve that has been converted to an ellipse or circle should be converted to a smoothed blob. Therefore, if there is a difference in abstract representations, we convert the most recently drawn circle or ellipse to a blob and check whether the zones match. If they still do not match then we iterate through the curves affected by the zone error, progressively converting them to blobs and rechecking the zones. If the error is not corrected when all relevant curves are blobs an error message is displayed on the interface, alerting the user of the difference. Fig. 13 shows an example that can be automatically rectified by this process.
Fig. 13.
Differences.
V. U SER S TUDY To assess the usability of SketchSet we conducted a task based usability study. For each task, participants were asked to draw diagrams. The first two tasks asked them to create diagrams in the sketch and formal interface respectively. They were then asked to switch between the sketched and formal views and the final task allowed them to choose which view they used. Usability information was gathered from researcher observation and a questionnaire. In this section we first describe the details of the study methodology and then the results. A. Methodology The twelve participants (8 M, 4 F) aged between 25 and 30 had a varied background including: computer science graduate students (6), information systems students (2). Three had occasionally used pen-based interfaces, all had basic knowledge of set diagrams, but not necessarily Euler diagrams. Each participant undertook the study individually and we captured the screen activity for later review. As our goal is an excellent user experience, we planned to observe enough participants to show any major flaws, fix these and then continue with the study. The study started with the researcher showing the participant how to create and edit diagrams in both views.
Fig. 14.
Examples used in the study.
Participants were then asked to familiarize themselves with the tool by creating a very small diagram in each view. For the initial part of the study, they were then asked to reproduce the diagrams in Fig. 14. The information for each diagram was presented to the participant in multiple steps. They were asked to create, delete, move the curves in a specific order and, in the formal view, to stretch a circle to an ellipse and rotate it. Each instruction was accompanied by a screenshot showing the required diagram. To minimize potential bias caused by the order of tasks, half the participants were asked to create a sketched diagram first followed by a formal diagram; the other half did this in reverse order. Next, participants created a diagram by switching between the views and finally they created a diagram in whichever mode they wished with only
textual instructions provided. After the tasks were completed the participants filled in a qualitative questionnaire. B. Results After seven participants completed the tasks we reviewed the results and made a number of refinements to the interfaces and then continued with the last five participants. The refinements after the first participants were as follows. In both views we noticed people expected the mode buttons for drawing, editing and deleting to be in a different order. Therefore we reordered these to, from top to bottom: draw, edit, delete instead of edit, delete, draw. SketchSet’s question about whether to save the diagram when the new diagram button was clicked was confusing, so we reworded it. Also, participants expected SketchSet to be initially in draw mode when a new diagram was started rather than the mode they were last in, this too was changed. In edit mode labels and curves are moved together - at times participants wanted to move the label separately. We have changed this so that when the curve is moved its label is also moved, but the label can be moved without its curve - in which case it may be disconnected from the current curve and reconnected to a different curve depending on the distance from the curves. In sketch view, labels are attached to the nearest curve so long as that distance is less than a predefined value. For some participants this distance was too short. However, making it too large could mean that if the label is created before the to-be-labelled curve then it may incorrectly be attached to an existing curve, so we have increased the predefined distance by 1.5 times. In formal view, rotation and moving of curves was done by clicking - several participants tried to drag the icons, so we have added drag functionality. After these modifications we recommenced the user study with another five participants. The modifications had the desired effect with users having fewer problems with these functions and no other major issues were identified. We do note that when changing modes some participants try to interact as if they were in the other mode but quickly realize that a different interaction is required. This has also been observed in SketchNode [18], and is a consequence of these dual visualization interfaces. The questionnaire asked participants to rate the software on a scale of 1 to 5, with 5 being the best rating, on a variety of features. The responses for all twelve participants were very positive, with all participants rating the software 4 or 5 on time to complete tasks (m 4.92, sd 0.29 ) and all but one (where the software crashed) rating it 4 or 5 for ease of use (m 4.58 sd 0.67). Notably, the last 5 participants all rated these categories as 5. Conversion between visualization was accurate for most participants with a mean score of 4.50, sd 0.90. We also asked their preferred interface for each of drawing, editing and visualizing the diagrams. There seems to be some relationship between the interface they used first and their preference for drawing: all those who used the sketch interface first preferred that, while those that used the formal first were equally split between sketch and formal. For editing,
81
there was no such pattern with 5 having no preference, 5 preferring formal, and 2 preferring sketch. The visualization was similar: 5 preferred formal, while sketch and no preference were 4 and 3 respectively. This contradicts [25] where users showed a clear preference for the more formal visualizations.
man whiteVanMan m
drives
van
m
Û whiteThing
Fig. 15.
A concept diagram.
C. Recognition Rate During the usability study, the participants drew 312 strokes, of which 156 were labels, 40 were circles, 64 were ellipses and 52 were blobs. We calculated the recognition rates at two levels. First, and most importantly, when determining whether a stroke was a label or a curve, the recogniser was 100% accurate. Labels were then classified by the Microsoft character recogniser, which was 98.71% accurate (i.e. 2 errors out of 156). The success rates for the curves were as follows: 1) Circles: 39 out of 40, 96.15% accurate (one was recognised as an ellipse). 2) Ellipses: 64 out of 64, 100% accurate. 3) Blobs: 50 out of 52, 96.15% accurate (2 were recognised as ellipses). VI. D ISCUSSION AND C ONCLUSION This paper presents the first tool, SketchSet, that supports users in the creation of both sketched and formal Euler diagrams. The user study allowed us to make improvements to SketchSet, as described in the previous section. Of note is that SketchSet provides sophisticated checking to detect (unwanted) semantic differences between the sketched and formal views. To provide this functionality, we devised a general algorithm to compute an abstract representation of sketches and formal diagrams, extending the previous stateof-the-art which was limited to so-called well-formed Euler diagrams. We have used this ability to compute the abstract representation in order to correct semantically significant differences that may arise in the process of converting a sketch to a formal diagram. Of significance is that our work on Euler diagram sketching is the first in the area that takes into account complex spatial relationships between syntactic components (such as curve containment or partial overlap). There are numerous notations that extend Euler diagrams, as described in the introduction, for which the provision of sketching interfaces would be beneficial to users. Of particular interest to us are concept diagrams [10] which are rich enough to specify complex information involving binary relations and quantification over both sets and their elements. The syntax of these diagrams extends Euler diagrams by augmenting them with graphs, arrows, shading, logical operators and quantifiers, as well as rectangles and other items. A simple example can be seen in Fig. 15, which includes some of the extra syntax used in concept diagrams. Extending our foundational work on Euler diagrams to notations such as this will be challenging. ACKNOWLEDGEMENT This research is supported by EPSRC grant EP/H048480/1 and a Royal Society of New Zealand Marsden Grant.
82
R EFERENCES [1] S. Chang, B. Plimmer, R. Blagojevic. Rata.ssr: Data mining for pertinent stroke recognizers. In Sketch Based Interface Modeling. ACM, 2010. [2] G. Cordasco, R. De Chiara, A. Fish. Interactive Visual Classification with Euler Diagrams In IEEE Symposium on Visual Languages and HumanCentric Computing, pp 185-192. IEEE, 2009. [3] R. De Chiara, U. Erra, V. Scarano. VennFS: A Venn diagram file manager. In Information Visualisation, pp 120–126. IEEE, 2003. [4] A. Delaney, B. Plimmer, G. Stapleton, P. Rodgers. Recognising sketches of Euler diagrams drawn with ellipses. In Visual Languages and Computing, pp 305–310. Knowledge Systems Institute, 2010. [5] L. Euler. Lettres a` une Princesse d’Allemagne sur divers sujets de physique et de philosophie. Letters, 2:102–108, 1775. [6] G. Farrell, W. Sousa. Repeat victimization and hot spots: The overlap and its implication for crime control and problem-oriented policing. Crime Prevention Studies, 12:221–240, 2001. [7] V. Goel. Sketches of thought. MIT Press, 1995. [8] G. Goldschmidt. Visual and Spatial Reasoning in Design, chapter The Backtalk of Self-Generated Sketches, pp 163–184. University of Sydney, 1999. [9] J. Howse, F. Molina, J. Taylor, S. Kent, and J. Gil. Spider diagrams: A diagrammatic reasoning system. Journal of Visual Languages and Computing, 12(3):299–324, 2001. [10] J. Howse, G. Stapleton, I. Oliver. Visual Reasoning about Ontologies. International Semantic Web Conference, CEUR volume 658, pages 5-8, 2010 [11] S. Hughes. The Great British Venn diagram. http://qntm.org/uk, accessed July 30, 2010. [12] E. Ip. Visualizing multiple regression. Journal of Statistics Education, 9(1), 2001. [13] G. Johnson, M. Gross, J. Hong. Computational Support for Sketching in Design. Now Publisher Inc., 2009. [14] S. Kent. Constraint diagrams: Visualizing invariants in object oriented modelling. In Proceedings of OOPSLA97, pp 327–341. ACM, 1997. [15] H. Kestler, A. Muller, H. Liu, D. Kane, B. Zeeberg, J. Weinstein. Euler diagrams for visualizing annotated gene expression data. In Euler Diagrams 2005, 2005. [16] I. Oliver, J. Howse, G. Stapleton, E. Nuutila, S. T¨orma. Visualising and Specifying Ontologies using Diagrammatic Logics. In 5th Australasian Ontologies Workshop, CRPIT vol. 112, 2009. [17] B. Plimmer, H. Purchase, H. Laycock. Preserving the hand-drawn appearance of graphs. In Visual Languages and Computing, pp 347–352, 2009. [18] B. Plimmer, H. Purchase, H. Yang. Sketchnode: Intelligent sketching support and formal diagramming. In OZCHI 2010, pp 136–143. ACM, 2010. [19] S.-J. Shin. The Logical Status of Diagrams. CUP, 1994. [20] J. Soriano, K. D. B. Coleman, G. Visick, D. Mannino, N. Pride. The proportional Venn diagram of obstructive lung disease. Chest, 124:474– 481, 2003. [21] G. Stapleton, J. Masthoff, J. Flower, A. Fish, J. Southern Automated Theorem Proving in Euler Diagram Systems. Journal of Automated Reasoning, 39(4):431-470, 2003. [22] N. Swoboda, G. Allwein. Heterogeneous reasoning with Euler/Venn diagrams containing named constants and FOL. In Euler Diagrams 2004, ENTCS. 2005. [23] J. Thi`evre, M. Viaud, A. Verroust-Blondet. Using Euler diagrams in traditional library environments. In Euler Diagrams 2004,ENTCS, pp 189–202. 2005. [24] J. Venn. On the diagrammatic and mechanical representation of propositions and reasonings. Phil.Mag, 1880. [25] L. Yeung, B. Plimmer, B. Lobb, D. Elliffe. Effect of fidelity in diagram presentation. In HCI 2008, pp 35–45. BCS, 2008.