Debugging Error Detection Mechanisms using Error Injection Slicing. Ute Schiffel ..... rently, we only support the generation of a browsable HTML of Se.
Slice Your Bug: Debugging Error Detection Mechanisms using Error Injection Slicing Ute Schiffel
Andr´e Schmitt Martin S¨ußkraut Christof Fetzer TU-Dresden Dresden, Germany {ute, andre, suesskraut, christof}@se.inf.tu-dresden.de
Abstract—Error injection is a well accepted method to evaluate hardware error detection mechanisms. An error detection mechanism is effective if it considerably reduces the amount of silently corrupted output of protected applications compared to unprotected applications. For a good representativeness of the error injection, the error model used has to mirror real world errors as accurately as possible. We introduce Error Injection Slicing (EIS) which emulates the symptoms of hardware errors. Furthermore, EIS provides means to debug single injection runs using slicing. With EIS we make the following novel contributions: (1) easy usage through hardware independence, (2) a symptom-based, flexible and comprehensive error model (e.g., not only bit-flips), and (3) debugging support to improve the detection coverage of the evaluated error detection mechanism. We evaluated the usefulness of the injector by analyzing the AN-encoding compiler that applies an AN-code to applications to facilitate hardware error detection. Keywords-error injection; slicing; error propagation analysis; debugging;
I. I NTRODUCTION For testing fault tolerance mechanisms error injection is a useful and accepted tool. These tools exist for a wide range of fault and error types, e.g., for emulating programmer errors software mutation is used. To test approaches that aim at the detection of hardware errors, we need to inject errors that failing hardware might cause. Existing tools that we discuss in Sec. II either directly modify hardware state or inject symptoms of hardware failures into the running software. We implemented a novel symptom-based error injection because, compared to approaches that inject errors directly into hardware state, symptom-based injection is easier to apply and the results obtained are more general because the injection is hardware independent. For a description of the implemented error model and the error injection process see Sec. III. We did not use any of the existing symptom-based tools for several reasons: 1. Most of these tools implement an insufficient error model that does not represent the whole range of possible errors. Usually just single bitflips are injected. 2. There are tools with an error model comparable to ours but those tools are processor dependent and difficult to use. For example, to use FERRARI [1] the user has to provide a processor model which is a daunting task.
3. We were not able to obtain any of the symptom-based tools. We believe the reason is that most of them date back to the nineties. Thus, it is probable that they are no longer actively developed and supported. This claim is backed up by the fact that in all recent research papers presenting error detection mechanisms custom error injectors are used. But as mentioned earlier those usually just inject single bitflips. The results of error injection campaigns provide information about how well error detection mechanisms cope with errors. Especially interesting is the percentage of errors which cause a silent output corruption, that is, the generated output is different from the output of the fault-free run and no error is reported. In particular, if the rate of these errors is higher than expected, we want to identify the ways where errors circumvent the detection mechanisms. Therefore, we extended our error injection tool EIS with a dynamic forward slicing mechanism. For the errors which interest us – usually the ones which produced a silent data corruption – we can generate a log of the data flow that was influenced by the injected error. The result is a slice of the trace of the complete execution of the tested application that shows only executed instructions whose operands or/and results were influenced by the error. This slice is easier to manually inspect for debugging of the error detection mechanism than a complete log. Slicing is described in Sec. IV and Sec. V presents our evaluation. To summarize, our main contributions are: •
•
•
A hardware independent error injector that injects symptoms of hardware errors. It requires no hardware description or model and, thus, is easy to use. The injector implements a more flexible and comprehensive error model than the currently in symptominjection most often used single bitflip model. The error model is composed of a set of independent error types, which can be individually included in or excluded from the injected error model. Debugging of silent data corruptions is facilitated by the extension of the injector with error slicing. Therefore, the dataflow which is influenced by the injected error is recorded.
To the best of our knowledge, this is the first error injector that is extended with slicing to facilitate the debugging of error detection mechanisms. II. R ELATED W ORK A. Error Injectors In the following we give an overview over error injectors that inject or simulate hardware errors. Physical Injection. The most realistic hardware errors can be injected by directly influencing the hardware, thereby simulating the real causes of hardware errors. Examples are to bombard the processor with heavy ions, radioactive particles or heat, or to inject errors into the pins of a circuit. One example system is the LFI-injector [2] that uses heat generated by a laser. All physical injection methods have in common that they are rather expensive since special hardware and an elaborate setup is required. Furthermore, the system under test might be damaged, and controllability and reproducibility are very low. Debugging error detection mechanisms under these conditions would be very difficult. Simulation-based Tools. Simulation-based tools try to overcome the disadvantages of physical injections while at the same time keeping the advantage of being very realistic. These tools simulate a processor into which gate-level errors (stuck-at-0 or stuck-at-1), bridging errors, or timing errors are injected. Providing such a simulator is a daunting task. The controllability and reproducibility of this approach are bought with high runtime overhead generated by the processor simulator. Both simulation-based tools and physical injection are hardware-dependent. This makes it difficult to test hardwareindependent detection mechanisms. Furthermore, the masking rate for errors injected at such a low level is rather high. Yount and Siewiorek [3] showed that for gate-level injection only 30% of the errors are activated. Wang et. al. [4] and Blome et. al. [5] observed similar high masking rates. Injecting errors directly as symptoms into running applications is more efficient because hardware masking is circumvented. According to Arlat et al. [6] injection at software-level can be used to emulate hardware errors, as long as not only the data segment but also the code segment of an application is subject to injections. Hardware-based Tools. Hardware-based tools use special functionality provided by the hardware to modify the current state of executed software. For example, errors can be injected using the debug and test interfaces of modern CPUs. Software tools can access these interfaces and use them to modify system state. One of the tools following this approach is Xception [7]. Disadvantages are the hardware dependence and the also rather complex setup. Symbolic Error Injection. To apply symbolic error injection, a model of the system and the errors is required. These are analyzed using model checking. Symbolic error injection has the advantage to not just test some possible
configurations but to provide overall information considering error detection capabilities. Furthermore, if an error is not detected, the model checking provides the trace resulting in this undetected error. Example tools are an injection tool based on the formal software verification tool KeY [8] and SymPLFIED [9]. Symbolic error injection inherits the problems of model checking: a model has to be provided or generated, and for larger problem sizes state explosion makes model checking very expensive if not unusable. Software-based Tools. A wide variety of software-based tools for injecting symptoms of hardware errors exists. Most of them just insert single bit flips, an error model we deem insufficient. The tools Ferrari [1] and FINE [10] do not only inject data errors but also control and data flow errors, e.g., by using different input registers or leaving out instructions. But Ferrari requires the specification of a processor model and FINE is tailored for injection into the Linux kernel only. Furthermore, both tools are not freely available or not available anymore. None of the tools supports debugging of error detection mechanisms. B. Software-implemented Error Injections and Their Deficiencies Most of the software-based error injection tools are rather old. Thus, we investigated which injection tools were used in recent research papers to evaluate hardware error detection mechanisms. For recently published error detection mechanisms aiming at general hardware errors solely single bitflips were injected. While the injectors presented in [11] and [12] were implemented using dynamic binary instrumentation, the injector in [13] is realized using static instrumentation. The authors of [14], [15], and [16] described the error model as single bitflip but did not discuss the implementation of the error injection used. For testing the approaches presented in [17] and [18] simulation-based injection of single bitflips was used. But recent studies (e.g., [19] and [5]) show that decreasing feature sizes lead to an increasing number of multiple bitflips. Thus, solely injecting single bitflips is insufficient to test hardware error detection mechanisms. Furthermore, solely injecting into the data segment of an application is not sufficient to emulate all symptoms possibly caused by hardware errors [6]. Injections in the code segment, that is, changing the executed instructions, are also required. Thus, our error model (see Sec. III-B) contains modification of the executed instructions as well. For control flow checking techniques, we see a wide variety of evaluation techniques. It ranges from no evaluation with error injection for the technique presented in [20], over simple modifications of the program counter in [21] to quite elaborate error models implemented in error injections described in [22] and [23]. Especially the gdb-based error injection SFIG used in [23] uses a very comprehensive error model including: replacement of one or two instructions,
usage of wrong operands and wrong result locations, exchanging operators, modification of operands and results, and modification of condition flags. Unfortunately, SFIG is platform-dependent and only supports Sun Sparc machines. C. Slicing Slicing is used in the automatic debugging community. Triage [26] generates slices as bug reports for production systems. Therefore, Triage repeats the last seconds of an application’s execution after a (crash) failure with slicing enabled. Triage computes a backward slice that contains any dataflow leading to the failure. When the developer identifies corrupted output, EIS could also compute a backward slice from the output to the injected error. Dimitrov et al. [27] use slicing similar to Triage to filter anomalies on the dataflow to a given failure. EIS (Error Injection Slicing) uses slicing in another way. It follows the dataflow from a given error to an unknown failure (silently corrupted output). We do not know of any error injection tool that provides the possibility to compute a dynamic forward slice based on the injected error, i.e., enables the user to observe how the error propagates. Several papers, for example [24] and [25], address static analysis of systems to assess the susceptibility of their components to propagate errors. But these approaches are not suitable for debugging error detection mechanisms. D. Derived Design Decisions After reviewing existing error injectors and error injection methods used in recent research papers, we decided to implement a software-implemented symptom-based error injector. Instead of injecting errors directly into the hardware either physically or by using special hardware interfaces, we abstract from the actual hardware error and inject the software-level symptoms of possible hardware failures. The advantages of this approach are manifold: •
•
•
Less masking: Yount and Siewiorek [3] showed that around 70% of the gate-level errors are already masked at the level of architected state, i.e., they never reach application registers. Directly injecting at software-level reduces masking and thus makes the error injection more efficient. Hardware independence: We want to use the error injector to test error detection mechanisms which are hardware-independent. Thus, we also want to test as general as possible, that is, hardware-independent. This is provided by injecting symptoms at software-level. Good controllability and reproducibility: To facilitate debugging of undetected errors using forward slicing it is essential that the error injection is deterministic and easy to control. Since we are injecting errors into an application at the level of machine code, we can exactly determine where we inject which error and when. This
enables very detailed debugging by determining which further instructions are influenced by the error. • Costs and ease of use: Symptom-based error injection requires no additional hardware or software, e.g., processor simulators, processor models or computers for controlling the injection process. This reduces setup costs. Furthermore, compared to simulation-based injections the runtime overhead is much lower. Note that we assume that any non-masked hardware failure results in a software-level symptom. For example, timing issues might lead to a register being written too late. An instruction using this register will use the register’s previous value. We can simulate this with our exchanged operand symptom. Furthermore, we think that the often used single bitflip error model is insufficient because: 1. Arlat et al. [6] showed that errors modifying only the data segment of an application, i.e., processed values, cannot emulate the whole set of possible hardware errors. Only additional modifications of the code segment, that is, which instructions are executed with which data, result in a coverage of possible hardware errors by injected symptoms. 2. Reduced feature sizes in todays and future integrated circuits lead to a growing amount of multiple bitflips [5], [19]. Considering this, we decided to insert a wide variety of symptoms as described in Sec III-B. III. T HE E RROR I NJECTOR In the following we will first give a short introduction to the LLVM compiler framework that we used to implement EIS. Afterwards we describe the implemented error model, and the injector’s implementation. The slicing for debugging undetected errors is presented in the following Sec. IV. A. The LLVM Compiler Framework We insert the symptoms at the level of the LLVM intermediate representation, the so-called LLVM-bitcode [28], of the application’s source code. LLVM-bitcode is a typed static single assignment assembler-like language. An infinite number of registers is available of which each is written at most once but can be read several times. All operators take solely registers as operands. Memory is explicitly accessed using load and store instructions. Note that the error model is not tied to LLVM. It can be easily mapped to other assembler languages and with more difficulty to programming languages. On the other hand the LLVM framework restricts us in the kind of errors we can insert because it performs a restrictive code consistency check. For example, it is not possible to use an undefined register. LLVM’s platform-independence allows simulation of hardware errors independent of any hardware. In contrast
to error injection at source code level, insertion in LLVMbitcode is reasonably easy and allows to realize a wide variety of symptoms of hardware errors. Furthermore, LLVMbitcode is easier to read than assembler and easier to map to the original source code. The forward slice produced by EIS represents the LLVM instructions that were influenced by the error. Since the developer can read LLVM-bitcode and map it to the original source code, that will enable him to detect bugs in his error detection mechanisms. B. The Error Model The injector inserts the following error types that were first introduced by [29]: • Exchange operands (EO1): A different but valid operand is used, that is, instead of the intended operand another register which is already defined and has the same type is used. • Exchange operators (EO2): A different operator is used, e.g., an addition is executed instead of a subtraction. The operands remain the same. • Faulty operations (FO): The result of an operation is modified by bitflips. This can be multiple as well as single bitflips. Every read of the result is influenced by the injected error. • Lost stores (LS): A store operation is omitted. • Modify operands (MO): An operand used by an instruction is modified by a single or a multiple bitflip. In contrast to faulty operations (FO), modify operands (MO) only influences one read of a register. These symptoms represent data and data flow errors. In the future, we will extend the support for control flow errors. Currently they are supported implicitly because any conditional jump can be subject to the existing error model, e.g., a modified or exchanged condition operand. We will add errors modifying existing jump instructions and we will also insert new jump instructions to enable simulation of errors arbitrarily modifying the program counter. Currently only transient errors are inserted. We will also add permanent errors, e.g., an addition which if provided with some specific input will always produce the same error if this input is encountered. The injector supports two different execution modes: • Deterministic: In this mode per run exactly one error is triggered. Usually several thousands of such runs are executed where in each run another error of the same type is triggered. This tests the ability of a detection mechanism to cope with rarely occurring errors. Furthermore, we can determine if an error detection mechanism is especially susceptible to some error types. • Probabilistic (Prob): This mode combines all error types. The user has to provide the probability that an error will occur. At each possible point where an error
could be triggered a random number is generated. The random number and the error probability provided by the user determine if an error is injected or not. Thus, one execution might be hit by several different errors. This mode allows to mirror the fact that for an error detection mechanism which increases code size, the protected program version is more probable to collect errors than the program version without error detection. C. Trigger Points and Error Triggering Injecting errors into an application, which might or might not contain error detection mechanisms, is a two-stage process: First, we statically inject the code which might trigger an error at compile time – the so-called trigger points. Second, when passing a trigger point at runtime, we decide if an error is injected or not. Inserting Trigger Points. We insert trigger points into the application at locations where later during the execution it shall be possible to inject an error. This is done statically at compile time without executing the application. These injected trigger points might become errors at runtime or they might not insert an error. When inserting the trigger points, the user has to decide if he wants do a probabilistic or deterministic injection. For the latter he has to provide the desired error type. Furthermore, he has to provide the trigger frequency that determines how many of the possible trigger points are inserted. If the user chooses a trigger frequency of x, every x-th possible trigger is inserted. Thus, a frequency of one inserts all possible triggers. For example, for the modify operands (MO) error type that means that at runtime every operand used in the application could be replaced with a modified one. For large applications inserting all possible trigger points results in a code explosion. Such large code bases cannot be processed, e.g., translated to machine code and linked. Take, for example, the following LLVM bitcode extract which represents the multiplication of two 32-bit integers: %c = mul i 3 2 %a , %b
After inserting trigger points for the modified operands error type with a trigger frequency of one the code looks as follows: %a b f = c a l l i 3 2 @ b i t f l i p i 3 2 ( i 3 2 %a ) %b b f = c a l l i 3 2 @ b i t f l i p i 3 2 ( i 3 2 %b ) %c = mul i 3 2 %a b f , %b b f
The @bitflip_i32 function gets one argument: the register which might be modified at runtime. At runtime, it will be decided in @bitflip_i32 if an error is injected or if not. This is done using a random number for the probabilistic injection. For the deterministic one-error-perrun injection a counter is incremented at each passed trigger point. The user gives an error ID, i.e., the counter value identifying the passed trigger point at which an error is to be injected. At runtime, when the trigger point with the
given counter value is reached, an error is injected. No other passed trigger point will inject an error for the deterministic injection. If an error is injected, @bitflip_i32 returns a modified version of its argument. Otherwise, it returns the unmodified argument. The original operands in the mul are replaced by the possibly modified versions %a_bf and %b_bf. Implementation of the Error Types. LLVM is a typed language. To simplify presentation, we only present the instrumentation for the LLVM type i32 (32-bit integer). Operands and operators of other types are instrumented accordingly. We have implemented the five error types as follows: •
•
•
•
•
Exchange Operands (EO1): The instrumentation adds a call to @select_operand_i32 (i8 %no_alternative_operands, i32 %original_operand, ...) for each operand that shall be replacable at runtime. The second argument is the original operand. Other operands with which the original operand could be exchanged are passed as vararg. Matching operands are selected by type statically at compile time. The first argument gives the number of passed alternative operands. At runtime, when an error is triggered the function returns the value of one of the other operands. If no error is triggered the original operand’s value is returned. Exchange Operators (EO2): If an operator shall be exchanged, its result goes through the function @exchange_operator_i32 (i32 %result, i32 %op1, i32 %op2, i8 %op) The argument %result is the original result of the operation. The constant %op identifies the original operator (such as add, sub, or, and so on). The original arguments to operator %op are passed as %op1 and %op2. If no error is injected %result is returned. Otherwise, a random operator (different from %op) is applied to %op1 and %op2 and its result is returned. Faulty Operations (FO): The result of any operation whose result we want to modify is passed through @bitflip_i32() as introduced above. Lost Store (LS): All store operations that are to be left out are wrapped by the function @lose_store(i32* %ptr, i32 %val). If no error is injected %val is stored at %ptr. Otherwise, @lose_store returns without doing a store. Modify Operands (MO): The instrumentation for modify operands uses @bitflip_i32() as introduced above.
Triggering Injections. Before executing injection runs, an error-free golden run is executed. Its results are used to determine the effect of the error injection. For example, by comparing the output of the golden run with the output of an error injection one can identify silently corrupted output.
Furthermore, the golden run provides the number of passed trigger points. This number is normally higher than the number of inserted trigger points since injected trigger points located within loops are passed multiple times. The number of passed trigger points is, in the deterministic injection mode, used to determine the actually triggered errors (using their error ID) out of the set of possible triggers. The error IDs used are uniformly distributed over all at runtime passed trigger points. To execute the actual injections the user has to provide the chosen injection mode (deterministic or probabilistic). For the deterministic mode the number of injections has to be provided. For the probabilistic mode the probability with which a trigger point turns into an error is required. This information is used in the trigger points, e.g., the @bitflip_i32 function, to decide if an error is inserted. IV. D EBUGGING WITH F ORWARD S LICING Most hardware error detection tools only detect a certain amount of silently corrupted output failures. However, the question arises, if the remaining undetected failures are caused by the incomplete coverage of the detection approach or by bugs in the error detection. Our debugging support helps to analyze and debug undetected failures. Therefore, EIS presents the developer the complete data flow of an injected error through the application. By inspecting the data flow the developers can find missing checks and missing redundancy in their detection mechanism or just plain bugs in their implementation. Hence, EIS’s debugging support is two-fold. First, it helps to improve the coverage of the error detection approach. Second, it helps to debug the error detection implementation. A. Approach For every injected error e EIS computes a slice Se . Definition 1: The slice Se of an injected error e is the set of all instructions operating on values directly or indirectly influenced by error e. Together with the data flow the slice contains also the control flow influenced by the injected error e. The slice also contains all output instruction that may generate erroneous output because of the injected error. For convenience EIS generates an XML representation of Se . The XML can be automatically post-processed. Currently, we only support the generation of a browsable HTML of Se . The developer can manually inspect Se to analyze and debug why the error e is not detected. Note that a slice is more than a diff between the log of a run with error injection and the log of the golden run. As long as the injected error does not influence the control flow diff and slice are similar. But, if the injected error changes the control flow (e.g., the error changes the conditional value of a conditional branch) a slice follows the injected error. Whereas a diff would contain
1 2 3 4
[ + ] @abs : [ + ] bb1 : %r e g 1 = c a l l i 3 2 @ b i t f l i p i 3 2 ( i 3 2 %tmp0 ) s t o r e i 3 2 %r e g 1 , i 3 2 ∗ %a d d r 1
5 6 7 8
[ + ] bb2 : %r e g 2 = l o a d i 3 2 ∗ %a d d r 1 s t o r e i 3 2 %r e g 2 , i 3 2 ∗ %a d d r 2
9 10 11 12
[+] return : %r e g 3 = l o a d i 3 2 ∗ %a d d r 2 r e t %r e g 3
13 14 15 16 17 18 19 20 21 22 23
[ + ] @main : [ + ] bb4 : %r e g 1 = c a l l i 3 2 @abs ( i 3 2 %tmp0 ) %r e g 2 = add i 3 2 %r e g 1 , %tmp1 s t o r e i 3 2 %r e g 2 , i 3 2 ∗ %a d d r 3 ; ; l o o p s t a r t ( r e p e a t e d 350 t i m e s ) %r e g 3 = l o a d i 3 2 ∗ %a d d r 3 %r e g 4 = add i 3 2 %tmp2 , %r e g 3 s t o r e i 3 2 %r e g 4 , i 3 2 ∗ %a d d r 3 ; ; l o o p end
24 25 26 27
[ + ] bb15 : %r e g 5 = l o a d i 3 2 ∗ %a d d r 3 c a l l v o i d @ p r i n t f ( i 8 ∗ %msg , i 3 2 %tmp3 , i 3 2 %r e g 5 , i 3 2 %tmp4 )
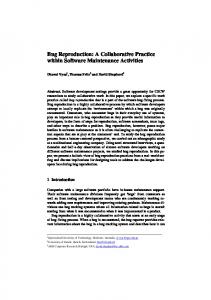
Figure 1. Example slice. The interesting data flow is underlined. A bit-flip is injected in function @abs. It propagates into @main, through a loop and into the output function @printf, where the bit-flip becomes visible as corrupted output.
a mixture of both control flows and not be very helpful anymore. Figure 1 shows a slice of a modified operand error injected into an unprotected application, i.e., an application without any additional hardware error detection mechanisms. The slice consists of a sequence of LLVM instructions. To simplify the presentation, we highlighted the data flow of the error by underlining the registers that were influenced by the injected error. The modified operand is injected into the first operand of the store in line 4 via a call to @bitflip_i32 in the previous line. The error propagates via load and store through the memory (addresses %addr1 and %addr2) until it is returned from function @abs (line 12). Hence, the function call in line 16 returns an erroneous value. The erroneous return value influences an addition in line 17 and then goes into a loop (starting at line 20). For readability, we omitted all but one loop iteration. In line 27 the erroneous value is finally outputted by the external function @printf. B. Implementation Each injected error has a unique error ID (defined in Sec. III-C as the value of the counter of at runtime passed trigger points). Together with the runtime configuration of an injection this allows to deterministically repeat error injection runs. The runtime configuration consists mainly of the seed that defines the randomly flipped bits. To generate a slice for a given error with error ID e, EIS does a single
error injection run with debugging support enabled, where only the error e is triggered. The output of this run is a binary log containing all instruction of the forward data flow derived from e. EIS then converts this log into an XML representation for further processing. EIS’s debugging support consists of a dynamic data flow analysis. The implementation of the data flow analysis consists of two parts: • Shadow instructions trace the data flow of the injected error through the application. • Logging code logs unique IDs of instructions that take part in the traced data flow. The shadow instructions and logging instructions are added after the error injection instrumentation and only if debugging support is enabled. Shadow Instructions. At runtime, each LLVM register r is shadowed by a register rS tracing the data flow of the injected error. Depending on wether the current value of r is part of the traced data flow or not, rS contains one of two values: either INTERESTING or BORING. INTERESTING means the value of r was influenced by the injected error. BORING means it was not influenced. EIS adds shadow instructions and registers as follows: • Constants are shadowed as BORING. • Unary instructions get the same shadow value as their operands. • Instructions with an arity of two and higher are shadowed by the disjunction of its operands, that is, if any of the operands is INTERESTING the result is also. • The injected error is shadowed by INTERESTING. All other error injection points pass-through the shadow values of the original registers. Thus, they are treated as instructions with multiple operands. • Loads and stores are shadowed by accesses to a shadow memory. Each byte in memory is shadowed by a shadow value. Initially, all bytes are shadowed by BORING. A shadow store writes the shadow value of the stored register into the shadow memory at the address of the original store. Similarly, a shadow load reads the shadow value from the shadow memory at the address of the original load. Our shadow memory implementation is derived from [30]. • Functions get one additional argument per original argument carrying the shadow value of the original argument. They also get a second return value representing the shadow value of the original return value. Function calls are instrumented accordingly. Logging. EIS adds to every original instruction a log instruction. The log instruction logs the unique ID of the original instruction, if and only if, at least one operand (or argument in case of function calls) of the original instruction has a shadow value of INTERESTING. After running the application the logged instruction IDs
form the slice. EIS converts the logged IDs, in a post processing step, with the help of the original LLVM code into the XML representation introduced above. V. E VALUATION A. Example Application We used EIS to determine the error detection capabilities of AN-encoded applications generated by our AN-encoding compiler [31]. An AN-code is an arithmetic code. Arithmetic codes in general are a technique to detect hardware errors during runtime. The encoding adds redundancy to all data words. This results in a larger domain for data words and only a small subset of the domain contains the valid code words. Arithmetic codes are conserved by correctly executed arithmetic operations: a correctly executed operation given valid code words as input, outputs a valid code word. A faulty arithmetic operation corrupts the code with high probability, that is, results in an invalid code word [32]. The AN-code is one of the most widely known arithmetic codes. The encoded version xc of variable x is obtained by multiplying its original functional value xf with a constant A. This encoding is only done for input values of a program. All computations take multiples of A as inputs and if executed error-free, produce multiples of A as outputs. Code checking is done by computing the modulus with A, which is zero for a valid code word. Before a variable is externalized, i.e., used as a parameter of an external function or as a memory address in a load or a store operation, it is checked if it is a valid code word. If the check fails, the application is aborted. The advantage of an AN-code is that the probability of detecting an error does not depend on the hardware used but only on the choice of A. Assuming a failure model with equally distributed bit flips and a constant Hamming distance between all code words, the resulting probability of detecting one error is approximately: pdetection = 1 − 2−k , where, k is the size of A in bits. Thus, A should be as large as possible. Large prime numbers are a good choice for A because A should have as few factors as possible to increase the probability of detecting operation errors [29]. For encoding a program with an AN-code, every variable has to be replaced with its larger AN-encoded version. Every instruction is substituted by its AN-preserving counter-part. Executing arithmetic operations on AN-encoded data mostly requires some corrections to obtain a correctly encoded result. For example, consider the multiplication of two encoded values ac = A ∗ af and bc = A ∗ bf . When multiplying ac and bc , the obtained result is A2 ∗ af ∗ bf but the correctly encoded result should be A ∗ af ∗ bf . Thus, an additional division by A is required. Note that the error detection probability pdetection is only defined for errors modifying AN-encoded values. But within an AN-encoded application several helper variables for implementing the encoded operations exist. These could
also be hit by an error. As [29] states an AN-code cannot handle exchanged operands (EO1), exchanged operators (EO2), or lost stores (LS). But this applies only to instructions which are exclusively working on AN-encoded data. Additional correctional actions, e.g., the division by A for an AN-encoded multiplication, use also unencoded data. To summarize, pdetection can only give a general idea of the detection capabilities. Error injection experiments have to provide further information. B. Error Injection Results We evaluated AN-encoding using EIS for following applications: 1. md5 calculates the md5 hash of a string. 2. primes implements the Sieve of Eratosthenes. 3. tcas is an open-source implementation of the traffic alert and collision avoidance system [33] which is mandatory for airplanes. 4. pid is a Proportional-Integral-Derivative controller [34]. All the applications used have to be deterministic since the injection outcomes are determined by comparison with the error-free golden run. For each deterministic error model (EO1, EO2, FO, LS, and MO) we tried to execute 10,000 injection runs for each application and each error model. For some of them, e.g., lose stores (LS), less triggers where available. In this case we injected an error into each at runtime encountered trigger for this error model. For the probabilistic injections we executed 6,000 injection runs per application. Note that those runs might have several errors injected. Figure 2 depicts the obtained results. We applied EIS to the native, i.e., unencoded versions, of the applications and to AN-encoded versions using differently sized As. The evaluation of single injections can result in the following outcomes that are determined by comparing the results (outputs, exit value, and runtime) of the injection run and the error-free golden run: • Silently corrupted output: The error injection resulted in an output that is different from the output produced by the golden run and no error was signaled. • Failure detected: The application aborted with a return value indicating an error. Either an invalid code word was detected and as a result the application was aborted or modified data led to another inconsistency in the program causing a crash. • Correct output: In this case the output of the injection run does not differ from the output of the golden run and no error was indicated. • Performance failure: The injected run of the application runs much longer than the error-free run. In our experiments this was the case for at most 1% of the injections.
normalized behavior in % normalized behavior in % normalized behavior in % normalized behavior in %
Table I RUNTIME AND SPACE OF A FULL LOG COMPARED TO A SLICED LOG FOR FOUR DIFFERENT APPLICATIONS .
100 90 80 70 60 50 40 30 20 10 0
Application
EO1E02 FO LS MO ALLProb
EO1E02 FO LS MO ALLProb
EO1E02 FO LS MO ALLProb
tcas native
A=16777213
A=2147483647
100 90 80 70 60 50 40 30 20 10 0
primes md5 pid tcas Avg.
EO1E02 FO LS MO ALLProb
EO1E02 FO LS MO ALLProb
EO1E02 FO LS MO ALLProb
primes native
A=16777213
A=2147483647
EO1E02 FO LS MO ALLProb
EO1E02 FO LS MO ALLProb
EO1E02 FO LS MO ALLProb
pid native
A=16777213
A=2147483647
EO1E02 FO LS MO ALLProb
EO1E02 FO LS MO ALLProb
EO1E02 FO LS MO ALLProb
md5 native
A=16777213
A=2147483647
100 90 80 70 60 50 40 30 20 10 0 100 90 80 70 60 50 40 30 20 10 0
no error performance failure
correct output failure detected
silently corrupted output
Figure 2. Error injection results for unencoded native and AN-encoded applications with two different As. Each line contains the results of one application for the injection of deterministic errors for each error model (EO1, EO2, FO, LS, and MO), the summary of the deterministic injections (ALL), and the results of the probabilistic injections (Prob).
No error: For probabilistic injections we can encounter injection runs into which no error was injected. To make the probabilistic injections of unencoded (native) and AN-encoded runs comparable we chose the same error probability for both. The increased code path length of AN-encoded applications makes it more probable of being hit by an error while less errors are injected into unencoded native applications because of their shorter code path length. The error injection experiments show that AN-encoding does decrease the rate of silently corrupted output. Furthermore, the results show higher detection rates for the larger •
primes md5 pid tcas Avg. Application
full log 0.017s 0.020s 1.691s 3.649s
full log 458kb 616kb 79,000kb 132,000kb
Runtime for sliced log 0.027s 0.029s 0.106s 0.092s Size of sliced log 4kb 20kb 1,879kb 26kb
Speedup 0.63x 0.7x 15.95x 39.66x 14.48x Reduction 114.5x 30.8x 42.0x 5076.9x 1316.1x
A. The results help to decide where error detection should be improved by complementing the AN-code with other means of error detection. While lost stores (LS) produce surprisingly few runs with silently corrupted output, the rate of undetected errors for exchange operands (EO1) remains rather high. In contrast to the theory published in [29] ANcode is not especially bad in detecting exchanged operator errors (EO2). The reason is, that many instructions of an AN-encoded program are correctional instructions that are required to conserve the code. Modifications in the execution of these instructions most likely lead to invalid code words. Furthermore, the masking rate, i.e., the amount of injection runs which produced the correct output despite the injected error, is application dependent. For md5 it is low while it is very high for tcas. When using physical error injection or error injection based on hardware-simulation this already high masking rate would have been combined additionally with the very high error masking rate of hardware. As a consequence much more experiments than we executed would be required to obtain reasonable results. Thus, using EIS speeds up the reliability assessment. C. Slicing Results It is difficult to objectively evaluate the usefulness of slicing in our context. However, we performed a case study with the four applications introduced in Sec. V-A to give an intuition about the usefulness of our approach. For each application, we executed 10 error injection runs in two configurations. For the first configuration we logged all executed instructions as a full log. The second configuration only logged the sliced log of the data flow of the injected error. Table I shows the results of our experiments. All values for runtime and size are the average of all 10 runs. Logging a slice only is in average 14.48x faster than doing the full log. Data flow analysis needed for slicing introduces some runtime overhead. On one hand, for the two faster executions (primes and md5) the slicing is actually slower
than writing out the full log. However, the absolute runtime with slicing is still shorter than 0.1s. On the other hand, for the long running applications the overhead is more than compensated by the IO overhead of logging all instructions for a full log. The slices are in average 1316.1x smaller than the full log. We believe the space reduction makes it much more feasible to manually inspect the slice than the full log. Automated inspection will also profit from the reduced size. We inspected slices of the error injection results of our safer AN-code that uses additional signatures and version information and was described in [35]. We were able to identify several issues that lead to silent data corruptions. One example is the overflow correction for an AN-code with additional signatures that we described in [35]. The correction is required to ensure correct overflow behavior for computations with encoded values. But for small As it has a vulnerability to exchange operand errors. We found this issue because the number of silent data corruptions for the exchanged error model was unexpectedly high. Slices of runs where operands were exchanged revealed the cause of this vulnerability. For an AN-code with versions a version management is required [36]. We were also able to identify a safety-relevant bug in our version management using the slicing of EIS. VI. C ONCLUSION We presented the error injection tool EIS. EIS implements the injection of symptoms of hardware errors. Injecting symptoms allowed to implement EIS independent of any specific hardware, that is, neither special hardware nor a model of specific hardware is required to execute error injections. Thus, EIS is very easy to use and the setup and runtime costs are low, especially compared to hardwarebased or physical injections. On the other hand, the required abstraction of the error model is not as accurate as realizable with physical injections. Our error model is much more comprehensive than the error models used in recent research papers where usually only single bitflips were injected. Thus, a more accurate emulation of hardware errors than in most currently used error injectors is provided. This facilitates a fine-grained analysis of error detection mechanisms and helps to decide where further protection is required. For example, we have seen that for the AN-encoding compiler lost stores seem to be a less important issue than exchanged operands. To the best of our knowledge, EIS is the first error injector that provides slicing-based debugging of single injection runs. When debugging an error detection mechanism, one wants to find out what caused a silently corrupted output. Therefore, EIS can determine the slice of the application trace which contains the data flow of the injected error. This data flow shows where an error circumvented error detection. Slices generated by EIS are orders of magnitude smaller than complete traces of injection runs. Thus, we believe
slicing makes it easier to spot where an error circumvented error detection. We already discovered such problems in our implementation of an AN-code with signatures and versions. Still the debugging is tedious and could be eased with adequate tool support. For example, a tool helping to map LLVM-bitcode back to the original source code would be helpful. Acknowledgment We would like to thank Ryan Spring, David De Andres, and the reviewers for the comments that improved the paper. This work was supported by the DFG. R EFERENCES [1] G. A. Kanawati, N. A. Kanawati, and J. A. Abraham, “Ferrari: A flexible software-based fault and error injection system,” IEEE Trans. Comput., vol. 44, no. 2, pp. 248–260, 1995. [2] J. J. R. Samson, W. Moreno, and F. Falquez, “A Technique for Automated Validation of Fault Tolerant Designs Using Laser Fault Injection (LFI),” in FTCS ’98: Proceedings of the The Twenty-Eighth Annual International Symposium on Fault-Tolerant Computing. Washington, DC, USA: IEEE Computer Society, 1998, p. 162. [3] C. R. Yount and D. P. Siewiorek, “A Methodology for the Rapid Injection of Transient Hardware Errors,” IEEE Trans. Comput., vol. 45, no. 8, pp. 881–891, 1996. [4] N. J. Wang, J. Quek, T. M. Rafacz, and S. J. Patel, “Characterizing the Effects of Transient Faults on a High-Performance Processor Pipeline,” in DSN ’04: Proceedings of the 2004 International Conference on Dependable Systems and Networks. Washington, DC, USA: IEEE Computer Society, 2004, p. 61. [5] J. Blome, S. Mahlke, D. Bradley, and K. Flautner, “A microarchitectural analysis of soft error propagation in a productionlevel embedded microprocessor,” in In Proceedings of the First Workshop on Architecture Reliability, 2005. [6] J. Arlat, Y. Crouzet, J. Karlsson, P. Folkesson, E. Fuchs, and G. H. Leber, “Comparison of Physical and SoftwareImplemented Fault Injection Techniques,” IEEE Transactions on Computers, vol. 52, no. 9, pp. 1115–1133, 2003. [7] J. Carreira, H. Madeira, and J. G. Silva, “Xception: A Technique for the Experimental Evaluation of Dependability in Modern Computers,” IEEE Trans. Softw. Eng., vol. 24, no. 2, pp. 125–136, 1998. [8] D. Larsson and R. H¨ahnle, “Symbolic Fault Injection,” in Proceedings of 4th International Verification Workshop in connection with CADE-21, Bremen, Germany, July 15-16, 2007. CEUR-WS.org, 2007. [9] K. Pattabiraman, N. Nakka, Z. Kalbarczyk, and R. Iyer, “SymPLFIED: Symbolic program-level fault injection and error detection framework,” Dependable Systems and Networks With FTCS and DCC, 2008. DSN 2008. IEEE International Conference on, pp. 472–481, June 2008. [10] W.-l. Kao, R. K. Iyer, and D. Tang, “FINE: A fault injection and monitoring environment for tracing the unix system behavior under faults,” IEEE Trans. Softw. Eng., vol. 19, no. 11, pp. 1105–1118, 1993.
[11] J. Yu, M. J. Garzaran, and M. Snir, “ESoftCheck: Removal of Non-vital Checks for Fault Tolerance,” in CGO ’09: Proceedings of the 2009 International Symposium on Code Generation and Optimization. Washington, DC, USA: IEEE Computer Society, 2009, pp. 35–46. [12] C. Wang, H. seop Kim, Y. Wu, and V. Ying, “CompilerManaged Software-Based Redundant Multi-threading for Transient Fault Detection,” in International Symposium on Code Generation and Optimization (CGO), 2007. [13] J. Chang, G. A. Reis, and D. I. August, “Automatic Instruction-Level Software-Only Recovery,” in Proceedings of the International Conference on Dependable Systems and Networks (DSN). Washington, DC, USA: IEEE Computer Society, 2006, pp. 83–92. [14] G. A. Reis, J. Chang, D. I. August, R. Cohn, and S. S. Mukherjee, “Configurable Transient Fault Detection via Dynamic Binary Translation,” in Proceedings of the 2nd Workshop on Architectural Reliability (WAR), 2006. [15] N. J. Wang and S. J. Patel, “ReStore: Symptom Based Soft Error Detection in Microprocessors,” in IEEE Transactions on Dependable and Secure Computing. Washington, DC, USA: IEEE Computer Society, 2006, pp. 30–39. [16] G. A. Reis, J. Chang, N. Vachharajani, R. Rangan, and D. I. August, “SWIFT: Software Implemented Fault Tolerance,” in Proceedings of the international symposium on Code generation and optimization (CGO). Washington, DC, USA: IEEE Computer Society, 2005, pp. 243–254. [17] E. L. Rhod, C. A. Lisbˆoa, L. Carro, M. S. Reorda, and M. Violante, “Hardware and Software Transparency in the Protection of Programs Against SEUs and SETs,” J. Electron. Test., vol. 24, no. 1-3, pp. 45–56, 2008. [18] V. Reddy and E. Rotenberg, “Inherent Time Redundancy (ITR): Using Program Repetition for Low-Overhead Fault Tolerance,” in DSN ’07: Proceedings of the 37th Annual IEEE/IFIP International Conference on Dependable Systems and Networks. Washington, DC, USA: IEEE Computer Society, 2007, pp. 307–316. [19] A. Dixit, R. Heald, and A. Wood, “Trends from Ten Years of Soft Error Experimentation,” in System Effects of Logic Soft Errors (SELSE), 2009. [20] E. Borin, C. Wang, Y. Wu, and G. Araujo, “SoftwareBased Transparent and Comprehensive Control-Flow Error Detection,” in Proceedings of the International Symposium on Code Generation and Optimization (CGO). Washington, DC, USA: IEEE Computer Society, 2006, pp. 333–345. [21] A. Vahdatpour, M. Fazeli, and S. G. Miremadi, “Experimental Evaluation of Three Concurrent Error Detection Mechanisms,” in Proceedings of the International Conference on Microelectronics (ICM), 2006, pp. 67–70. [22] R. Vemu and J. A. Abraham, “CEDA: Control-flow Error Detection through Assertions,” in IOLTS ’06: Proceedings of the 12th IEEE International Symposium on On-Line Testing. Washington, DC, USA: IEEE Computer Society, 2006, pp. 151–158.
[23] R. Venkatasubramanian, J. P. Hayes, and B. T. Murray, “Low-Cost On-Line Fault Detection Using Control Flow Assertions,” Proceedings of the 9th IEEE On-Line Testing Symposium (IOLTS), vol. 00, p. 137, 2003. [24] M. Hiller, A. Jhumka, and N. Suri, “An Approach for Analysing the Propagation of Data Errors in Software,” in DSN ’01: Proceedings of the 2001 International Conference on Dependable Systems and Networks (formerly: FTCS). Washington, DC, USA: IEEE Computer Society, 2001, pp. 161–172. [25] W. Abdelmoez, D. M. Nassar, M. Shereshevsky, N. Gradetsky, R. Gunnalan, H. H. Ammar, B. Yu, and A. Mili, “Error Propagation In Software Architectures,” in METRICS ’04: Proceedings of the Software Metrics, 10th International Symposium. Washington, DC, USA: IEEE Computer Society, 2004, pp. 384–393. [26] J. Tucek, S. Lu, C. Huang, S. Xanthos, and Y. Zhou, “Triage: diagnosing production run failures at the user’s site,” SIGOPS Oper. Syst. Rev., vol. 41, no. 6, pp. 131–144, 2007. [27] M. Dimitrov and H. Zhou, “Anomaly-based bug prediction, isolation, and validation: an automated approach for software debugging,” in ASPLOS ’09: Proceeding of the 14th international conference on Architectural support for programming languages and operating systems. New York, NY, USA: ACM, 2009, pp. 61–72. [28] C. Lattner and V. Adve, “LLVM: A compilation framework for lifelong program analysis & transformation,” in Proceedings of the international symposium on Code generation and optimization (CGO). IEEE Computer Society, 2004. [29] P. Forin, “Vital coded microprocessor principles and application for various transit systems,” in IFA-GCCT, Sept 1989, pp. 79–84. [30] N. Nethercote and J. Seward, “How to shadow every byte of memory used by a program,” in VEE ’07: Proceedings of the 3rd international conference on Virtual execution environments. New York, NY, USA: ACM, 2007, pp. 65–74. [31] U. Schiffel, M. S¨ußkraut, and C. Fetzer, “AN-Encoding Compiler: Building Safety-Critical Systems with Commodity Hardware,” in The 28th International Conference on Computer Safety, Reliability and Security (SafeComp 2009), 2009. [32] A. Avizienis, “Arithmetic error codes: Cost and effectiveness studies for application in digital system design,” in Transactions on Computers, 1971. [33] “The Paparazzi Project,” http://paparazzi.enac.fr/wiki/Main Page, 2009. [34] T. Wescott, “PID without a PhD,” Embedded Systems Programming, vol. 13, no. 11, 2000. [35] U. Wappler and C. Fetzer, “Hardware Failure Virtualization Via Software Encoded Processing,” in 5th IEEE International Conference on Industrial Informatics (INDIN 2007), 2007. [36] U. Wappler and C. W. Fetzer, “Software Encoded Processing: Building Dependable Systems with Commodity Hardware,” in The 26th International Conference on Computer Safety, Reliability and Security (SafeComp 2007), 2007.