Noname manuscript No. (will be inserted by the editor)
Smoothness perception Investigation of beat rate effect on frame rate perception Vedad Hulusic · Kurt Debattista · Alan Chalmers
Received: date / Accepted: date
Abstract Despite the complexity of the Human Visual System (HVS), research over the last few decades has highlighted a number of its limitations. These limitations can be exploited in computer graphics to significantly reduce computational cost and thus required rendering time, without a viewer perceiving any difference in resultant image quality. Furthermore, crossmodal interaction between different modalities, such as the influence of audio on visual perception, has also been shown as significant both in psychology and computer graphics. In this paper we investigate the effect of beat rate on temporal visual perception, i.e. frame rate perception. For the visual quality and perception evaluation, a series of psychophysical experiments was conducted and the data analysed. The results indicate that beat rates in some cases do affect temporal visual perception and that certain beat rates can be used in order to reduce the amount of rendering required to achieve a perceptual high quality. This is another step towards a comprehensive understanding of auditory-visual crossmodal interaction and could be potentially used in highfidelity interactive multi-sensory virtual environments. Keywords Perception · Cross-modal interaction · User-study V. Hulusi´ c University Sarajevo School of Science and Technology, Bistrik 7, 71000 Sarajevo, Bosnia and Herzegovina E-mail:
[email protected] K. Debattista International Digital Laboratory, WMG, University of Warwick, Coventry, UK E-mail:
[email protected] A. Chalmers International Digital Laboratory, WMG, University of Warwick, Coventry, UK E-mail:
[email protected]
1 Introduction Despite substantial improvement in the performance of general and dedicated graphics hardware, it is still not possible to generate high-fidelity images of complex scenes on a single machine in real-time. Alternative ways therefore need to be considered to deliver equivalent perceptually high quality images but at a reduced computational cost. One option is to look at the limitations of Human Sensory System (HSS) and take advantage of these in order to benefit the rendering process. A key characteristic of the HSS is cross-modal interaction. This is the influence of one sensory input on the perception of another [13]. One particular cross-modal effect which was exploited in the field of computer graphics is auditory influence on vision [34, 23]. This work was based on previous psychological research results [62, 43, 47]. In current interactive virtual environments, such as video games, typically, more computation time is spent on computing compelling visuals than calculating audio. This is because much of the audio may be prerecorded. This is particulary true when considering physicallybased illumination and character animation, which may have to be computed on a frame by frame basis. In virtual environments, audio - for example music, may be used to create an emotional involvement with the simulation. If the influence of such audio can be exploited, it may be possible to reduce the computation required for the visuals without reducing the perceived visual quality. However, the full emotional influence on a listener caused by music is a very complex phenomenon [41]. Therefore, in this paper, we propose to investigate the more straightforward relationship between specific aspects of audio and video that function in the temporal domain, in particular beat rate and frame rate. If
2
understood and then harnessed correctly, this relationship should make it possible to have a graphics engine that can change the beat rate and the frame rate ondemand to reduce or balance its work load whenever required. This would effectively reduce the computational time of rendering, without the user noticing any perceptual loss in quality. In this paper we present a series of psychophysical experiments that explore this relationship. In the experiments, run with 99 participants the beat rate and frame rate were manipulated for different rendered animations and the perceptual difference in temporal quality was acquired and analysed using statistical analysis.
2 Related Work In the research area of perception more attention has been given to the exploration of the individual senses rather than to the interaction between them. Many examples of limitations of our vision and audition have been investigated. One such limitation of the Human Visual System (HVS) is Inattentional Blindness [33, 52] in which objects that are not the focus of our attention remain as unperceived, although they are in plain sight. Likewise, the Human Auditory System (HAS) has its own limitations such as Auditory Masking, also known as Cocktail Party effect [39], where a person in a noisy environment can mask the background noise and listen to a single talker, and the Continuity Illusion phenomenon [30] which is the ability to reconstruct a discontinued audio and perceive it as it has not been interrupted. There is also one known limitation affecting both vision and hearing called the Internal Spotlight [26,28]. The research on cross-modal interaction between vision and audition is usually focused on either spatial or temporal perception and can be broadly divided into visual affect on audition and auditory affect on vision. Although both aspects are equally important, in this paper we will be focusing on auditory affect on vision, and in particular on the temporal aspect of this effect.
2.1 Audio-visual cross-modal interaction in psychology Auditory-visual cross-modal interaction is apparent in both directions: as video can influence auditory perception, audition is also very influential while being presented along with the visual stimulus. Psychology has investigated many of these phenomena by simulating them in a laboratory. Welch and Warren introduced the “modality appropriateness” hypothesis that was the
Vedad Hulusic et al.
solid base for further investigation of cross-modal interaction [62]. This hypothesis states that the modality which is more accurate and appropriate for a given task will dominate the perception in that particular task. The ventriloquism effect [21, 11, 58, 59] for example, is the direct consequence of the greater spatial acuity of vision. It shows that humans, while watching TV or a puppet show, associate a sound source to a speaking person/puppet’s mouth, even though it originates from the speakers/ventriloquist’s mouth positioned at a different location. Bargary et al. found a strong effect of vision on auditory perception, trying to avoid the ventriloquism effect [4]. Another cross-modal perceptual phenomenon is the McGurk effect [38] where a sound of /ba/ is perceived as /da/ when accompanied with lip movement corresponding to the pronunciation of /ga/. Furthermore, it has been shown that the visual motor information can affect the auditory perception of tempo [56]. Other research has investigated the influence of audio on visual perception. It has been found that audio can affect visual intensity perception [53] and colour change perception in visual search [9]. However, the auditory influence is particularly strong in the temporal domain since the auditory system in that domain has greater acuity. One example of auditory dominance over vision is the auditory driving effect [17, 51, 60, 43] showing that auditory flutter influences the apparent rate of the visual flicker, but not the reverse. However, Roach et al. showed that auditory-visual cross-modal interaction can occur in both directions [45]. Another type of auditory influence on vision is presented in a work by Sekuler et al. [46]. In this case, two visual targets move towards each other and cross. When presented to participants without any sound, the majority report that the targets pass through each other. After introducing a sound at the time of collision, the targets are reported to be bouncing off each other. MoreinZamir et al. showed that the time between two light flashes is perceived longer when a sound is presented before the first and after the second light, but shorter when there are two sound beeps between the lights [40]. This effect is known as temporal ventriloquism [5, 3, 10]. Other interesting phenomena are the illusory flash effect [48, 49] and the Rabbit illusion [29]. These phenomena provide strong evidence of auditory influence on temporal visual perception. Here a single flash accompanied with multiple beeps is perceived as multiple flashes and three visual targets i.e. Rabbits, shown in sequence with the horizontal offsets perceived as five flashes, and thus much smoother, when coupled with five beeps - three beeps presented synchronously with flashes and two inserted between them. Similar work
Smoothness perception
was conducted by Gatzmann in which he investigated visual apparent motion [16]. For a complete overview of the cross-modal influence on visual perception see work by Shams et al. [47] and Shams and Kim [50]. Recanzone and Sutter gave another review of auditory spatial and temporal processing [44].
2.2 Audio-visual cross-modal interaction in computer graphics In the last decade there has been an increased amount of research on cross-modal interaction in the field of computer graphics. However, this work is still very much in its infancy. Mastoropoulou et al., using selective rendering [12] and the inattentional blindness phenomenon [33] showed that when there is a sound emitting object in the scene it is enough to render that object in high quality and the remainder of the scene in much lower quality without significant perceivable difference in quality [36]. Hulusic et al. investigated the impact that audio has on perceivable rendering thresholds of static images [23]. They showed that this threshold is reduced when using unrelated audio and increased in case of the related sound. Storms demonstrated that using high quality audio with video increases the perceived quality of the visual displays [54]. The previous work outlined above, focuses only on spatial perception. However, the temporal domain should not be ignored, as there is some evidence of the auditory influence on temporal visual perception. One of the first papers to tackle this phenomenon was published by Mastoropoulou et al. in 2005 [37]. The authors showed that using sound effects e.g. a ringing phone or the sound of thunder as a distracter in animated content can reduce temporal visual perception. In a recent study, Hulusic et al. investigated how sound effects i.e. foot steps and camera movement speed can affect the frame rate perception [22]. In this paper we investigated the influence of beat rate on the perception of frame rate for dynamic scenes. This is an extension to previous work [24] which focussed on static scenes. Due to the nature of the experimental conditions, the initial paper was first restructured and the statistical analysis redone, followed by the addition of the original work (Section 4.2). More recent work using cross-modal interaction has been done as a part of the CROSSMOD project [20, 7, 57,8]. A full overview can be found in a state-of-the-art report by Hulusic et al. [25].
3
3 Experiments The aim of this study is to investigate how audio and beat rate can influence frame rate perception, by showing a number of participants a series of animations of different scenes, presented at different beat rates and frame rates and asking them to evaluate the quality of each animation. In this section we describe the set up for the experiments, design, participants, apparatus, stimuli, procedure and the analysis. In this paper, we refer to three specific terms: beat rate, frame rate and scene. Beat rate, in this context, is a measure for the frequency of consecutive drum kicks, represented as beats per second. It is often used as a synonym for the tempo. Frame rate, an equivalent in the video context, is a measure for the number of sequential frames (static images), displayed in time - usually represented as frame per seconds. In the paper, term scene is used to define the visual stimulus - the image (static scene) or animation (dynamic scene) used in the experiments. This study consisted of two sets of experiment: one with the static scenes and one with dynamic scenes. In the evaluation of video animation smoothness perception for both data sets, three independent variables were used: scene, beat rate and frame rate. The scene factor involves many dimensions, such as geometry, materials and lighting complexity, as described by Gero and Kazakov [18] and Ramanarayanan et al. [42]. In computer graphics the virtual camera can be fixed or moving throughout the virtual environment. Camera movement can be in the form of translation, rotation or panning, or a combination of any of these movement types. Furthermore, oscillating motions of the camera can be added to improve the sensation of walking/running in a virtual environment [31, 22]. Another parameter that is of great importance in determining the complexity of the visual images presented to the participants is the speed of the camera movement. All this applies to both static and dynamic scenes, which doubles the number of experimental conditions. With regards to sound, which was used as a third independent variable, a sound that should not introduce any strong subjective side effects to the participants, such as emotions, anxiety, excitement, boredom, etc. was chosen. Any of these factors could influence the perception and response of a participant during the psychophysical experiment [35]. 3.1 Design In the study, the perceptual responses of participants were evaluated in a complete randomised design. Static
4
Vedad Hulusic et al.
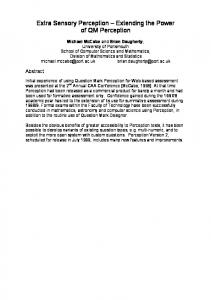
Fig. 1 A sample frame from each static animation used in the study (left to right): Kiti, Rabbit, Kalabsha, Kiti-mentalRay.
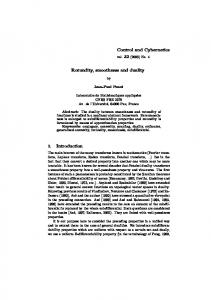
Fig. 2 A sample frame from each dynamic animation used in the study: People (left) and Cars(right).
and dynamic scenes were studied separately, with four static (Figure 1) and two dynamic scenes (Figure 2), using a within-participant design. The former has a fixed scene with a moving camera, while the latter contains some moving object(s) with fixed camera. For both scene groups, the following effects were examined: frame rate, to see if the selected frame rates were appropriate; scene, to see how it can affect the smoothness perception; and beat rate, to see if introduction of audio with different beat rate can affect perceived temporal visual quality when observing an animated content. The scene complexity contains three major elements: scene content, rendering technique used for image generation and camera movement type (for static scenes). This shall be referred to as the scene factor, containing four static scenes named: Kalabsha, Kiti, Kiti-mentalRay and Rabbit; and two dynamic scenes: Cars and People. We considered four different frame rates: 10, 15, 20 and 60fps (frames per second). These conditions will be referred to as FR10, FR15, FR20 and FR60 respectively. For static scenes we used three different audio conditions: no sound, 2 and 6bps (beats per seconds) while for dynamic scenes we used an additional audio condition - 4bps. These conditions will be referred to as BR0, BR2, BR4 and BR6. To measure the perceptual responses of participants we used a single stimulus non-categorical method [27] also known as Interactive Rating Scale method in sound quality studies [19]. Additionally, a post-hoc pairwise comparison was conducted, to see the difference between the ratings for a given effect. Finally, the interaction between the independent variables was investigated. The results of this analysis should inform us if there was a ranking pattern when using
certain combinations of the tested factors, e.g. if users performed higher ranking for all scenes when using high beat rates, or if they performed lower rankings when watching for only one scene at any frame rate. Our hypothesis is that each factor (frame rate, scene and beat rate) affects the perception of the frame rate. All these factors had been shown to affect visual perception. Frame rate has a direct influence on temporal visual perception, and was expected to increase or decrease the smoothness perception by increasing or decreasing the frames-per-second rate respectively [24]. It has been shown previously that scene complexity has several dimensions [18, 42] that could have influence on visual perception. Although this was not the main focus of interest in this study, this relationship has been investigated. Finally, the effect of beat rate on frame rate perception is studied. Based on the findings from psychology (i.e. modality appropriateness hypothesis [62], auditory driving effect [17, 51, 60, 43], temporal ventriloquism [40, 5, 3, 10], illusory flash effect [48, 49] and Rabbit illusion [29]), it is expected that the introduction of frame rate will increase smoothness perception of the observed animations.
3.2 Participants 99 people volunteered in two sets of experiment (49 in the first experiment and 50 in the second), 87 of whom were university students studying a variety of subjects, and the rest were university staff. Out of the 99 participants 75 were male and 24 female. The participants were aged between 18 and 46. The average age was 23.
Smoothness perception
5
Fig. 3 An illustration of the frame rate concept used in the instructions.
All of them reported normal or corrected to normal vision, and no hearing impairments.
seconds of the animation. In the People scene three people entered the frame from the right side and walked towards the camera until they eventually stopped in front of it. All scenes were modeled using Autodesk Maya 8.5.
3.3 Apparatus The experiments were conducted in a dark, quiet room. In the first experiment the visual stimuli were presented on a calibrated Dell E198FPB 19” monitor with 1280 × 1024 pixel resolution and a refresh rate of 60 Hz. In the second set of experiments an LG W2234S 22” monitor was used, with the a refresh rate of 60 Hz at 1680×1050. The stimuli were positioned at eye level, 60-70 cm from the participants’ eyes. The resultant physical stimuli dimensions were the same in both experiments. A LTB Magnum 5.1 AC97 Headphone set was used for audio stimuli.
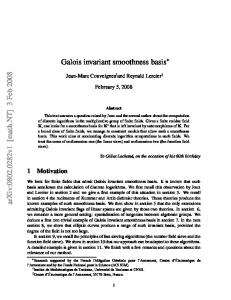
For auditory stimuli we used sounds which should not have an emotional effect on participants, but do have a rhythmical significance. Further more, the synthetic nature of the sound was minimised using two real conga kick sounds recorded live. A looped rhythmical sample was created in Propellerhead Reason 4 software. All sounds were produced using two channels (stereo), sample rate 44100Hz and bit rate of 1411kbps. These audio samples varied just in the beat rate. Both audio and video files were uncompressed. The correlations between beat and frame rates used in the experiments are shown in Figure 4.
3.4 Stimuli In order to control for fatigue and to analyse the behaviour of the participants according to scene variations, in the first experiment four different animations were used, see Figures 1. In the second experiment another two dynamic scenes: (Cars and People) were used, see Figure 2. For static scenes, four different camera movements were considered: translation for Kiti scene, panning for Kiti-mentalRay scene, rotation around own axis for Kalabsha scene, rotation around the object for Rabbit scene. For all translational types of camera movement the same speed was used, which corresponds to a young person’s average normal walking speed of 1.425 m/s [2]. Additionally, for dynamic scenes, a static camera was used, with one or more moving objects. For both dynamic scenes the same virtual environment was used, with cameras at different locations. The Cars scenes consisted of a bus and a few cars moving down a street. The bus stopped within the frame for the last 3.5
ON/OFF signal 6bps 4bps 2bps 60fps 20fps 15fps 10fps 0
1
2
t(s)
Fig. 4 Correlation between beat rates (bps) and frame rates (fps). The diagram shows the number of frames that fit within a beat.
6
Vedad Hulusic et al.
3.5 Procedure Both sets of experiments were conducted using the procedure described below. Prior to the experiment the participants were asked to read and sign a consent form. They were then asked to read the instructions and they were verbally explained the experimental procedure and how to rate the smoothness of the animations. Figure 3 was used to illustrate the effect of frame rate to the participants.
Fig. 6 Preview of the slider bar used in the experiment.
Fig. 5 Two frames from the sample animation.
After being sure participants understood the nature and the purpose of the experiment, they were shown a sample animation (Figure 5) at 10fps and 60fps with no sound, and told that these are the worst and the best cases respectively. Participants were not told what frame rates were involved in either the experiment or the sample animations. After the training phase, they were asked to rate the smoothness of each animation using a slider bar; values ranged from 0 to 100, see Figure 6. In the first experiment 49 participants were shown 60 randomly ordered animations, while in the second experiment all 50 participants evaluated 32 randomly ordered animations. The results from the first five animations in each session were not utilised, but were shown in a fixed order to control for the effects of practise. The data from the dummy presentations were not taken into account when analysing the results of the experiments. After each animation, the slider bar was set to the middle of the bar, i.e. to the value 50. The time for the evaluation of each animation was restricted to 5 seconds. The next animation started automatically after the evaluation period. The total trial time for the first experiment was 16 minutes and 15 seconds and for the second experiment 9 minutes and 15 seconds.
of the presented videos and the experiment is time demanding (the number of comparisons increases rapidly with the inclusion of new levels of factors e.g. with 2, 3, 4, 5 scenes we need 2, 6, 12, and 20 comparisons respectively). Despite these shortcomings, the forced choice pairwise comparison is often used (especially in static pictures with no camera movement) and the statistical methodology is well established for such comparisons. There are several other methods for assessing perceptual image quality, such as these proposed by Wang et al. [61] and Liu et al. [32]. However, all these methods are not suitable for our research as they use static images, not animated stimuli.
3.6 Methods
In this study we used a slider bar to measure perceived smoothness of the animations. The slider bar was chosen because we used not only videos, but auditory stimuli as well. Therefore, side-by-side comparison was not possible. The main challenge of slider bars is that participants may use it in a different way introducing another source of between participant variability into data. In our study about 5-10% of participants tended to use only the middle 50-80 of the 0-100 scale, while others used the whole scale. The first reported analysis of slider bar data is by [1] which gives a good example of how the results can be analysed via exploratory data analysis, using statistics such as the mean and standard deviation. However, this does not show if the observed differences are significant i.e. the differences are due to the effect of a factor or are due to the random variability in the subjective feedback collected. Subsequent sound perception studies suggest using Analysis of Variance (ANOVA) [19].
A commonly used quality and perception evaluation method is pairwise forced choice comparisons. However, this method has some disadvantages, such as the reported subjective preference may depend on the order
For the data analysis the repeated-measures ANOVA method was used. Generally, the analysis of variance is used for testing differences between several means. This method assumes similarity between scores in different treatment conditions, or, put in other words, it
Smoothness perception
assumes that the variances between pairs of scores are roughly equal. This assumption is called the sphericity assumption, and if violated, requires a correction of F-values. Most often Greenhouse-Geisser correction is recommended [14]. This correction (usually denoted as εˆ) varies between 1/k-1 and 1 (k equals to the number of repeated-measures conditions). The closer the εˆ is to 1, the more homogeneous the variances of differences, and hence the closer the data are to being spherical. The statistical analysis was conducted on each user group (static and dynamic scenes) separately. The same procedure was undertaken in both analyses. The effect of each factor on the perception of smoothness was studied in two steps. First, a main effect of the factor was tested using the within participants test. This test tells us if a factor affects the dependent variable, considering the other factors are fixed. Within the same test the interaction between the independent variables was analysed. We looked at the following combinations: scene-beat rate, scene-frame rate and frame rate-beat rate. In the second step a post-hoc pairwise comparison was conducted, looking at the within factor relationship and the variability of the influence of each condition. For the multiple comparisons between the independent variables, where all combinations of groups have to be tested, a familywise error arrises. In order to control for this error, by correcting the level of significance for each test, such that the overall Type I error rate across all comparisons remains at .05, Bonferroni correction was used. Although there are other post-hoc tests, including Tukey’s test, the Bonferroni method is the most robust and controls the alpha value regardless of manipulation.
4 Results The statistical analysis is conducted onto two data sets, acquired separately from the two experiments. In Section 4.1 the results from the first experiment, using static scenes, are presented. Section 4.2 presents the results of the second experiment, where dynamic scenes were utilised. In both analyses the main effect of frame rate (FR), beat rate (BR) and scene were analysed. In addition, the post-hoc pairwise comparison was utilised to see the interaction between the conditions for each factor.
4.1 Static scenes For analysing the data, a 4(FR) × 3(BR) × 4(scene) repeated-measures ANOVA was used. Since all inde-
7
pendent variables completely cross over, there were 48 experimental conditions for each participant. The results of Mauchly’s sphericity test, which is one of the assumptions for repeated-measures ANOVA, showed that the assumption was met only for the effect of beat rate (p = .286) and for the interaction between scene and beat rate (p = .968). For the other two effects and interactions the assumption was violated (p < .05), so Greenhouse-Geisser correction was applied.
Fig. 7 Mean values of subjective scores across static scenes with standard error. All frame and beat rates are pooled.
The within participant test, with corrected F-values, showed the significant main effect of Scene (F(2.55, 122.19) = 52.087; p < .001). Figure 7 shows a mean values for each Scene, across frame rates and beat rates. From this graph, it is clear that Rabbit scene was rated the highest (59.96) and Kalabsha the lowest (43.59). Furthermore, the pairwise comparison for the main effect of Scene, corrected using a Bonferroni adjustment, shows a significant difference between ratings of all scenes, except for the Kiti and KitiMR pair (p = .894). The corrected significance values from the ANOVA test indicate that main effect of frame rates was also significant (F(2.29, 109.76) = 478.54; p < .001). This means that if the scene and BR are ignored, participants’ ratings would differ according to the frame rate used. From the graph in Figure 8 it is clear that the higher the frame rate was the higher ratings were given. This is further confirmed by the pairwise comparison for the main effect of frame rate, corrected using the Bonferroni adjustment. The comparison showed a significant difference between each level (p < .001). This confirms that the chosen frame rates were suitable, i.e. that the differences between each frame rate was distinguishable.
8
Vedad Hulusic et al.
Looking at the interactions between the variables, only the interaction between FR and Scene was found as significant (F(6.76, 324.28) = 25.85; p < .001), see Figure 10. This means that for various scenes, different frame rates are ranked differently. Although, the ranking pattern exists, we can see that the FR15 was ranked significantly higher for Rabbit than for Kalabsha scene. Furthermore, the scores for the Rabbit scene at FR10 and FR15, were higher than for the Kalabsha scene at GR15 and FR20 respectively.
Fig. 8 Mean values of subjective scores across frame rates with standard error. All static scenes and beat rates are pooled.
Fig. 10 Mean values of subjective scores across static scenes and frame rates with standard error.
Fig. 9 Mean values of subjective scores across beat rates with standard error. All static scenes and frame rates are pooled.
Since Mauchly’s sphericity test showed no significant for the effect of beat rate, no correction was needed. The within participants test showed a significant main effect of beat rate (F(2, 96) = 8.23; p = .001). This effect tells us that if we ignore the frame rate and type of scene used, participants would have significantly different ratings for each audio condition. Figure 9 shows the mean ranking values for each beat rate when scenes and frame rates are pooled. The graph shows that BR2 increased and BR6 decreased the perceived animation smoothness comparing to the no sound condition. The pairwise comparison for the main effect of beat rate showed a significant difference between ratings of BR2 and BR6 (p=.002), but not between no sound and BR2 (p = .172) or BR6 (p = .074).
Fig. 11 Mean values of subjective scores across static scenes and beat rates with standard error.
Smoothness perception
Not finding significant interaction between neither Scene and Beat rate nor Beat rate and Frame rate means that a ranking pattern exists. Looking at the graph in Figure 11, it can be seen that, when all frame rates are pooled, the BR2 was always ranked higher than BR0 (no sound). In addition, for all the scenes, BR6 was ranked lower than BR2, while only for the Kalabsha scene it was not ranked lower than BR0.
9
We looked at the main effect of each factor. Additionally, a post-hoc pairwise comparison was conducted, to see the difference between the ratings for each condition of a given effect. Again, the dependent variable was the perceived animation smoothness.
Fig. 13 Mean values of subjective scores across static scenes with standard error. All frame and beat rates are pooled.
Fig. 12 Mean values of subjective scores across frame rates and beat rates with standard error.
Similarly, on the graph in Figure 12, we can see almost identical patterns. There are two differences: for FR60, the no sound condition was ranked the highest; for the FR10 BR6 was ranked as lower than BR0. Finally, no significant interaction between the all three factors was found for the static scenes (F(10.84, 520.2) = 1.003; p = .442). 4.2 Dynamic scenes The data of the second experiment was analysed using a 4(FR) × 4(BR) × 2(scene) repeated-measures ANOVA. As in the first experiment, there were four frame rates (10, 15, 20 and 60FPS). Since, in the first experiment, a significant difference in users’ ratings was found between BR2 and BR6, in the second experiment another beat rate was added, to see the behaviour between the two extremes (BR2 and BR6). Therefore, there were four audio conditions in total (0-no sound, 2, 4 and 6BPS). The main difference between the second and the first experiment was the nature of the scenes. In this experiment two dynamic scenes were used (Cars and People) with moving objects and fixed camera. There were 32 experimental conditions for each participant.
The results of Mauchly’s sphericity test, for dynamic scenes, showed that the assumption was violated for the effect of frame rate (p < .001), beat rate (p < .001) and for the interaction between frame rate and beat rate (p = .023). For these cases Greenhous-Geisser correction was applied. The assumption was met for the other effects and interactions. The within participant test showed the significant main effect of frame rate (F(1.54, 75.49) = 51.497; p < .001) and scene (F(1, 49) = 4.628; p = .036). In case of the frame rate effect the F-value was corrected using Greenhouse-Geisser method. From Figure 13, showing a mean values for both scenes across frame rates and beat rates, it is clear that Cars scene (Mean=57.06) was more preferred than People scene (Mean=52.23). The pairwise comparison, since there were only two scenes, showed the same significance level as the test for the main effect of scene (p < .05). Testing the main effect of frame rate, with corrected F-values, it was found that the frame rates significantly affect user perception of the animation smoothness (F(1.54, 75.49) = 51.497; p < .001), meaning that if the scene and beat rates are ignored, participants’ ratings would differ according to the frame rate. The graph in Figure 14 shows that the higher the frame rate was the the higher the value of the dependent variable. The pairwise comparison, corrected using the Bonferroni adjustment, confirmed this showing the significant difference (p < .05) between each frame rate pair.
10
Fig. 14 Mean values of subjective scores across frame rates with standard error. All dynamic scenes and beat rates are pooled.
Vedad Hulusic et al.
Fig. 16 Mean values of subjective scores across dynamic scenes and frame rates with standard error.
scene, especially for FR10, this difference was found as insignificant (F(3, 147) = 2.512; p = .06). As for the static scenes, there was no significant interaction found between scenes and beat rates (F(3, 147) = 1.442; p = .23). While for the case of Cars scene, the same ranking pattern was found (low frame rates increase and high beat rates decrease the perceived animation smoothness), the mean values for People scene indicate that both low and high beat rates decrease the perceived smoothness, see Figure 17. Mean rankings for no sound condition and BR4 we almost identical. Fig. 15 Mean values of subjective scores across beat rates with standard error. All static scenes and frame rates are pooled.
Although Figure 15 shows the same ranking pattern for the mean values of different beat rates as for the static scenes, when scenes and frame rates are pooled, the within participants test, using Greenhouse-Geisser test showed no significance for the effect of beat rate (F(2.07, 101.54) = 1.592; p = .208). The graph shows that BR2 and BR4 increased the perceived animation smoothness comparing to the no sound condition, while BR6 had the opposite effect, decreasing the perceived smoothness. The pairwise comparison for the main effect of beat rate showed no significant difference between any beat rates (p > .05). Using the same test, no significant interaction between the variables was found. Figure 16 illustrates the interaction between the scenes and frame rates. Although we can see a slight tendency towards Cars
Fig. 17 Mean values of subjective scores across dynamic scenes and beat rates with standard error.
Smoothness perception
The interaction between frame rates and beat rates was not found as significant (F(6.74, 330.49) = 1.711; p = .108). In Figure 18 a similar pattern can be identified, except for the FR10 where both low and high beat rates decreased the perceived smoothness.
Fig. 18 Mean values of subjective scores across frame rates and beat rates with standard error.
Finally, as for the static scenes, no significant interaction has been found between all independent variables (F(9, 441) = .900; p = .525).
5 Discussion In this study we investigated the main effects of beat rate, frame rate and scene on the perception of animation smoothness. We also looked at the effect within and between them. The investigation was done by conducting two sets of experiments with two different participant groups, which resulted in having two separate within participant statistical analyses: for static and for dynamic scenes. Since multiple factors and a correlation between them existed (each participant gives multiple scores), it was important to choose a statistical method which allows testing of one factor while controlling for the effect of the others. The analysis for each of the groups (static and dynamic) consisted of two stages. In the first stage main effects of all three factors were tested using the within participants tests. Additionally, the interaction between the factors was analysed. In the second stage we conducted a post-hoc pairwise comparison for each factor. This was explained in more details in Section 3.6.
11
The results of the analysis for static scenes showed the significant effect of each factor (frame rate, beat rate and scene). Although different rating of the animations played at different frame rates might be considered as obvious, we wanted to make sure that the chosen frame rates were adequate, i.e. distinguishable. Our motivation partially lied in the Wertheimer theory, in which he claims that the HVS tends to blend the successive images shown with a short delay between presentations (between 1/10 and 1/40 of a second) - a phenomenon known as the apparent motion [6]. Another reason for choosing these frame rates is the fact that computer games usually run at 60fps and more, and that standard computer display refresh rate is 60Hz. All this indicates that frame rates between 10fps and 60fps are the ones to be considered. Therefore, the significance of the main effect of frame rate, found by analysing the data, means that ignoring the effect of beat rate and scene, participants were able to distinguish all frame rates used in the experiments. Having this in mind, we wanted to investigate the interaction between the beat rate and frame rate effects. Since beat rate was found as significant factor, a further analysis was performed, looking at the pairs of beat rates and the interaction between them. Looking back at Section 4.1 we can see that there is a significant difference in rating animation smoothness when using slow beat rate (BR2) and fast beat rate (BR6). Interestingly, the audio with slow beat rate tended to increase the perceived animation smoothness, while BR6 had the opposite effect. Although we can not explain this behaviour with certainty, we assume that the effect of low beat rates might be a consequence of the attentional limitations, i.e. inter-modal attentional model [55]. This model proposes that our attention operates on a global level and is not divided across multiple senses. This means that the performance of a task requiring attention for one modality will be affected by concurrent tasks in some other modality. On the other hand, the negative effect of high beat rate on smoothness perception might be a result of the auditory driving effect [17, 51] or temporal ventriloquism [40, 5, 3], or the combination of the two. These phenomena advocate that the auditory stimuli can drive the temporal perception of the visual stimuli. For the third independent variable, the scene factor, a significant main effect was found. The results indicate different perception of animation smoothness for different scenes. As explained in Section 3 this factor has many dimensions, such as virtual scene complexity (geometry, materials and lighting) and virtual camera behaviour (movement type and speed). Therefore, although these findings are important, showing that
12
smoothness perception highly depends on the scene being observed, a further investigation that would look at all these mentioned parameters separately would be useful to further understand the complexities of these variables. A segment of this investigation has been done, showing that the camera movement speed affects the animation smoothness perception [22]. This is the reason why all camera movement speeds in our experiments were the same. For the dynamic scenes, we did not find any significance of the beat rate effect. This again confirms the importance of the scene factor, as discussed in the text above. The other two factors (frame rate and scene) were found as significant. The overall results indicate that the effect of frame rate, beat rate and scene on the smoothness perception of an animation exists. However, since this is the first study to investigate the influence of beat rates on smoothness perception, more work is needed in the future to find a direct relationship between them. This paper represents an extension of the work by Hulusic et al. [24] and Mastotopoulou et al. [34]. Our study was focused on the investigation of a particular segment of the sound - beat rate, and its effect on the perception of frame rate. Further investigation could identify the direct relationship between beat rates and frame rates, by paying more attention to the scene effect. This knowledge could then be used to influence a rendering system, saving computation while maintaining the same perceptual experience within a multimodal environment, for example in interactive systems when scene complexity increases rapidly such that the frame rate is affected. In such a system the beat rate could be manipulated interactively, somewhat akin to time-constrained level-of-detail manipulation [15], such that the drop in frame rate is not perceivable by the viewer. An alternative scenario where the beat rate and frame rate relationship is useful is when computing high-quality animations which are highly computationally expensive and typically require huge resources such as render farms. Under such conditions, if the animation score is known beforehand, the minimal required frame rate could be calculated for each audio segment, significantly reducing the total rendering time without compromising the visual experience. 6 Conclusion and future work This paper demonstrates the significance of all three factors: frame rate, beat rate and scene. The significance of the frame rate factor confirms the appropriate selection of the chosen frame rates. Secondly, it has been shown that the effect of beat rate on visual perception
Vedad Hulusic et al.
can be used to change the perception of the smoothness of an animation for static scenes. The results presented indicate that using audio with low beat rates it is possible to deliver video of a static scene at lower frame rates, while retaining the same perceptual quality. A similar pattern was found with dynamic scenes, but with no significant statistical evidence. Furthermore, it is evident that scene has a significant effect on frame rate perception. Since this study is, to the best of our knowledge, one of the first to investigate this phenomenon, for a more complete understanding of the potential benefit, further investigation is required. In the future, a pilot study investigating the scene effect solely should be undertaken prior to the main investigation of beat rate effect on frame rate perception. The goal of this would be to find the corresponding scenes i.e. scenes which participants perceived as the same in terms of temporal quality, and investigate the beat rate effect on these scene groups separately. Once found, this relationship could lead to the creation of a metric which may be used for increasing the efficiency of high-fidelity rendering in multi-modal environments. Finally, it would also be valuable to investigate the effect of emotions caused by music, so it can be combined with the effect of the beat rate in order to further increase the animation smoothness perception. 7 Acknowledgments The Kalabsha scene was used with the permission of the University of Bristol. The authors would like to thank Gabriela Czanner for helping with the statistical analysis and Piotr Dubla for helping with the video player development. We would like to thank all the volunteers from Sarajevo School of Science and Technology, and Faculty of Electrical Engineering - University of Sarajevo, Bosnia and Herzegovina for participating in the first set of experiments; and students from Universidade de Tr´as-os-Montes e Alto Douro, Portugal for participating in the second set of experiments. Finally, we would like to thank Maximino Esteves Correia Bessa, Selma Rizvi´c, Belma Rami´c, Martinho Gon¸calves and Lu´ıs Gonzaga Mendes Magalh˝aes for their assistance in running the experiments. References 1. Allman-Ward, M., Willimas, R., Dunne, G., Jennings, P.: The evaluation of vehicle sound quality using an nvh simulator (2004) 2. Arif, M., Ohtaki, Y., Nagatomi, R., Inooka, H.: Estimation of the effect of cadence on gait stability in young and elderly people using approximate entropy technique. MEASUREMENT SCIENCE REVIEW 4 (2004)
Smoothness perception 3. Aschersleben, G., Bertelson, P.: Temporal ventriloquism: crossmodal interaction on the time dimension: 2. evidence from sensorimotor synchronization. International Journal of Psychophysiology 50(1-2), 157 – 163 (2003). DOI DOI: 10.1016/S0167-8760(03)00131-4. URL http://www.sciencedirect.com/science/article/B6T3M496NRCY-4/2/68f3e7d7a219eae42df2e87b9b3c4292. Current findings in multisensory research 4. Bargary, G., Chan, J., Newell, F.: Seeing where the ears hear: visual encoding of auditory spatial sequences. In: 8th Annual Meeting of the International Multisensory Research Forum. School of Psychology, University of Sydney (2007) 5. Bertelson, P., Aschersleben, G.: Temporal ventriloquism: crossmodal interaction on the time dimension: 1. evidence from auditory-visual temporal order judgment. International Journal of Psychophysiology 50(1-2), 147 – 155 (2003). DOI DOI: 10.1016/S0167-8760(03)00130-2. URL http://www.sciencedirect.com/science/article/B6T3M496NRCY-8/2/aec36a4acc8face8c31fd27343234c39. Current findings in multisensory research 6. Blake, R., Sekuler, R.: Perception, 5th edn. McGraw-Hill Higher Education (2006) 7. Bonneel, N., Suied, C., Viaud-Delmon, I., Drettakis, G.: Bimodal perception of audio-visual material properties for virtual environments. ACM Transactions on Applied Perception (2009). URL http://wwwsop.inria.fr/reves/Basilic/2009/BSVD09 8. Bonneel, N., Suied, C., Viaud-Delmon, I., Drettakis, G.: Bimodal perception of audio-visual material properties for virtual environments. ACM Trans. Appl. Percept. 7(1), 1–16 (2010). DOI http://doi.acm.org/10.1145/1658349.1658350 9. Van der Burg, E., Olivers, C.N., Bronkhorst, A.W., Theeuwes, J.: Pip and pop: nonspatial auditory signals improve spatial visual search. Journal of experimental psychology. Human perception and performance 34(5), 1053–1065 (2008). DOI 10.1037/0096-1523.34.5.1053. URL http://dx.doi.org/10.1037/0096-1523.34.5.1053 10. Burr, D., Banks, M., Morrone, M.: Auditory dominance over vision in the perception of interval duration. Experimental Brain Research 198, 49–57 (2009). URL http://dx.doi.org/10.1007/s00221-0091933-z. 10.1007/s00221-009-1933-z 11. Choe, C.S., Welch, R.B., Gilford, R.M., Juola, J.F.: The ”ventriloquist effect”: Visual dominance or response bias? Perception and Psychophysics 18(1), 55–60 (1975) 12. Debattista, K.: Selective rendering for high fidelity graphics. PhD in Computer science, University of Bristol (2006) 13. Ernst, M.O., Bulthoff, H.H.: Merging the senses into a robust percept. Trends in Cognitive Sciences 8(4), 162– 169 (2004). DOI DOI: 10.1016/j.tics.2004.02.002. URL http://www.sciencedirect.com/science/article/B6VH94BVP99P-1/2/f345fb0023d0e9065aadcb19ad41714b 14. Field, A.: Discovering Statistics Using SPSS (Introducing Statistical Methods), third edition edn. Sage Publications Ltd (2009). URL http://www.worldcat.org/isbn/1847879071 15. Funkhouser, T.A., S´ equin, C.H.: Adaptive display algorithm for interactive frame rates during visualization of complex virtual environments. In: SIGGRAPH ’93: Proceedings of the 20th annual conference on Computer graphics and interactive techniques, pp. 247– 254. ACM, New York, NY, USA (1993). DOI http://doi.acm.org/10.1145/166117.166149
13 16. Gatzmann, S.: The effect of brief auditory stimuli on visual apparent motion. Perception 36, 1089–1103 (2007) 17. Gebhard, J., Mowbray, G.: On discriminating the rate of visual flicker and auditory flutter. The American journal of psychology 72, 521–529 (1959) 18. Gero, J.S., Kazakov, V.: On measuring the visual complexity of 3d objects. Journal of Design Sciences and Technology 12(1), 35–44 (2004) 19. Giudice, S., Jennings, P., Fry, J., Dunne, G., Williams, R., Allman-Ward, M.: The evaluation of vehicle sound quality using an nvh simulator (2006) 20. Grelaud, D., Bonneel, N., Wimmer, M., Asselot, M., Drettakis, G.: Efficient and practical audio-visual rendering for games using crossmodal perception. In: Proceedings of the ACM SIGGRAPH Symposium on Interactive 3D Graphics and Games (2009). URL http://wwwsop.inria.fr/reves/Basilic/2009/GBWAD09 21. Howard, I.P., Templeton, W.B.: Human spatial orientation [by] I.P. Howard and W.B. Templeton. Wiley, London, New York, (1966) 22. Hulusi, V., Debattista, K., Aggarwal, V., Chalmers, A.: Maintaining frame rate perception in interactive environments by exploiting audio-visual cross-modal interaction. The Visual Computer 27, 57–66 (2011) 23. Hulusic, V., Aranha, M., Chalmers, A.: The influence of cross-modal interaction on perceived rendering quality thresholds. In: WSCG2008 Full Papers Proceedings (WSCG’08), pp. 41–48 (2008) 24. Hulusic, V., Czanner, G., Debattista, K., Sikudova, E., Dubla, P., Chalmers, A.: Investigation of the beat rate effect on frame rate for animated content. In: H. Hauser (ed.) Spring Conference on Computer Graphics 2009, pp. 167–174. ACM SIGGRAPH Press (2009) 25. Hulusic, V., Harvey, C., Tsingos, N., Debattista, K., Steve, W., David, H., Alan, C.: Acoustic rendering and auditory-visual cross-modal perception and interaction. In: Eurographics State-of-the-Art-Reports (2011) 26. Humphreys, G.W., Bruce, V.: Visual Cognition: Computational, Experimental and Neuropsychological Perspectives. Lawrence Erlbaum Associates Ltd, East Sussex, BN3 2FA, UK (1989) 27. International-Telecommunication-Union: Methodology for the subjective assessment of the quality of television pictures. Recommendation ITU-R BT.500-11 28. James, W.: The principles of psychology. Holt, New York (1890) 29. Kamitani, Y., Shimojo, S.: Sound-induced visual ”rabbit”. J. Vis. 1(3), 478–478 (2001) 30. Kelly, M.C., Tew, A.I.: The continuity illusion in virtual auditory space. In: in proc. of AES 112th Convention. Munich, Germany (2002) 31. Lecuyer, A., Burkhardt, J.M., Henaff, J.M., Donikian, S.: Camera motions improve the sensation of walking in virtual environments. In: VR ’06: Proceedings of the IEEE conference on Virtual Reality, pp. 11–18. IEEE Computer Society, Washington, DC, USA (2006). DOI http://dx.doi.org/10.1109/VR.2006.31 32. Liu, Y.J., Luo, X., Xuan, Y.M., Chen, W.F., Fu, X.L.: Image retargeting quality assessment. Computer Graphics Forum 30(2), 583–592 (2011). DOI 10.1111/j.1467-8659.2011.01881.x. URL http://dx.doi.org/10.1111/j.1467-8659.2011.01881.x 33. Mack, A., Rock, I.: Inattentional Blindness. The MIT Press (1998) 34. Mastoropoulou, G.: The effect of audio on the visual perception of high-fidelity animated 3d computer graphics. PhD in Computer science, University of Bristol (2006)
14 35. Mastoropoulou, G., Chalmers, A.: The effect of music on the perception of display rate and duration of animated sequences: an experimental study. In: In Theory and Practice of Computer Graphics 2004 (TPCG04, pp. 128–134 (2004) 36. Mastoropoulou, G., Debattista, K., Chalmers, A., Troscianko, T.: Auditory bias of visual attention for perceptually-guided selective rendering of animations. In: GRAPHITE ’05: Proceedings of the 3rd international conference on Computer graphics and interactive techniques in Australasia and South East Asia, pp. 363–369. ACM, New York, NY, USA (2005). DOI http://doi.acm.org/10.1145/1101389.1101462 37. Mastoropoulou, G., Debattista, K., Chalmers, A., Troscianko, T.: The influence of sound effects on the perceived smoothness of rendered animations. In: APGV ’05: Proceedings of the 2nd symposium on Applied perception in graphics and visualization, pp. 9–15. ACM, New York, NY, USA (2005). DOI http://doi.acm.org/10.1145/1080402.1080404 38. Mcgurk, H., Macdonald, J.: Hearing lips and seeing voices. Nature 264(5588), 746–748 (1976). DOI http://dx.doi.org/10.1038/264746a0. URL http://dx.doi.org/10.1038/264746a0 39. Moore, B.C.: An Introduction to the Psychology of Hearing, 2nd edn. Academic Press (1982) 40. Morein-Zamir, S., Soto-Franco, S., Kingstone, A.: Auditory capture of vision: Examining temporal ventriloquism. Brain research. Cognitive brain research 17, 154– 163 (2003) 41. Parke, R., Chew, E., Kyriakakis, C.: Quantitative and visual analysis of the impact of music on perceived emotion of film. Comput. Entertain. 5(3), 5 (2007). DOI http://doi.acm.org/10.1145/1316511.1316516 42. Ramanarayanan, G., Bala, K., Ferwerda, J.A., Walter, B.: Dimensionality of visual complexity in computer graphics scenes. p. 68060E. SPIE (2008). DOI 10.1117/12.767029. URL http://link.aip.org/link/?PSI/6806/68060E/1 43. Recanzone, G.H.: Auditory influences on visual temporal rate perception. Journal of neurophysiology 89, 1078– 1093 (2003) 44. Recanzone, G.H., Sutter, M.L.: The biological basis of audition. Annual Review of Psychology 59(1), 119–142 (2008). DOI 10.1146/annurev.psych.59.103006.093544 45. Roach, N., Heron, J., McGraw, P.: Resolving multisensory conflict: a strategy for balancing the costs and benefits of audio-visual integration. In: Biological sciences / The Royal Society, pp. 2159–2168 (2006) 46. Sekuler, R., Sekuler, A.B., Lau, R.: Sound alters visual motion perception. Nature 385(6614), 308 (1997). DOI http://dx.doi.org/10.1038/385308a0. URL http://dx.doi.org/10.1038/385308a0 47. Shams L., K.Y., Shimojo, S.: Modulations of visual perception by sound. in the handbook of multisensory processes (eds. calvert, g.a., spence, c. and stein, b.e.) pp. 27–33 (2004) 48. Shams, L., Kamitani, Y., Shimojo, S.: Illusions. what you see is what you hear. Nature 408(6814) (2000). DOI http://dx.doi.org/10.1038/35048669. URL http://dx.doi.org/10.1038/35048669 49. Shams, L., Kamitani, Y., Shimojo, S.: Visual illusion induced by sound. Cognitive Brain Research 14, 147–152 (2002) 50. Shams, L., Kim, R.: Crossmodal influences on visual perception. Physics of Life Reviews (2010). DOI 10.1016/j.plrev.2010.04.006. URL
Vedad Hulusic et al.
51. 52.
53.
54.
55.
56.
57.
58. 59.
60.
61.
62.
http://shamslab.psych.ucla.edu/publications/Physicsof-Life-reviews-reprint.pdf Shipley, T.: Auditory flutter-driving of visual flicker. Science 145, 1328–1330 (1964) Simons, D., Chabris, C.: Gorillas in our midst: sustained inattentional blindness for dynamic events. perception 28, 1059–1074 (1999) Stein, B.E., London, N., Wilkinson, L.K., Price, D.D.: Enhancement of Perceived Visual Intensity by Auditory Stimuli: A Psychophysical Analysis. J Cog Neurosci 8(6), 497–506 (1996) Storms, R.: Auditory-visual cross-modal perception phenomena. PhD thesis, Naval Postgraduate School, Monterey, California (1998) Strayer, D.L., Johnston, W.A.: Driven to distraction: Dual-Task Studies of Simulated Driving and Conversing on a Cellular Telephone. Psychol. Sci. 12(6), 462–466 (2001) Su, Y.H., Jonikaitis, D.: Hearing the speed: visual motion biases the perception of auditory tempo. Experimental Brain Research 214, 357– 371 (2011). DOI 10.1007/s00221-011-2835-4. URL http://dx.doi.org/10.1007/s00221-011-2835-4 Suied, C., Bonneel, N., Viaud-Delmon, I.: Integration of auditory and visual information in the recognition of realistic objects. Experimental Brain Research (2009). URL http://www-sop.inria.fr/reves/Basilic/2009/SBV09. Http://www.springerlink.com/content/jj2w6g7366271237/fulltext.pdf Vroomen, J., Bertelson, P., Gelder, B.d.: A visual influence in the discrimination of auditory location (1998) Vroomen, J., de Gelder, B.: Perceptual effects of crossmodal stimulation: Ventriloquism and the freezing phenomenon. in the handbook of multisensory processes (eds. calvert, g.a., spence, c. and stein, b.e.) pp. 140–150 (2004) Wada, Y., Kitagawa, N., Noguchi, K.: Audio-visual integration in temporal perception. Int J Psychophysiol 50(1-2), 117–124 (2003) Wang, Z., Bovik, A., Sheikh, H., Simoncelli, E.: Image quality assessment: from error visibility to structural similarity. Image Processing, IEEE Transactions on 13(4), 600 –612 (2004). DOI 10.1109/TIP.2003.819861 Welch, R.B., Warren, D.H.: Immediate perceptual response to intersensory discrepancy. Psychological bulletin 88(3), 638–667 (1980). URL http://view.ncbi.nlm.nih.gov/pubmed/7003641