Received 9 April 2015; revised 1 June 2015; accepted 6 July 2015. Date of publication 28 August 2015; date of current version 2 October 2015. Digital Object Identifier 10.1109/LLS.2015.2465870
SNAPR: A Bioinformatics Pipeline for Efficient and Accurate RNA-Seq Alignment and Analysis ANDREW T. MAGIS, CORY C. FUNK, AND NATHAN D. PRICE Institute for Systems Biology, Seattle, WA 98109 USA CORRESPONDING AUTHOR: N. D. Price (
[email protected]) This work was supported in part by NIH/NIA under Grant U01 AG046139 and Grant R01AI084914, in part by the Camille Dreyfus Teacher-Scholar Program, and in part by and BD2K Project under Grant 1U54EB020406-01.
ABSTRACT
The process of converting raw RNA sequencing (RNA-seq) data to interpretable results can be circuitous and time-consuming, requiring multiple steps. We present an RNA-seq mapping algorithm that streamlines this process. Our algorithm utilizes a hash table approach to leverage the availability and the power of high memory machines. SNAPR, which can be run on a single library or thousands of libraries, can take compressed or uncompressed FASTQ and BAM files, and output a sorted BAM file, individual read counts, and gene fusions, and can identify exogenous RNA species in a single step. SNAPR also does native Phred score filtering of reads. SNAPR is also well suited for future sequencing platforms that generate longer reads. We show how we can analyze data from hundreds of TCGA samples in a matter of hours while identifying gene fusions and viral events at the same time. With the reference genome and transcriptome undergoing periodic updates and the need for uniform parameters when integrating multiple data sets, there is great need for a streamlined process for RNA-seq analysis. We demonstrate how SNAPR does this efficiently and accurately. INDEX TERMS
Bioinformatics, biology, biology computing, computational biology, genetic expression,
RNA. I. INTRODUCTION
R
NA sequencing (RNA-seq) is the primary technology used to measure the genome-wide gene expression and the transcriptome variation in biological samples. As of 2015, the NCBI Sequence Read Archive contained over 3.5 petabases of sequencing data, with a projected doubling time of 22.3 months. The explosive growth of next-generation sequence data now exceeds the growth rate of storage capacity [1]. The complexity of the transcriptome presents particular challenges for RNA-seq alignment algorithms. Pseudogenes, paralogs with high sequence similarity, and low complexity/repetitive regions can contribute to misaligned reads. The GENCODE project estimates over 14 000 pseudogenes exist in the human genome [2]. Compounding the alignment challenge is the fact that the new species of RNA continue to be discovered, including novel fusion genes and trans-splicing events. While DNA sequencing is more commonly used to identify genomic rearrangements, RNA-seq used for this purpose can more easily identify functionally aberrant species with a role in pathology [3]. Researchers’ ability to process and analyze the RNA-seq data depends upon the bioinformatics tools that are fast, accurate, and easy to use—especially when applied to large data sets or when additional analyses beyond standard mapping are required. Here, we present a new RNA-seq alignment algorithm based on the DNA-focused Scalable Nucleotide Alignment
22
Program (SNAP) [4]. We call this new alignment algorithm SNAPR (SNAP for RNA, pronounced ‘‘snapper’’). II. METHODS
SNAPR categorizes each putative paired-end alignment based on the transcriptome annotation provided as an input. All valid alignments for each paired-end read are compared to the list of annotated transcripts. If both mates align within the boundaries of an annotated gene, that alignment is categorized as intra-gene. Putative alignments that are not intra-gene but occur on the same chromosome are intra-chromosomal. Finally, putative alignments that cross the chromosome boundaries are categorized as inter-chromosomal. Each paired-end read can have valid alignments that occur in one or more of these categories. SNAPR prioritizes the alignments in the following order: intra-gene; intra-chromosomal; and inter-chromosomal. For example, if a read generates an alignment that is categorized as intra-gene, no alignments in any of the other categories are considered valid, even if those alignments contain fewer mismatches with the reference genome. This categorization is designed to leverage the likelihood of alignments occurring within annotated genes while biasing the algorithm against the inter-chromosomal alignments. As a result, any intra- or inter-chromosomal alignments that do pass through these filters are subsequently more likely to result from real biological
2332-7685 2015 IEEE. Translations and content mining are permitted for academic research only. Personal use is also permitted, but republication/redistribution requires IEEE permission. See http://www.ieee.org/publications_standards/publications/rights/index.html for more information.
VOLUME 1, NO. 2, AUGUST 2015
Magis et al.: SNAPR: A Bioinformatics Pipeline
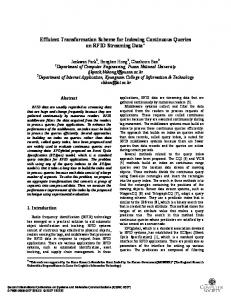
FIGURE 1. (a) ROC curve for variant calling with GATK using 2.5 × 10⁷ 100-bp paired-end reads generated by Mason with Illumina sequencing errors using the Venter genome; 80% of reads were generated from the Ensembl v68 annotation, while 20% were generated directly from the genome. (b) ROC curve for variant calling with GATK using 2.5 × 10⁷ 100-bp paired-end reads generated by Mason with Illumina sequencing errors using the Venter genome; 80% of reads were generated from the Ensembl v68 annotation, while 20% were generated from the annotated pseudogenes. (c) Running times for all four the aligners on 2.5 × 10⁷ paired reads of varying lengths (50, 75, 100, and 125 bp). All processing was performed on 16 cores using an Amazon EC2 cr1.8xlarge instance. (d) Distribution of reads aligning to Epstein–Barr virus Type 1, Epstein-Barr virus Type 2, and cytomegalovirus genomes from 312 processed TCGA stomach adenocarcinoma samples by SNAPR. Read counts were automatically generated using the contamination database functionality implemented in SNAPR. Samples with zero counts are not shown. Note that the x-axis is on a logarithmic scale.
events. A detailed description of the methods can be found at https://price.systemsbiology.net/SNAPR. SNAPR is freely available via the Apache 2.0 license. System requirements for the SNAPR include >40 GB of RAM memory for both the creation of indices and alignment. SNAPR was run on Amazon EC2 cr1.8xlarge instances. An Amazon AMI containing SNAPR is publically available and can also be found at the Price Lab website (above). It is recommended that SNAPR be run on a multi-core machine, containing a solid-state drive for faster index loading. Simulated RNA-seq data were generated using Mason (https://www.seqan.de/projects/mason/) using the Venter genome [5]. SNAPR indices were generated using the GRCh37 genome assembly and the Ensembl v68 human genome annotation. All sequenced viral genomes (1376 genomes), all sequenced fungal genomes (35 genomes), and all sequenced bacterial genomes (2646 genomes) were downloaded from the NCBI FTP site (ftp.ncbi.nih.gov/genomes). A custom Python script was used to select one bacterial genome from each genus to be a part of the contamination database, for a total of 1145 genomes, and 312 RNA-seq samples of stomach adenocarcinoma (STAD), 159 glioblastoma multiforme (GBM), 117 acute myeloid leukemia (LAML), and 808 ovarian serous cystadenocarcinoma were identified and downloaded from the UCSC Cancer Genomics Hub (https://cghub.ucsc.edu). III. RESULTS A. PERFORMANCE OF SNAPR
In order to test the performance and accuracy on the identification of genes from pseudogenes where the ground truth is known, we simulated 2.5 × 10⁶ paired-end VOLUME 1, NO. 2, AUGUST 2015
reads of varying lengths derived from the published Venter genome [5] using Mason [6]. Each data set contained standard Illumina sequencing error rates as well as homozygous and heterozygous variants and indels present in the Venter genome. In the first data set, 80% of the reads were generated from the Ensembl v68 transcriptome (e.g., crossing splice junctions) and 20% were generated directly from the genome. For the second data set, 80% of the reads were generated from the transcriptome as before, but the remaining 20% were generated only from the annotated pseudogenes. This data set was used to estimate mapping and variant-calling accuracies in an exaggerated mapping challenge. We chose three of the most recently published and most used aligners with which to compare: Tophat2/Bowtie2 [7]; STAR [8]; and Subjunc [9]. The Genome Analysis Toolkit v2.5 [10] was used for variant calling in order to estimate the read mapping accuracies; incorrectly mapped reads should generate spurious variants while missing real variants. The receiver operating characteristic (ROC) curves for variant calling are shown in Fig. 1(a). SNAPR was the most accurate aligner on both the data sets, most notably in the presence of excessive pseudogene reads [Fig. 1(b)]. SNAPR was also the fastest aligner when BAM conversion was taken into account: nearly twice as fast as STAR and 25× faster than Tophat2/Bowtie2 [Fig. 1(c)]. We generated a third RNA-seq data set with Mason that contained 2 × 10⁶ paired-end reads with standard Illumina sequencing error rates, again using the Venter genome. This data set was processed using all four. SNAPR and Subjunc are able to generate gene read counts internally, while read 23
Magis et al.: SNAPR: A Bioinformatics Pipeline
FIGURE 2. Aligned gene read counts for 2 × 10⁷ paired-end reads generated by Mason with Illumina sequencing errors using the Venter genome; 100% of reads were generated from the Ensembl v68 annotation and aligned using each of the four tested aligners. Correct read counts (x-axis) for each gene were generated from the Mason SAM file. (a) SNAPR automatically generates gene read counts. (b) Read counts for STAR alignments were generated using htseq-count. (c) Read counts for Subjunc alignments were generated using the featureCounts functionality. (d) Read counts for Tophat2/Bowtie2 alignments were generated using htseq-count.
counts for STAR and Tophat2/Bowtie2 were generated using htseq-count. Computed gene read counts were compared to the exact gene read counts generated by Mason. The scatterplot comparisons are presented in Fig. 2. Among the aligners tested, SNAPR had the best R2 value (0.985) and appeared to have the most even distribution of read-count variation. STAR had the fewest instances where it underestimated read counts, with an apparent bias in the read-count estimation toward higher read counts. Both Subjunc and TopHat/BowTie appeared to have a similar, though less pronounced bias. While gene length is not explicitly a part of the metric, there appears to be some differences in the distribution of error related to gene counts for the different algorithms. B. FEATURES OF SNAPR
SNAPR incorporates the annotation directly into the alignment process to improve alignment accuracy. Each mate (one for single-end and two for paired-end) is aligned to both the genome and the transcriptome independently, creating a set of unique putative alignment positions for mate(s) to both the indices. The final alignment position and subsequent mapping score is determined based on several criteria (see methods). Aligning to both the transcriptome and the genome simultaneously serves a dual purpose: it ensures that all possible alignment positions for a mate are considered, and it allows paired-end reads to cross transcriptome/genome boundaries. While an annotation provides critical prior knowledge about the likelihood of alignment positions, gene boundaries are often truncated at the 50 and 30 ends. SNAPR can also align paired-end reads for which one mate occurs in an intron and the other in an exon, a situation resulting from unannotated exons or sequenced pre-mRNA. The current version of SNAPR is designed for genomes with curated annotations, and does not attempt to find novel splice junctions. To maximize the efficiency of disk usage, SNAPR is capable of natively reading from and writing to BAM format without requiring any external software packages, as well as standard FASTQ 24
and SAM formats. Sample quality is of paramount importance in RNA-seq analysis, including filtering of low-quality reads generated by the sequencer and identification of sample contaminants. SNAPR performs quality filtering of input reads automatically, with the default setting requiring >80% of the read to have a Phred score of 20 or better. Sequenced samples may contain the products of viral infections and/or bacterial or fungal species, either expected or not. SNAPR allows users the option of providing a secondary alignment database of their choosing to which unaligned reads are tested, automatically writing a list of all alternative alignments and corresponding read sequences. All analyses for this letter were performed using our ‘‘contaminant database’’ containing all sequenced viral genomes (1376), fungal genomes (35), and one genome from each sequenced bacterial genus (1145). This database, along with another database containing all sequenced human pathogens derived from PATRIC [11], is available from our download page. To demonstrate the utility of such a ‘‘contaminant database,’’ we analyzed 312 RNA-seq samples of STAD, where the presence of EBV has been previously reported [12]. We identified 70 samples with detectable (>10) and 24 samples with appreciable (>1000) number of reads mapping to the EBV Type 1 genome. Of these, 17 samples contained EBV Type 1 as the strongest identifiable externally mapping target in the report. All of these 17 samples also contained detectable levels of EBV Type 2. In addition, 41 samples contained detectable levels of cytomegalovirus (CMV), with one sample containing CMV as the strongest identifiable externally mapping target. The distribution of the read counts for EBV is shown in Fig. 1(d). We note that among the 1295 GBM, STAD, LAML, and ovarian serous cystadenocarcinoma (OV) samples processed for this letter, only STAD exhibited any appreciable amounts of EBV, as expected. In addition, SNAPR identified ten LAML samples with very high read counts mapping to genus Acinetobacter (∼6 × 10⁶ reads), species of which are commonly associated with hospital-acquired infections in immunocompromised patients. RNA-seq is commonly used for the analysis of differentially expressed genes. The most widely accepted method for estimating statistically significant variation in read counts is based on the negative binomial distribution. This method has been adopted by the R packages DESeq [13] and edgeR [14], among others. The process of generating read counts can add substantial processing time per sample. SNAPR automatically reports all read counts for immediate statistical analysis, with no running time penalty and no additional software required. SNAPR also reports spliced read counts normalized by gene expression for all annotated splice junctions to enable alternative splicing detection. For the identification of fusion genes or trans-splicing events, SNAPR makes use of both the mate pair information and spliced reads to filter out false positives [Fig. 3(a)]. SNAPR automatically reports all putative fusion events in a sorted report as well as GTF format for easy visualization. All read sequences participating in putative fusions are also output automatically. A novel gene fusion was recently identified between the genes FGFR3 and TACC3 in ∼3% of the studied GBM samples [15]. We applied VOLUME 1, NO. 2, AUGUST 2015
Magis et al.: SNAPR: A Bioinformatics Pipeline
package that streamlines basic RNAseq alignment and analysis for large-scale processing. SNAPR enables researchers to leverage hundreds to thousands of samples easily to accurately identify statistically rare patterns of gene expression or other transcriptomic perturbations, while also providing automatic additional detection of contaminants and fusion events. The code and additional detailed documentation can be found at http://price.systemsbiology.net. ACKNOWLEDGMENT
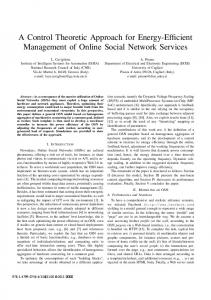
The authors would like to thank R. Pandya, B. Boloski, and T. Sittler for the work on SNAP and comments on this manuscript. REFERENCES FIGURE 3. (a) SNAPR only considers fusion events that are supported by spanning reads as well as spliced reads. (b) SNAPR finds the FGFR3TACC3 fusion event in GBM sample TCGA-27-1835 with thousands of evidentiary reads, and the BCR-ABL1 fusion in the CML sample SRR607562 with nearly 100 evidentiary reads.
SNAPR to the fusion samples (TCGA-27-1835 and TCGA-76-4925) identified in [15], and it reported the TACC3-FGFR3 fusion as the top intra-chromosomal fusion candidate for both samples, with over 20 000 evidentiary reads in sample TCGA-27-1835 and nearly 600 evidentiary reads in sample TCGA-76-4925. Next, we applied SNAPR to a chronic myelogenous leukemia (CML) sample from dbGaP (SRR607562), identifying the canonical BCR-ABL1 fusion gene product as the top inter-chromosomal fusion event with nearly 100 evidentiary reads [Fig. 3(b)]. Recently, Frattini et al. [16] reported the landscape of gene fusions in 58 glioblastoma RNA-seq samples from TCGA. We ran SNAPR on the same 58 samples, partially or completely identifying 93% of the fusions reported in [16] [Fig. 3(c)]. In total, we have processed 312 STAD, 58 GBM, 117 LAML, and 808 OV samples, reading directly from the BAM format, quality filtering all input reads, generating read counts for immediate statistical analysis, identifying putative fusion events and contaminants, and finally writing the new alignments directly back to BAM format. No step of this analysis required any external software package, and was completed using a single command for each sample. As discussed in [16], we find evidence for fusions in GBM involving EGFR, LANCL2, and SEPT14. In addition to the viral and bacterial infections identified in STAD, SNAPR finds evidence for fusions with ERBB2 [17] and IGF2 [18], which are commonly amplified and overexpressed in gastric cancers. Few cancer types are more associated with translocations than leukemia, and SNAPR identifies the canonical fusions in the LAML samples: BCR-ABL1; CBFB-MYH11; RUNX1-RUNX1T1; and PML-RARA. Finally, in the OV samples, SNAPR finds evidence for fusions involving IGF2 [19], H19 [19], GPX3 [20], MUC16 [21], and WNT7A [22]. IV. CONCLUSION
The promise of discovery through RNA-seq is bottlenecked by our ability to analyze the data, and the rate of data generation continues to accelerate. Databases such as TCGA and the NCBI Sequence Read Archive are accumulating petabytes of data. SNAPR provides a fast, accurate, and integrated VOLUME 1, NO. 2, AUGUST 2015
[1] Y. Kodama, M. Shumway, and R. Leinonen, ‘‘The sequence read archive: Explosive growth of sequencing data,’’ Nucl. Acids Res., vol. 40, pp. D54–D56, Jan. 2012. [2] B. Pei et al., ‘‘The GENCODE pseudogene resource,’’ Genome Biol., vol. 13, no. 9, p. R51, 2012. [3] F. Ozsolak and P. M. Milos, ‘‘RNA sequencing: Advances, challenges and opportunities,’’ Nature Rev. Genet., vol. 12, no. 2, pp. 87–98, Feb. 2011. [4] M. Zaharia et al. (Nov. 2011). ‘‘Faster and more accurate sequence alignment with SNAP.’’ [Online]. Available: http://arxiv.org/abs/1111.5572 [5] S. Levy et al., ‘‘The diploid genome sequence of an individual human,’’ PLoS Biol, vol. 5, no. 10, p. e254, 2007. [6] M. Holtgrewe, ‘‘Mason—A read simulator for second generation sequencing data,’’ Freie Univ. Berlin, Berlin, Germany, Tech. Rep., 2010. [7] D. Kim, G. Pertea, C. Trapnell, H. Pimentel, R. Kelley, and S. L. Salzberg, ‘‘TopHat2: Accurate alignment of transcriptomes in the presence of insertions, deletions and gene fusions,’’ Genome Biol., vol. 14, no. 4, p. R36, Apr. 2013. [8] A. Dobin et al., ‘‘STAR: Ultrafast universal RNA-seq aligner,’’ Bioinformatics, vol. 29, no. 1, pp. 15–21, Jan. 2013. [9] Y. Liao, G. K. Smyth, and W. Shi, ‘‘The subread aligner: Fast, accurate and scalable read mapping by seed-and-vote,’’ Nucl. Acids Res., vol. 41, no. 10, p. e108, May 2013. [10] M. A. DePristo et al., ‘‘A framework for variation discovery and genotyping using next-generation DNA sequencing data,’’ Nature Genet., vol. 43, no. 5, pp. 491–498, May 2011. [11] J. J. Gillespie et al., ‘‘PATRIC: The comprehensive bacterial bioinformatics resource with a focus on human pathogenic species,’’ Infection Immunity, vol. 79, no. 11, pp. 4286–4298, Nov. 2011. [12] The Cancer Genome Atlas Research Network, ‘‘Comprehensive molecular characterization of gastric adenocarcinoma,’’ Nature, vol. 513, no. 7517, pp. 202–209, Sep. 2014. [13] S. Anders and W. Huber, ‘‘Differential expression analysis for sequence count data,’’ Genome Biol., vol. 11, no. 10, p. R106, 2010. [14] M. D. Robinson, D. J. McCarthy, and G. K. Smyth, ‘‘edgeR: A bioconductor package for differential expression analysis of digital gene expression data,’’ Bioinformatics, vol. 26, no. 1, pp. 139–140, Jan. 2010. [15] D. Singh et al., ‘‘Transforming fusions of FGFR and TACC genes in human glioblastoma,’’ Science, vol. 337, no. 6099, pp. 1231–1235, Sep. 2012. [16] V. Frattini et al., ‘‘The integrated landscape of driver genomic alterations in glioblastoma,’’ Nature Genet., vol. 45, pp. 1141–1149, Aug. 2013. [17] C. Gravalos and A. Jimeno, ‘‘HER2 in gastric cancer: A new prognostic factor and a novel therapeutic target,’’ Ann. Oncol., vol. 19, no. 9, pp. 1523–1529, Sep. 2008. [18] M.-S. Wu et al., ‘‘Loss of imprinting and overexpression of IGF2 gene in gastric adenocarcinoma,’’ Cancer Lett., vol. 120, no. 1, pp. 9–14, Nov. 1997. [19] S. K. Murphy et al., ‘‘Frequent IGF2/H19 domain epigenetic alterations and elevated IGF2 expression in epithelial ovarian cancer,’’ Molecular Cancer Res., vol. 4, no. 4, pp. 283–292, Apr. 2006. [20] C. D. Hough, K. R. Cho, A. B. Zonderman, D. R. Schwartz, and P. J. Morin, ‘‘Coordinately up-regulated genes in ovarian cancer,’’ Cancer Res., vol. 61, no. 10, pp. 3869–3876, May 2001. [21] C. Thériault et al., ‘‘MUC16 (CA125) regulates epithelial ovarian cancer cell growth, tumorigenesis and metastasis.,’’ Gynecol. Oncol., vol. 121, no. 3, pp. 434–443, Jun. 2011. [22] S. Yoshioka et al., ‘‘WNT7A regulates tumor growth and progression in ovarian cancer through the WNT/β-catenin pathway,’’ Molecular Cancer Res., vol. 10, no. 3, pp. 469–482, Mar. 2012. 25