Доклади на Българската академия на науките Comptes rendus de l’Acad´ emie bulgare des Sciences Tome 66, No 1, 2013
EXPLORATIONS COSMIQUES
SOA-BASED INTENSIVE SUPPORT SYSTEM FOR SPACE RADIATION DATA Mariana Goranova, Jordanka Semkova∗, Bogdan Shishedjiev, Stefka Genova (Submitted by Corresponding Member P. Velinov on June 27, 2012)
Abstract Modern data intensive science involves heterogeneous and structured data sets in sophisticated data formats. Scientists need access to distributed computing and data sources and support for remote access to expensive, multinational specialized instruments. Scientists need effective software for data analysis, querying, accessing and visualization. The interaction between computer science and science and engineering becomes essential for the automation of data manipulation. The key solution uses the Service-oriented Architecture (SOA) in the field of science and Grid computing. The goal of this paper is managing the scientific data received by the Lyulin-5 particle telescope used in MATROSHKA-R experiment performed at the International Space Station (ISS). The dynamics of radiation characteristics and their dependency on the time and the orbital parameters have been established. The experiment helps the accurate estimation of the impact of space radiation on human health in long-duration manned missions. Key words: Grid, e-Science, Service-oriented Architecture, virtual observatory, space radiation data, International Space Station
1. Introduction. The increasing amount of data received from experiments and observations on Earth and in space together with the availability of fast digital network access create a demand for processing, querying, accessing and retrieving data. Scientists need tools to capture, organize, analyze, visualize and This work is partially supported by Grant Numbers DO 02-175/2008 and DID02/8 from the National Science Fund of the Ministry of Education, Youth and Science in Bulgaria.
83
understand the data that they have collected from experiments and simulation. Grid technologies can help solve scientific problems by organizing data processing in new ways and by automating many of the tasks. The vision of Licklider in the 1960s for the future was described in [1 ] as “everybody could use computers anywhere and get at data anywhere in the world”. This vision is much close to the modern science problems. The data intensive science or e-Science [2 ] involves a set of tools and technologies required to support collaboration between domain specific science and computer science and engineers. Today researchers need access to distributed computing and remote access to data received from expensive, multi-national experiments as MATROSHKA-R performed at the International Space Station (ISS). Generated data in different formats have to be stored, processed and visualized. Service-oriented approach helps scientific communities to make information tools accessible as services. Service-oriented Architecture (SOA) is the software architecture that enables loosely-coupled integration and interoperability of distributed heterogeneous system. The research is in the area of “scientists’ smart lab environment” – methods on scientific data management and visualization in distributed and heterogeneous environment. The SOA-based approach enables data description, sharing, analysis and visualization. Our design policy is to understand the metadata, the quality of the data, where and how it was produced. Recording the details of the process by which data sets were derived helps to solve the problem with the distribution and heterogeneity of data. The power of databases is used to allow effective interactions with data and an interface, which can be exploited by the toolkits available, for purposes such as visualization and plotting. Our system address this scientific process and provides functionality to scientists, who access it over the web. Scientists upload the data they generate into the system and describe it with metadata. There are services that help to create a XML description using a specific XML-based language, convert this description into canonical XML form and map it into relational database. A further development of this work will be to generate services to allow scientists to query and access data of interest, to analyze and visualize data. Our e-Science project applies Grid computing technologies that integrate distributed heterogeneous data sources, computational resources and storage resources across multiple organizational domains. This work is collaboration between the Space Research and Technologies Institute, Bulgarian Academy of Sciences (BAS) and the Department of Programming and Computer Technologies, Technical University of Sofia. The advantages in data management, analysis, knowledge discovery and visualisation empower the scientists to achieve new scientific breakthroughs. 2. Related work. The space physics data environment requires integration of data and models across many missions and data centres. The data comes 84
M. Goranova, J. Semkova, B. Shishedjiev et al.
from different instruments and missions. This environment uses the paradigm of virtual observatories (VOs) – software applications that allow users to find and access distributed data sources in uniform ways. VOs include the following components [3 ]: • web-based, machine/application-accessible active archives of data from spacecrafts or models; • registers of products and services based on a data model; • front-end applications – portals through which users access the data and services; • brokers (gateways) to connect the repositories to front ends that translate queries in data model terms into requests to specific repositories; • services that transform data into useful formats, visualize data; • higher-order search capabilities. Multiple VOs have been designed [4 ]. GAIA (Global Auroral Imaging Access) provides access to summary data from satellite and ground-based instruments. VSO (Virtual Solar Observatory) uses a unified interface to deliver image solar data files from many observatories at different locations. VSPO (Virtual Space Physics Observatory) provides access to space and solar physics data, models, plots, indices and images. VSTO (Virtual Solar-Terrestrial Observatory) is a data framework for VOs serving solar, solar-terrestrial and space physics. EGSO (European Grid of Solar Observations) as a grid-based data and service access system uses a data model that includes space physics terms in addition to a detailed solar physics vocabulary. VHO (Virtual Heliospheric Observatory) unites distributed repositories for data from heliospheric missions in robotic space exploration. VMO (Virtual Magnetospheric Observatory) is used for query-based discovery and access of data from magnetospheric missions including single instrument data services and large, multi-spacecraft data archives. ViRBO (Virtual Radiation Belt Observatory) provides tools for satellite engineers and operators for analysis and visualization of near-real-time measurements and predictions of empirical models. VITMO (Virtual Ionospheric, Thermospheric, Mesospheric Observatory) is based on a different sources including ground and space-based instruments as well as from modelling and data assimilation. The Virtual Observatories approach to the space and solar physics data environment should use Grid and Web-service technologies to provide scientists with tools that help them to understand how the data are collected, what the data describe; to locate, retrieve and analyze data online from heterogeneous distributed scientific data sources. 3. Lyulin-5 experiment. The ionising radiation has been recognized as a main health concern to space crew, and investigation of the radiation influence on space vehicles and their crew has been conducted since the early times of human spaceflight [5, 6 ]. The Bulgarian scientists together with a number of international partners for more than 20 years have conducted research of the ionizing radiation Compt. rend. Acad. bulg. Sci., 66, No 1, 2013
85
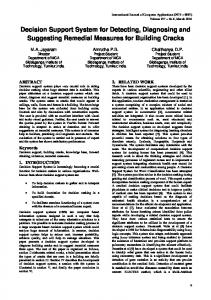
distribution from low Earth orbits to the Moon orbit [7–9 ]. Huge data sets are obtained from those investigations. For the estimation of the organ doses from the radiation field in the ISS, and thus the radiation risk to humans, measurements in models of human body-tissue-equivalent phantoms are essential. The Lyulin-5 charged particle telescope has observed the radiation characteristics in the spherical tissue-equivalent phantom of MATROSHKA-R international project on ISS since 2007 [10–12 ]. The MATROSHKA-R project aims to provide depth dose distribution inside the phantom in order to get more information on the distribution of a dose in the human body in space flight [13 ]. The objectives of Lyulin-5 experiment are studying the dose distribution along the phantom’s radius and variations of the radiation characteristics in the phantom with time and orbital parameters (such as solar cycle, solar flare events, attitude and altitude). The particle telescope Lyulin-5 measures time-resolved linear energy transfer spectrum, flux and absorbed dose rates for electrons, protons and the biologically-relevant heavy ion components of the cosmic radiation at three depths along the phantom’s radius. Large amounts of data for particle flux and dose rates at different depths in the phantom as functions of time, measurement mode and ISS orbital parameters (geographic and geomagnetic coordinates, node, etc.) are obtained. Obtained are also data for deposited energy spectra and linear energy transfer spectra as a function of the time and measurement mode. Modern tools to share, organize, analyze, visualize and understand the data are needed. 4. The Data Intensive Support System. Our architectural concept (Fig. 1) [14 ] is based on SOA and provides functionalities to scientists, who access the system over the Web. The architecture model of SOA includes four layers: • Data sources include the available applications that provide the operations. The execution of operations brings to data reading, writing and updating. Normally data are stored in databases. • Application service layer provides the access to available applications and so realizes the service integrity. • Business service layer represents services that provide the functionality of the organization. Business services provide the interface service abstraction and integration of the application service layer. • Business process layer contains a sequence of operations that are executed under business rules. New scientific experiments create large amounts of data in different formats. Two of the most popular formats are HDF5 [15 ] and NetCDF [16 ]. The Hierarchical Data Format (HDF) [15 ] standardizes the formats and description of many types of data sets as raster images and multidimensional arrays. HDF5 supports all types of data stored digitally – remote sensing data collected by satellites, nuclear testing models and high-resolution MRI brain scans. The Network Common Data Format (NetCDF) [16 ] is a data format for arrayoriented scientific data. It is widely used in earth, ocean and atmospheric science. 86
M. Goranova, J. Semkova, B. Shishedjiev et al.
Fig. 1. System architecture
NetCDF represents data as a set of multi-dimensional arrays, with sharable dimensions and additional metadata. The experimental data received from experiments on space radiation have to be described. We have developed a definition of language [17 ] that integrates both the structure and semantics of data without using a separate ontological language for semantic description (Fig. 2). The proposed language is used for description of experimental data from various sources, in particular from space radiation and spectral measurements made in scientific institutions of the BAS. The specific grammar consists of three sections: general section containing metadata about the origin and the ownership of the dataset, semantics containing the semantic description of the data and layout explaining the way the data is written in the dataset. The semantics section is represented as a table that can be viewed as a relation in the terms of relational database and contains values of independent and dependent quantities. The time and the space are most popular independent quantities in scientific data. The model can describe multidimensional data such as a vector or a tensor field. All other types of independent quantities are described as the element other. The dependent element is presented as field-value element that holds additional information about the dependency making the normalization possible. The semantics elements contain a reference to the corresponding layout elements. The element data parameters contains the parameters concerning the whole dataset. Compt. rend. Acad. bulg. Sci., 66, No 1, 2013
87
Fig. 2. XML Schema data description
The attributes of the layout element as coding, byte order, byte size, mantissa and exponent give the general properties of the data description. The layout section contains defined types and clusters. The dataset can be located in more than one files, each file is described by one cluster element with two main containers – structure and array. The cluster element describes the structure of the remote file from the dataset. The user can define own types. Type definition elements are defined as types in programming languages with additional separators between elements. They are used in the description of the file structure. The semantics and the layout present the same data from two different perspectives in the model. The layout reference and the semantic reference elements establish the mapping between objects in the semantic description and the layout description. Figure 3 shows the data flow diagram. The owner or author of a scientific dataset describes the format and the sense of the data by a wizard application. This description is done in XML using the Advisor service and conforms to the proposed specific grammar. A record containing the metadata is written in a database developed for this purpose while the large quantities of raw data are stored on files servers. Web access (SciData Wizard) to the system is realized using different Web forms that help the scientists to describe the data easily and intuitively. The forms follow the rules of the developed XML-based language: General, Semantics Data Parameter, Independent, Dependent, Layout, and Binding References. 88
M. Goranova, J. Semkova, B. Shishedjiev et al.
Fig. 3. Data flow diagram
Each form has compulsory and optional fields where the help information is added. The General form contains information about the source, version, ownership and contact data. The semantic content includes three forms that have the same look and feel – node tree presenter for better orientation in the dynamic generated structure and descriptive views representing the content of separate parts. The Layout form contains defined types and clusters. The Reference form adds layout reference and semantic reference. After filling the forms, the sections of the XML description file are automatically generated. The Download form allows the user to download and save the target XML file. The generated XML file is transmitted to the converter compiler [18 ] that automatically converts the XML description file into a canonical format. As the semantics describe the dependency among variables whose values are represented in the dataset, it is the basis of the canonical data structure. The compiler uses the semantics and the layout descriptions and transforms a scheme from the XML model to a form that looks like a relational data model. The canonical format consists of tables where each table has a header and rows. The data are grouped into logical blocks (tables) realizing the principles of the relational data model. Table 1 shows the canonical format for the space radiation data that consists of one table with columns representing measured quantities. Each row represents a unique record of a quantity with multiple enumerated values in the data set. By extracting the semantics and representing them in a canonical form, we simplify the mapping from raw data to a form suitable to make queries. Thus the data can be processed later by a set of services (Visualizer) that can calculate new quantities, filter them, merge or split the datasets with identical semantics and visualize them. Compt. rend. Acad. bulg. Sci., 66, No 1, 2013
89
90
M. Goranova, J. Semkova, B. Shishedjiev et al.
08
16
... 45756
...
.27690 ...
.07897 .08213 ... .06318
.09750 .10530 ... .05850
2
2
F3
ascend
...
2
F2
Field value flux
09
...
44387 337.00
...
336.92
336.80
.37
...
8.50
3.84
D1
D2
Field value dose
Dependent
...
...
...
1.0175 .2846 23.49
D3
E1
E2
E3
Field value energy
.27300
.25740
.60706
...
.85217
.96520
.79720
...
.94226
.97822
.84872
...
1.00257
.96278
112.8
...
141.0
131.3
73.7
...
88.8
76.3
60.3
...
61.4
57.2
11.07
...
−2.18
−8.43
365.2
...
384.2
310.3
13.64
...
.00
.00
MLT Ld Hmin Invlat [h] [degree] [km] [degree]
1.0359 .2766 23.19
B [G]
−69.12 1.1721 .2485 11.80
...
19.52
16.17
Other LatiLongiL tude tude [Earth [degree] [degree] radii]
T a b l e 1, b Dependent quantities
2
...
2
2
Mode [1/2]
Altitude [km]
Independent
[#/cm .s] [#/cm .s] [#/cm .s] [µGy/h] [µGy/h] [µGy/h] [MeV] [MeV] [MeV]
27
...
F1
04
2008
...
09
ascend
...
30
44387
...
22
39
ascend
12
28
01
2008
22
01
2008
12
Node
yyyy mm dd Hour Minutes Seconds Orbit N
Time
T a b l e 1, a Independent quantities
5. Discussion. This collaborative work describes the application of the new e-Science paradigm that can help the space missions of the future [19 ]. The contributions of the proposed SOA-based system to the similar cyberinfrastructures include: automatical description of the raw data with minimum human intervention, using the developed XML-based language that describes structurally and semantically the scientific data; automatical conversion of the raw data description into canonical format based on data semantics, which provides a link between the raw data representation and database schemata. The strength of the system lies in the compliance with the needs of scientists, allowing them to publish their data, obtain the needed data, analyse and visualize data to identify the most important features with massive data collections, access scientific heterogeneous databases and query systems over the Internet. The measured raw data with Lyulin-5 particle telescope used in MATROSHKA-R experiment are described and transformed in a canonical form. Our system supports data intensive tools via Web Services. The following research topic involves the development of efficiently indexing and retrieving XML data in XML database. Database search engine will allow for effective techniques to combine data from many sources and view data in several ways (by time, by space, by other attributes) [20 ]. It will be integrated with visualization tools to deliver new insights to scientists in a variety of cosmic domains. 6. Conclusion. We explore an approach to describe and generate automatically canonical description of scientific data. Based on this approach, the complete e-Science chain is established, focusing on new methodology and reusable components. This data intensive approach describes computer science challenges of managing scientific data using SOA as a key to federating diverse data sources. Acknowledgements. The authors wish to thank all colleagues involved in Lyulin-5 experiment performed at the ISS.
REFERENCES [1 ] Segaller S. Nerds: A Brief History of the Internet, New York: TV Books, 1998. [2 ] Gray J. Talk at NRC-CSTB meeting, Mountain View CA, http://research.microsoft.com/en-us/um/people/gray/JimGrayTalks.htm, Accessed June, 2012. [3 ] http://lwsde.gsfc.nasa.gov/VO Framework 7 Jan 05.pdf, Accessed June, 2012. [4 ] Harvey C., M. Gangloff, T. King, C. Perry, D. Roberts, J. Thieman. Earth Sci. Inform., 2008, No 1, 5–13. [5 ] Shaefer H. J. Adv. in Space Science, 1, 1959, 267–339. [6 ] Velinov P. United Nations Conference on the Exploration and Peaceful Uses of Outer Space, A/CONF.34/IV.B.4, 1968. [7 ] Dachev Ts. P., Y. N. Matviichuk, Y. V. Semkova, R. T. Koleva, B. Boichev, P. Baynov, N. A. Kanchev, P. Lakov, Ya. J. Ivanov, P. T. ToCompt. rend. Acad. bulg. Sci., 66, No 1, 2013
91
[8 ] [9 ] [10 ] [11 ] [12 ] [13 ]
[14 ] [15 ] [16 ] [17 ] [18 ] [19 ] [20 ]
mov, V. M. Petrov, V. I. Redko, V. I. Kojarinov, R. Tykva. Adv. Space Res., 9, 1989, No 10, 247–251. Semkova J. Compt. rend. Acad. bulg. Sci., 60, 2007, No 9, 957–966. Dachev Ts. P., B. T. Tomov, Yu. N. Matviichuk, Pl. G. Dimitrov, S. V. Vadawale, J. N. Goswami, V. Girish, G. de Angelis. Adv. Space Res., 48, 2011, No 5, 779–791. Semkova J., R. Koleva, S. Maltchev, V. Benghin, V. Shurshakov, I. Chernykh, N. Bankov. Compt. rend. Acad. bulg. Sci., 61, 2008, No 6, 787–794. Semkova J., R. Koleva. Compt. rend. Acad. bulg. Sci., 63, 2010, No 10, 1533– 1542. Semkova J., R. Koleva, St. Maltchev, N. Bankov, V. Benghin, I. Chernykh, V. Shurshakov, V. Petrov, S. Drobyshev, I. Nikolaev. Adv. Space Res., 49, 2012, No 3, 471–478. Shurshakov V. A., Yu. A. Akatov, I.S. Kartsev, V. M. Petrov, R. V. Tolochek, V. I. Petrov, B. V. Polenov, V. I. Lyagushin. In: Proceedings of International Conference “Fundamental Space Research”, Sunny Beach, Bulgaria, September 21–28, 2008, 234–238. Goranova M., B. Shishedjiev, J. Georgieva, V. Todorova. Proceedings of the Seventh International Conference on Challenges in Higher Education and Research in the 21st Century, 7, 2009, 309–312. HDF5 User’s Guide, http://www.hdfgroup.org/HDF5/doc/UG/, Accessed June, 2012. NetCDF User’s Guide, http://www.unidata.ucar.edu/software/netcdf/docs/ netcdf.html, Accessed June, 2012. Shishedjiev. B., M. Goranova, J. Georgieva. Proceedings of the Fifth International Conference on Internet and Web Applications and Services (ICIW), 2010, 345–350. Goranova M., B. Shishedjiev, J. Georgieva, V. Achev. Proceeding of the International Conference on Computer as a Tool (EUROCON), 2011, 1–4. Borne K. 2nd IEEE International Conference on Space Mission Challenges for Information Technology (SMC-IT’06), 2006. Gray G., D. Liu, M. Nieto-Santisteban, A. Szalay, G. Herber, D. DeWitt. http://research.microsoft.com/apps/pubs/default.aspx?id=64537, Accessed June, 2012. ∗
Technical University of Sofia 8, St. Kl. Ohridski Blvd 1000 Sofia, Bulgaria e-mail:
[email protected]
92
Space Research and Technologies Institute Bulgarian Academy of Sciences Acad. G. Bonchev Str., Bl. 1 1113 Sofia, Bulgaria e-mail:
[email protected]
M. Goranova, J. Semkova, B. Shishedjiev et al.