Atmospheric Chemistry and Physics Discussions
Published by Copernicus Publications on behalf of the European Geosciences Union.
|
15379
Discussion Paper
Correspondence to: G. McFiggans (
[email protected])
|
Received: 21 May 2010 – Accepted: 9 June 2010 – Published: 22 June 2010
Discussion Paper
Centre for Atmospheric Sciences, School of Earth, Atmospheric & Environmental Sciences, University of Manchester, Manchester, M13 9PL, UK
ACPD 10, 15379–15415, 2010
SOA component partitioning sensitivity – Part 1 G. McFiggans et al.
Title Page Abstract
Introduction
Conclusions
References
Tables
Figures
J
I
J
I
Back
Close
|
G. McFiggans, D. O. Topping, and M. H. Barley
Discussion Paper
The sensitivity of secondary organic aerosol component partitioning to the predictions of component properties – Part 1: A systematic evaluation of some available estimation techniques
|
This discussion paper is/has been under review for the journal Atmospheric Chemistry and Physics (ACP). Please refer to the corresponding final paper in ACP if available.
Discussion Paper
Atmos. Chem. Phys. Discuss., 10, 15379–15415, 2010 www.atmos-chem-phys-discuss.net/10/15379/2010/ doi:10.5194/acpd-10-15379-2010 © Author(s) 2010. CC Attribution 3.0 License.
Full Screen / Esc
Printer-friendly Version Interactive Discussion
5
Discussion Paper
1 Introduction
|
Aerosol particles remain highly uncertain contributors to climate change, influencing climate directly by the scattering and absorption of solar radiation and indirectly through their role as cloud condensation nuclei; the latter effect contributing the greatest remaining uncertainty in the atmosphere radiative forcing (IPCC, 2007). Both inorganic and organic material can transfer between the gas and particle phase. Whilst inorganic material is restricted to a relatively few relatively well-understood compounds,
Discussion Paper
15380
|
25
ACPD 10, 15379–15415, 2010
SOA component partitioning sensitivity – Part 1 G. McFiggans et al.
Title Page Abstract
Introduction
Conclusions
References
Tables
Figures
J
I
J
I
Back
Close
|
20
Discussion Paper
15
|
10
A large number of calculations of the absorptive partitioning of organic compounds have been made using a number of methods to predict the component vapour pressures, p0 , and activity coefficients, γi , required in the calculations. The sensitivities of the predictions in terms of the condensed component masses, volatility, O:C ratio, 0 molar mass and functionality distributions to the choice of p and γi models and to the number of components to represent the organic mixture have been systematically compared. The condensed component mass was found to be highly sensitive to the vapour pressure model, and less sensitive to both the activity coefficient model and the number of components used to represent the mixture although the sensitivity to the change in property estimation method increased substantially with increased simplification in the treatment of the organic mixture. This was a general finding and was also clearly evident in terms of the predicted component functionality, O:C ratio, molar mass and volatility distributions of the condensed organic components. Within the limitations of the study, this clearly demonstrates the requirement for more accurate representation of the p0 and γi of the semi-volatile organic proxy components used in simplified models as the degree of simplification increases. This presents an interesting paradox, since such reduction in complexity necessarily leads to divergence from the complex behaviour of real multicomponent atmospheric aerosol.
Discussion Paper
Abstract
Full Screen / Esc
Printer-friendly Version Interactive Discussion
15381
|
Discussion Paper | Discussion Paper
25
ACPD 10, 15379–15415, 2010
SOA component partitioning sensitivity – Part 1 G. McFiggans et al.
Title Page Abstract
Introduction
Conclusions
References
Tables
Figures
J
I
J
I
Back
Close
|
20
Discussion Paper
15
|
10
Discussion Paper
5
the organic fraction can comprise many thousands of, as yet largely unidentified, compounds with a vast range of properties (e.g. Zhang et al., 2007; Hallquist et al., 2009, and references therein). There have been tens to hundreds of thousands of organic components isolated in the atmosphere (Goldstein and Galbally, 2007; Lewis et al., 2000; Hamilton et al., 2008; Hallquist et al., 2009) and near explicit (Bloss et al., 2005a,b) and explicit (Aumont et al., 2005) models of oxidative degradation of gaseous VOCs predict the existence of many thousands to tens of millions of components. Conversely, aerosol schemes in large-scale models necessarily ignore the vast complexity of the organic mixture and will continue to do so in the future. This is a result of prohibitive computational expense that can only be reduced via a reduction in complexity (numerical, chemical or both). In order to better quantify the impacts of aerosol processes on climate and air quality it is necessary to improve the quantitative prediction of gas/aerosol partitioning and aerosol water content. The latter is necessary for predicting the direct and indirect climatic effect; the former determines the evolving chemical composition of the aerosol and is necessary for predicting aerosol loading and composition. Field measurements demonstrate that theoretical estimates of secondary organic aerosol (SOA) masses may be 1 to 2 orders of magnitude too low (Heald et al., 2005). Many factors influence the SOA yield, including the mass of organic aerosol that can serve as a condensing medium (Pankow, 1994; Odum et al., 1996), acid catalysed and other chemical reactions in the particulate phase (Jang and Kamens, 2001; Iinuma et al., 2004; Kalberer et al., 2004), ambient humidity (Seinfeld et al., 2001; Jonsson et al., 2006) and temperature (Stanier et al., 2007; Johnson and Marston, 2008). Whilst by no means the only consideration, it has long been considered that a primary driver for the transfer of organic material between the gas and condensed particulate phase is the vapour pressure of each of the partitioning components above the particulate composition. This is dependent on the vapour pressure of 0 each compound in its pure state (pi ) (vapour pressure of component i above pure liquid; or sub-cooled liquid; i ), multiplied by the component activity (ai =γi xi , the product of its activity coefficient and mole fraction) or “effective” concentration in the complex
Full Screen / Esc
Printer-friendly Version Interactive Discussion
15382
|
Discussion Paper | Discussion Paper
25
ACPD 10, 15379–15415, 2010
SOA component partitioning sensitivity – Part 1 G. McFiggans et al.
Title Page Abstract
Introduction
Conclusions
References
Tables
Figures
J
I
J
I
Back
Close
|
20
Discussion Paper
15
|
10
Discussion Paper
5
mixture of components using an appropriate reference state. This is implicitly embodied in the widely used equilibrium absorptive partitioning theory (Pankow, 1994; Odum et al., 1996; Pankow et al., 2001). This study uses absorptive partitioning to describe the gas/particle partitioning in a complex multicomponent system, accounting for component interactions in the condensed phase (deviations from Raoult’s law) and the volatility of the pure components. The amount of condensed material is calculated by summing all components, ensuring mass balance between the two phases for each component. Calculation of the parti0 tioning requires a vapour pressure value, pi , for all condensing compounds i , and the non-ideal deviations from Raoult’s law embodied in their γi values. Barley and McFiggans (2010) recently presented a comparison of boiling point and vapour pressure prediction techniques that have been used to model atmospheric aerosol loadings. Using the widest available range of low volatility multifunctional organic benchmark compounds of measured vapour pressures to assess the technique skill, they provided a critical evaluation of the methods and recommendations for appropriate technique choice for atmospheric applications. The range of vapour pressure deviations from the experimentally-determined values was shown to be many orders of magnitude, with the greatest discrepancies resulting from the choice of boiling point predictive method. The sensitivity of absorptive partitioning particulate mass calculations to the errors in the techniques was investigated for the experimental test compounds. It was found that the different predictive methods for boiling points introduced such variability that either negligible or very significant condensed organic mass was predicted. Whilst the compounds investigated by Barley and McFiggans (2010) were selected for their multifunctionality and very low experimental vapour pressures, they were still ∼100 to 1000 times more volatile than compounds expected to condense significantly under typical ambient conditions. It is important to establish whether such boiling point (and hence vapour pressure) sensitivity of condensed mass is exhibited in simulations of complex mixtures of partitioning compounds with more atmospherically representative properties.
Full Screen / Esc
Printer-friendly Version Interactive Discussion
15383
|
Discussion Paper | Discussion Paper
25
ACPD 10, 15379–15415, 2010
SOA component partitioning sensitivity – Part 1 G. McFiggans et al.
Title Page Abstract
Introduction
Conclusions
References
Tables
Figures
J
I
J
I
Back
Close
|
20
Discussion Paper
15
|
10
Discussion Paper
5
Raatikainen and Laaksonen (2005) presented a discussion of activity coefficient models that have been used to account for multicomponent aerosol non-ideality. Group contribution methods include the widely used UNIFAC model and its variants (Fredenslund et al., 1975; Yan et al., 1999). Much effort has been directed towards improvement in the accuracy of these models for atmospherically significant functionalities and temperatures through parameter re-evaluation (Peng et al., 2001; Marcolli and Peter, 2005; Zuend et al., 2008). Although inclusion of inorganic ions within such frameworks is not straightforward, there are a number of models that aim to account ¨ for organic-inorganic molecular interactions via extended Debye-Huckel methods and mid-range interaction terms (e.g. Marcolli and Peter, 2005; Zuend et al., 2008; Clegg et al., 2008; Yan et al., 1999). Outstanding considerations associated with such models include the requirement for complex reference state corrections, which can limit applicability in mixed phase systems. Recently developed models such as AIOMFAC, for example, have been designed to obviate this requirement and can be used to predict phase separation for limited sets of organic functionality (e.g. Zuend et al., 2008). Whilst each vapour pressure and activity coefficient model may carry its own advantages and disadvantages, a systematic evaluation of the techniques for atmospheric purposes is complex. This restricts the objective selection of a simplified representation of organic components that will make a dominant contribution to particulate mass or properties. Models of atmospheric oxidative degradation of volatile organic compounds (VOCs) range extensively in complexity of representation of the organic components depending on the scale of their application. In order to better assess the skill of such models in capturing the production of important SOA precursors it is necessary to systematically evaluate the ability of the varying complexity to reproduce the determinant properties of the most complex representation. Furthermore, to assess the ability of absorptive partitioning to capture the important characteristics of atmospheric SOA behaviour, a broader set of metrics than simple prediction of the condensed mass is required.
Full Screen / Esc
Printer-friendly Version Interactive Discussion
15384
|
Discussion Paper | Discussion Paper
25
ACPD 10, 15379–15415, 2010
SOA component partitioning sensitivity – Part 1 G. McFiggans et al.
Title Page Abstract
Introduction
Conclusions
References
Tables
Figures
J
I
J
I
Back
Close
|
20
Discussion Paper
15
|
10
Discussion Paper
5
Equilibrium absorptive partitioning itself has certain limitations. There is good reason to assume that instantaneous equilibrium will not pertain within an atmospheric aerosol. Uptake of gaseous components to a particle population is a kinetic process, driven by a gradient between the background gaseous concentration and that at the surface of each particle. The number of collisions of potentially condensing molecules with the particle surfaces depends on the size distribution of the particles and their probability of being accommodated into each particle. Under tropospheric conditions, the resultant mass transfer is normally in the so-called transition regime between free molecular and continuum mass transfer as may be calculated by flux-matching descriptions (e.g. Fuchs and Sutugin, 1971) or more approximate formulations (e.g. Schwartz, 1986). Mass transfer rates of gases to reasonable ambient populations in a range of environments may result in gaseous e-folding lifetimes of several tens of minutes to days (e.g. Bloss et al., 2005c; Haggerstone et al., 2005; Coe et al., 2006; Sommariva et al., 2006; Emmerson et al., 2007; Williams et al., 2007; Allan et al., 2009) depending on uptake probability, indicating that disequilibrium may pertain over such timescales simply as a result of gaseous mass transfer limitations. Furthermore, heterogeneous and condensed phase reaction can further perturb the equilibrium leading to supersaturation of a component in either the gas or aerosol. Notwithstanding the implications of such dynamic processes and dependence on condensed phase kinetics, a basis for the determination of the equilibrium contributions to the particulate composition is required to calculate the equilibrium loading to form the basis for investigation of such dynamic deviation from equilibrium. The aim of this paper is to investigate the sensitivity of SOA predictions to calculated 0 properties (γi ,pi ) and the complexity of the representation of the organic aerosol fraction. A flexible framework for the evaluation is constructed, the techniques to be evaluated are briefly described and the evaluation metrics defined. The results are evaluated in terms of these metrics and recommendations for a methodology for VOC degradation mechanism reduction for SOA prediction are made. Two companion manuscripts examine i) the sensitivity of properties of particulate material produced by absorptive
Full Screen / Esc
Printer-friendly Version Interactive Discussion
2 Methodology
2.1 Formulation of the partitioning model
|
The molar based partitioning model used here is identical to that presented in Barley et al. (2009) and yields identical results to the conventional mass based model of Pankow (1994) whilst allowing use of mole fraction based activity coefficients with a conventional reference state unlike the model variant presented by Donahue et al. 3 −1 (2006). The partitioning constant Kp,i , in units of m µmol is given by Eq. (1):
Discussion Paper
15
Cicond COA
vap
where Ci Cicond
RT f 106 γi p0i
(1)
is the vapour phase molar concentration of component i, µmol m−3 , −3
|
is the condensed phase molar concentration of component i, µmol m , COA is the total molar concentration of condensed organic material, µmol m−3 , p0i is the saturated vapour pressure of component i, atm, R is the ideal gas 15385
Discussion Paper
vap
Ci
=
|
Kp,i =
20
Discussion Paper
10
A large number of calculations of the absorptive partitioning of organic compounds were performed using a number of methods to predict the required pure component 0 vapour pressures (p ) and activities (xi γi ). The sensitivities of the predictions in terms of the condensed component masses, volatility distributions, O:C ratio, molecular weight and functionality to the choice of p0 and γi models, to the number of components to represent the organic mixture and to ambient environmental T and RH were systematically evaluated.
|
5
Discussion Paper
partitioning (Topping et al., 2010) and ii) the selection of a reduced number of surrogate condensing compounds from a complex VOC oxidative degradation model (Barley et al., 2010).
ACPD 10, 15379–15415, 2010
SOA component partitioning sensitivity – Part 1 G. McFiggans et al.
Title Page Abstract
Introduction
Conclusions
References
Tables
Figures
J
I
J
I
Back
Close
Full Screen / Esc
Printer-friendly Version Interactive Discussion
5
−1
−1
cond
−3
is the total loading of component i, µmol m . where Ci = Ci + Ci The formulation is slightly more numerically efficient than that presented by Pankow (1994) and Pankow et al. (2001) in that the mass is only evaluated once at the end of the partitioning calculation rather than evaluating the number averaged molar mass of the condensed material within each iteration of the solver. Such efficiency savings would not normally be important, but the many tens of thousands of partitioning calculations for complex mixtures made in the current study require such minor optimisations.
Discussion Paper
vap
15
| |
The impacts of a limited number of combinations of property prediction techniques were conducted to establish a representative range of sensitivities using methods that have been reasonably widely employed in an atmospheric context. The techniques 0 for estimating boiling point (Tb ) and vapour pressures (p ) have been described in detail and assessed in Barley and McFiggans (2010). In the present work Tb values 15386
Discussion Paper
2.2 Vapour pressure and activity coefficient models
20
ACPD 10, 15379–15415, 2010
SOA component partitioning sensitivity – Part 1 G. McFiggans et al.
Title Page Abstract
Introduction
Conclusions
References
Tables
Figures
J
I
J
I
Back
Close
|
i
Discussion Paper
where the total molar concentration of condensed organic material, COA , is given by the sum of the products of the individual total component concentrations in both phases and their partitioning coefficient: X COA = (3) Ci ξi
|
10
3
Discussion Paper
−5
constant=8.2057×10 m atm mol K , T is the temperature, K, f is the fraction of the condensed material that may be considered absorptive, usually considered unity for most absorptive partitioning calculations and γi is the activity coefficient for component i in the liquid phase. Defining a partitioning coefficient ξi for compound i given its Kp,i value: !−1 1 ξi = 1 + (2) Kp,i COA
Full Screen / Esc
Printer-friendly Version Interactive Discussion
15387
|
Discussion Paper | Discussion Paper
25
ACPD 10, 15379–15415, 2010
SOA component partitioning sensitivity – Part 1 G. McFiggans et al.
Title Page Abstract
Introduction
Conclusions
References
Tables
Figures
J
I
J
I
Back
Close
|
20
Discussion Paper
15
|
10
Discussion Paper
5
were estimated by the methods of Nannoolal et al. (2004), Stein and Brown (1994) and Joback et al. (1987). These methods will henceforth be referred to as the N, SB and JR methods, respectively. The N method is the most complex group contribution method of the three and gave the best results when tested against experimental vapour pressure data for 45 multifunctional compounds. This method uses both primary and secondary groups and also accounts for interactions between key functional groups. The primary groups cover all the atoms in the molecule (as do the group contributions of the other estimation methods) while the secondary groups and the group interactions provide (usually relatively small) corrections for particular structural features and functional group combinations. The SB method is much simpler, while the JR method (which is more basic still and without an essential correction used in the SB method) consistently overestimates the Tb values of compounds with predicted Tb >500 K. The 0 p methods used in this work were that of Nannoolal et al. (2008) and – henceforth referred to as the N/VP and MY methods. The N/VP method uses the same complex group contribution structure as the Tb estimation method but gives similar results to a greatly simplified version, possibly because of the swamping effect of errors in Tb . However Barley and McFiggans (2010) did show that the MY method significantly underestimated the slope of the vapour pressure line. For the base case simulations the N-N/VP method was combined with the assumption of ideality. For the 5 cases exploring the sensitivity to predicted component volatility, combinations of the vapour pressure methods (MY and N/VP) with the boiling point methods (N, SB and JR) were used with the assumption of ideality (JR-N/VP, SB-N/VP, JR-MY, SB-MY and N-MY). To analyse the impact of non-ideality, the base case combination (N-N/VP) was used with the UNIFAC model with updated parameters of Peng et al. (2001) to calculate activity coefficients of all components. This combination is hereafter referred to as N-N/VP-non-ideal. The updated parameters, used in previous atmospheric studies (Topping et al., 2005; Compernolle et al., 2009; Tong et al., 2008), have been shown to substantially improve predictions in systems which include the OH−COOH subgroups. Other studies have focussed on improving interaction parameters for additional groups
Full Screen / Esc
Printer-friendly Version Interactive Discussion
5
|
15388
Discussion Paper
ii) The total “target” condensed organic mass loading is fixed for all partitioning calculations using the base choice of ideality with the N-N vapour pressure prediction to 10 µg m−3 . The total mixing ratio is therefore adjusted iteratively to achieve this
|
25
(4)
Discussion Paper
r = 1776 − 161.454440909 · (n − 1)
ACPD 10, 15379–15415, 2010
SOA component partitioning sensitivity – Part 1 G. McFiggans et al.
Title Page Abstract
Introduction
Conclusions
References
Tables
Figures
J
I
J
I
Back
Close
|
20
Discussion Paper
15
To investigate the range of model performance across as broad a composition space as possible, a methodology for the semi-random generation of the distribution of functionality and component molar mass inputs has been constructed. A completely unconstrained random selection of functionality will not a priori produce distributions of gaseous and condensed components with properties representative of those in the atmosphere and any sensitivities found may be skewed by such misrepresentation of the components. A fully-randomised initialisation of the simulations has therefore not been used. The following restrictions have been imposed to provide a large but finite number of simulations and a statistically significant distribution of results within a range of conditions representative of, or similar to, atmospheric conditions: i) Straight-chain aliphatic compounds from methane to C12 compounds are considered in this study and therefore the organic compound carbon number solely determines the chain-length. The total abundance of the compounds in each simulation is constrained such that the molar mixing ratio (r) of a compound decreases with increasing carbon number. The base case uses a methane mixing ratio of 1776 −1 −1 nmol mol (ppb) and a prescribed mixing ratio for C12 compounds of ∼1 pmol mol (ppt) with a linear reduction in base 10 logarithmic space with carbon number such that the mixing ratio in nmol mol−1 of a compound of carbon number n is given by:
|
10
2.3 Framework for simulation initialisation
Discussion Paper
in addition to modifying the UNIFAC framework (e.g. Marcolli and Peter, 2005). There are few validation studies for such approaches, particularly for complex systems, and additional work is needed (Tong et al., 2008; Zuend et al., 2008) before they can be reliably applied.
Full Screen / Esc
Printer-friendly Version Interactive Discussion
15389
|
Discussion Paper | Discussion Paper
25
ACPD 10, 15379–15415, 2010
SOA component partitioning sensitivity – Part 1 G. McFiggans et al.
Title Page Abstract
Introduction
Conclusions
References
Tables
Figures
J
I
J
I
Back
Close
|
20
Discussion Paper
15
|
10
Discussion Paper
5
condensed mass whilst maintaining the gradient of the molar mixing ratio distribution line as described in Eq. (4). Using these two constraints, the following procedure is followed to attribute random functionality to any number of compounds. Probability distributions of all 29 functional groups represented within the modified-UNIFAC activity coefficient model (34 with CH2 groups – see Hansen et al., 1991) are randomly generated as a function of carbon number. Figure 1 illustrates a representative distribution for only 6 functional groups for clarity. 1000 sets of the 29 functionality distributions were generated with weighted preference given to oxygenated functional groups by multiplying the probability of occurrence of each oxygenated group by 100. This was used to increase the likelihood that such groups would populate a given carbon chain, whilst still allowing other functional groups to occur depending on the attributed functionality in each case. For each set of chosen functionality distributions a random selection of 2, 10, 100, 1000 and 10 000 carbon chain lengths was chosen. For each of these carbon backbones, a random number from zero to 4 (or the number of carbon atoms, whichever is the lesser) is selected. This number of functional groups was then allocated to the carbon backbone according to the probability distribution. To summarise, 1000 sets of each complexity of mixture of random functionality (with up to 4 functional groups per compound) were generated such that within each set, each of the mixture complexities (2, 10, 100, 1000 or 10 000 compounds) randomly represents the probability of the functionality defined for that set. It is important to note that it is not the intention to present a sensitivity of absorptive partitioning calculations of the exact mixtures of compounds found in the atmosphere; only to examine the behaviour of the model under similar conditions to those observed in the atmosphere. It should further be noted that the discussions and conclusions will be drawn from results of absorptive partitioning simulations of mixtures of straightchain aliphatic compounds with no branched chain, aromatic or cyclic compounds representative of biogenic compounds. For technical reasons, this is an enormously more complex undertaking and is the subject of ongoing work.
Full Screen / Esc
Printer-friendly Version Interactive Discussion
5
| Discussion Paper |
15390
Discussion Paper
25
ACPD 10, 15379–15415, 2010
SOA component partitioning sensitivity – Part 1 G. McFiggans et al.
Title Page Abstract
Introduction
Conclusions
References
Tables
Figures
J
I
J
I
Back
Close
|
20
Discussion Paper
15
|
10
As stated when describing the constraints on the component mixing ratio in Sect. 2.3 above, the target mass using the base model configuration was 10 µg m−3 . Ambient atmospheric condensed organic loadings can range from below 0.1 to greater than −3 100 µg m depending on environment and after Eq. (2), it can readily be seen that the partitioning of semi-volatile components depends on the total condensed mass, COA . The impacts of COA on the distribution of components of varying volatility between vapour and condensed phase has been widely investigated (see e.g. Donahue et al., 2006) and the target mass will affect the absolute values in the results to some degree. A lower condensed target mass will lead to an increased relative contribution of lower volatility components. Conversely, increased condensed mass will allow a greater contribution from more volatile components. Whilst such an effect will expose differences in the vapour pressure predictive techniques at different ranges of volatility, it is not expected to alter the overall picture of the relative sensitivities and should be the focus of further work. For each of the 1000 functionality sets at each complexity of representation of the mixture, partitioning calculations were carried out varying the absolute total component loading until the target mass was achieved. Each calculation was conducted at three temperatures (273, 298 and 313 K) spanning a reasonable tropospheric range and four relative humidities (0, 60, 80 and 90%). Simulations for each functionality distribution, using each complexity of representation under each set of conditions with the appropriately adjusted total abundance was then repeated for each combination of predictive techniques. Owing to the large number of simulations, all the techniques and model configurations were automated. Although the chosen conditions are relatively arbitrary (and the participation of water in absorptive partitioning is quite contentious, see discussion in Sect. 3.1 below), an exhaustive investigation is computationally prohibitive and the selected conditions adequately serve to illustrate the sensitivities. The investigation could further be extended almost infinitely to consider condensation onto pre-existing organic mixtures of primary origin (or otherwise
Discussion Paper
2.4 Calculation protocol
Full Screen / Esc
Printer-friendly Version Interactive Discussion
3.1 Predicted condensed organic mass
Discussion Paper
3 Results: model sensitivity to predicted properties and the complexity of the representation of the organic aerosol fraction
|
25
|
In general, across all sets of functionality, it was found that the predicted mass is less sensitive to the assumption of ideality than to the accuracy of the vapour pressure prediction. This is clearly illustrated in Fig. 2, which presents the sensitivity of total condensed mass for a single functionality distribution to all changes in the vapour pressure predictive technique (green box and whiskers) and the inclusion of non-ideality (red box and whiskers) compared with the base case for simulations across all conditions at each level of complexity. Note the logarithmic scale of the mass axis. The first 15391
Discussion Paper
20
ACPD 10, 15379–15415, 2010
SOA component partitioning sensitivity – Part 1 G. McFiggans et al.
Title Page Abstract
Introduction
Conclusions
References
Tables
Figures
J
I
J
I
Back
Close
|
15
Discussion Paper
10
Conventionally, the total condensed organic mass loading has been the most widely reported metric for model comparison, largely because it is the one most readily accessible to ambient measurement. Recently a much broader range of comparators has emerged from field and laboratory studies and it is a more challenging test of model skill for predictions to be compared with the broadest set of available metrics. The partitioning sensitivities have therefore been evaluated using: i) total mass loading and the distribution of ii) component mass loadings (for comparison with e.g. mass spectral parent ion fragment distribution), iii) component volatility distribution, iv) O:C ratio and molar mass and exemplarily illustrated using v) component functionality.
|
2.5 Evaluation metrics
Discussion Paper
5
of lower volatility and varied functionality, such as components formed from significant atmospheric condensed phase processing) or to consider the presence of inorganic components. We will necessarily limit the current investigation to the conditions stated here, noting that such extensions may serve to either increase or decrease the sensitivity to a hitherto unknown degree.
Full Screen / Esc
Printer-friendly Version Interactive Discussion
15392
|
Discussion Paper | Discussion Paper
25
ACPD 10, 15379–15415, 2010
SOA component partitioning sensitivity – Part 1 G. McFiggans et al.
Title Page Abstract
Introduction
Conclusions
References
Tables
Figures
J
I
J
I
Back
Close
|
20
Discussion Paper
15
|
10
Discussion Paper
5
box and whisker bar of each pair represents the variability in predicted mass from the simulations from all models at all non-zero RH values, whereas the right hand bar of each pair shows the range of variability from only the dry simulations. Under “wet” conditions, the median value of mass predicted from all methods using non-base vapour pressure variant models (number of models used = n = 45) is always greater than the base mass prediction, with a small minority of simulations producing less mass than those using the N-N/VP base model. Under dry conditions using the non-base vapour pressure models (n=15), with no absorptive mass provided by condensed water, the median value drops slightly below the base case mass with partitioning. The reason for the difference in behaviour is illustrated in Fig. 3 where the mass loading predicted using each of the vapour pressure estimation technique variants in the partitioning model is illustrated for the mixtures as in Fig. 2. The systematic overprediction in mass resulting from use of the JR Tb technique with its underprediction in volatility can be seen in the right hand panels where, for “wet” conditions (green bars) a greater overprediction in mass is shown than for dry conditions (blue points) as a result of the presence of liquid water as an absorbing mass (note that only three dry cases are available at each degree of simplification of a given functionality set for each model, therefore each point is plotted rather than attempting to plot statistical variability). The other techniques can be seen to predict substantially lower mass than the techniques using the JR Tb method and indeed, reduced mass on average when compared with the base case N-N/VP method. In all cases, absorptive partitioning shows comparable sensitivity in predicted mass to the varying methods under dry and “wet” conditions. Furthermore, the variation of the model leads to greater median mass underprediction if the mass is underpredicted with respect to the base case or lower mass overprediction for the JR-based techniques. Whilst Fig. 3 only illustrates the dependence assuming ideality, the red bars in Fig. 2 show that non-ideality, as captured by the UNIFAC model, leads in general to an underprediction of mass. Possibly surprisingly, under “wet” conditions, the median mass prediction is closer to that predicted by the base case than under dry conditions for
Full Screen / Esc
Printer-friendly Version Interactive Discussion
15393
|
Discussion Paper | Discussion Paper
25
ACPD 10, 15379–15415, 2010
SOA component partitioning sensitivity – Part 1 G. McFiggans et al.
Title Page Abstract
Introduction
Conclusions
References
Tables
Figures
J
I
J
I
Back
Close
|
20
Discussion Paper
15
|
10
Discussion Paper
5
all levels of complexity of mixture representation other than the simplest 2 component cases. This indicates on average that there is a lower degree of predicted non-ideality in cases where water is present. It should be noted that, whilst a strong predicted dependence of condensed mass on RH has been presented in Barley et al. (2009) and Hallquist et al. (2009) and RH dependence has been discussed in Seinfeld et al. (2001) and Pankow and Chang (2008), the degree to which condensed water acts as an effective absorptive mass is unclear. Both Figs. 2 and 3 also illustrate that the sensitivity tends to reduce on increasing complexity from the simplest representations of the partitioning compounds. Although both figures show only the results from one randomly generated functionality distribution, these are typical and both results were found to be the general case for over 1000 randomly generated organic only or organic/water mixtures as shown in Fig. 4. Figure 4 shows the distribution of the factor difference in condensed mass from that using the base case choice of vapour pressure method (N-N/VP) across all 1000 mixtures demonstrating that the condensed mass can vary by a factor of 104 for simple mixtures with two compounds using widely used vapour pressure predictive techniques. For the same mixture, the condensed mass can be almost three orders of magnitude lower when including activity coefficients. By this most coarse metric, the potential for very high uncertainty is highlighted when using both reduced and high complexity representations of organic aerosol composition, particularly related to the choice of vapour pressure predictive technique. The relatively low sensitivity to the inclusion of the particular activity coefficient model used here for high complexity mixtures is another general result, suggesting that non-ideality in very complex mixtures plays a more minor role, probably resulting from the very low mole fraction of each individual component. It must be restated that such considerations ignore phase separation or the presence of inorganic components, both of which may increase the impacts of non-ideality. This is briefly discussed in Sect. 4. To demonstrate the generality of the results, Fig. 4 shows the probability distribution functions of the sensitivity of the predicted total condensed organic mass across all
Full Screen / Esc
Printer-friendly Version Interactive Discussion
| Discussion Paper
25
Discussion Paper
20
|
Donahue et al. (2006) reformulated the absorptive partitioning model to define an ef∗ fective saturation concentration, Ci of each component, that would be identical to the inverse of Kp,i for each component were they all to be of the same molar mass. The Ci∗ value may then be used as a direct measure of the volatility, with lower Ci∗ components being more liable to be in the particulate material. Figure 5 shows an example of the distribution of the compounds binned by their volatility in a simulation of a 10 000 compound representation of a single functionality distribution predicted at T =298.15 K and RH=80% using each of the predictive methods. It can be seen that there is a very large, and somewhat predictable, sensitivity to the vapour pressure predictive technique em∗ ployed, with components moving between Ci bins leading to very different volatility distributions. By comparison, the predicted sensitivity of the volatility distribution to non-ideality is seen to be very much lower. Figures 6a and b show the sensitivity of 15394
ACPD 10, 15379–15415, 2010
SOA component partitioning sensitivity – Part 1 G. McFiggans et al.
Title Page Abstract
Introduction
Conclusions
References
Tables
Figures
J
I
J
I
Back
Close
|
3.2 Predicted volatility of the condensed material
Discussion Paper
15
|
10
Discussion Paper
5
conditions to the differences in vapour pressure predictive technique and the inclusion of non-ideality. This figure reinforces the typical results observed in Figs. 2 and 3 and described above and shows that the sensitivities can be both smaller and very much larger than the single example depending on the distribution of functionality of the compounds present. It can be seen that there is a slight overall bias towards overprediction of total mass when varying the vapour pressure predictive technique from the base method of both boiling point and vapour pressure estimation, N-N/VP. In contrast, the distribution of input component functionality is biased towards prediction of lower total mass by the inclusion of non-ideality using the UNIFAC method described in Sect. 2.2 above. The distribution of predictions has an increasingly broader spread with increasing simplicity of system representation – i.e. much greater under- or overprediction is possible when a low complexity representation of the organic components is used. Furthermore, the deviations tend towards a similar finite value with increased complexity, such that even with a very large number of components there is a significant sensitivity of the predicted mass to the techniques employed.
Full Screen / Esc
Printer-friendly Version Interactive Discussion
| Discussion Paper |
15395
Discussion Paper
25
ACPD 10, 15379–15415, 2010
SOA component partitioning sensitivity – Part 1 G. McFiggans et al.
Title Page Abstract
Introduction
Conclusions
References
Tables
Figures
J
I
J
I
Back
Close
|
20
Discussion Paper
15
|
10
Discussion Paper
5
the volatility distribution to changes in predictive technique across all 1000 functionality sets for the most simple (2 component) and most complex (10 000 component) representations of the functionality, respectively. The red bars show the range of volatility of the components in the base case. The height of the bar represents the percentage contribution to the total condensed SOA mass. Figure 6a shows that, when only two compounds are used to represent the functionality distribution, the base case volatility bins that they fall into will range widely depending on the initial functionality. When the vapour pressure estimation techniques are varied or non-ideality considered, the volatility distributions show a broad scatter such that no statistical pattern is observed. That is, the distribution of component volatility is so sensitive to the methods employed that they must be considered unreliable when representing the organic functionality by only two components. In contrast, when representing the same 1000 functionality initialisations by 10 000 components in each mixture, it can be seen from Fig. 6b that the base case volatility distribution (as represented by the red bars), may be considered broadly reasonable and comparable to the top left panel in Fig. 5. Therefore it can be seen that the sensitivity shown in Fig. 5 is representative of all the 1000 semi-random functionality distributions. The complex representation exhibits much lower sensitivity to the variation in estimation technique than the simple representation in that a statistical range can be described by the blue and green box and whiskers. However, the sensitivity is still very large. The volatility distribution shows that components frequently move in the decadal volatility bin distribution. The methods using the JR Tb technique (which lead to a systematically tendency to underpredict vapour pressure) does not appear to show systematic differences in deviation from the base volatility distribution to the simulations not using non-base case methods that do not employ the JR Tb technique.
Full Screen / Esc
Printer-friendly Version Interactive Discussion
5
| Discussion Paper |
15396
Discussion Paper
25
ACPD 10, 15379–15415, 2010
SOA component partitioning sensitivity – Part 1 G. McFiggans et al.
Title Page Abstract
Introduction
Conclusions
References
Tables
Figures
J
I
J
I
Back
Close
|
20
Discussion Paper
15
|
10
Frequently O:C ratio and molar mass are becoming more widely available from a variety of analytical techniques and it is found that the predicted mass discrepancy is not uniformly spread in terms of the molar mass, Mw , or oxygen to carbon (O:C) ratio. To establish the base case predicted distribution of components, Fig. 7 shows the normalised mass weighted frequency distribution of the component properties averaged across 2 and 1000 components respectively used to represent each of 1000 functionality distributions across all temperatures and RH using the base N-N/VP estimation method in the partitioning model. The average O:C ratios and Mw s are binned with a resolution of 0.05 in O:C and 50 in Mw . It can be seen that the average properties of the two component representations fall in two clusters, one with higher O:C ratio and lower molar mass than the second; whereas the average properties of the 1000 component representations form a continuous distribution across all 1000 simulations. The boxes and whiskers show the statistical distribution of these properties, with the median value falling at the central “hotspot” of the frequency contour in the high complexity panel b) and between the two hotspots in the two component panel a). In contrast to the averages across a high number of simulations, the panels in Fig. 8 show the results from a single example simulation of a 10 000 compound representation of a single functionality set. The scale is the logarithm of the mass loading in each bin with the same resolution as Fig. 7. Figure 8a shows that the distribution of these properties across all compounds using the base case method is broadly within a range representative of the entire average of all 1000 functionalities seen in Fig. 7b. Figure 8b shows the distribution of the properties using the JR-N/VP estimation method on the same scale. It is evident that the total predicted mass is increased (as has already been shown in Fig. 2). Figure 8c shows the logarithm of the differences in the mass distributions. Clearly the differences are not systematic and the discrepancies in the predicted loadings vary significantly as a function of both molar mass and O:C ratio. It
Discussion Paper
3.3 Predicted condensed component molecular weight and O:C ratio distribution
Full Screen / Esc
Printer-friendly Version Interactive Discussion
4 Discussion, conclusions and future work
15397
|
| Discussion Paper
25
Discussion Paper
20
ACPD 10, 15379–15415, 2010
SOA component partitioning sensitivity – Part 1 G. McFiggans et al.
Title Page Abstract
Introduction
Conclusions
References
Tables
Figures
J
I
J
I
Back
Close
|
15
Discussion Paper
10
The functionality of the condensed phase differs markedly depending on the predictive techniques employed in the partitioning model and this leads to the substantial differences in total mass, component and average volatility, O:C ratio and molar mass illustrated above. Figure 9 shows an example from one randomly generated set of input concentrations. The predictions of condensed organic components are extremely dependent on the employment of the appropriate vapour pressure and activity coefficient predictive technique. As may be expected, it can clearly be seen that the differences in the functionality of condensed organic components using the different predictive techniques is reflected in the variation in distribution of OC ratio, molar mass and volatility. Whilst absorptive partitioning will undoubtedly be incapable of explaining all features of secondary organic aerosol formation, it can be used to provide an indication of the equilibrium distribution of functionality that may be expected in the absence of heterogeneous or condensed phase reaction. Any comparison of such predictions with laboratory simulations in well-defined conditions or with atmospheric samples may allow the extent to which equilibrium absorptive partitioning determines organic functionality to be assessed. Whilst the impacts of the techniques for prediction of non-ideality are demonstrated to be lower than of vapour pressure, the sensitivities presented have hitherto ignored the presence of inorganic components. In real ambient mixed organic/inorganic aerosol, the situation will be further complicated and the role of non-ideality may be substantially larger. Figure 10 demonstrates the increase in the sensitivity of predicted condensed mass resulting from inclusion of inorganic components (in this case NaCl) for a single example functionality distribution by incorporation of the AIOMFAC model
|
5
Discussion Paper
is evident that the choice of estimation methods in absorptive partitioning predictions will substantially impact on the identification or selection of semi-volatile components and their properties in the organic fraction of particulate material.
Full Screen / Esc
Printer-friendly Version Interactive Discussion
15398
|
Discussion Paper | Discussion Paper
25
ACPD 10, 15379–15415, 2010
SOA component partitioning sensitivity – Part 1 G. McFiggans et al.
Title Page Abstract
Introduction
Conclusions
References
Tables
Figures
J
I
J
I
Back
Close
|
20
Discussion Paper
15
|
10
Discussion Paper
5
(Zuend et al., 2008) in the absorptive partitioning framework for the same range of conditions as in Fig. 2. It can be seen that the predicted mass sensitivity to non-ideality when including inorganic components assuming internal mixing is comparable in magnitude to consideration of organic component non-ideality only (equivalent to organic and inorganic components being externally-mixed). However, the absolute loadings may be substantially different (in this case, mostly greater when internally-mixed). Development and evaluation of mixed inorganic/organic models for atmospheric applications is incomplete and the further laboratory studies are required to cover the range of atmospherically-relevant functionality Tong et al. (2008). In such systems (indeed, even in systems with both polar and non-polar organic components or simply organic components plus water), it is likely that phase separation may occur (Erdakos et al., 2004). In a recent study, it has been shown that for a particular moist multicomponent system, up to 30% overestimation of mass can result from ignoring non-ideality and liquid-liquid phase separation (Zuend et al., 2010). This should be the subject of continued investigation. However, it must be noted that an aerosol is a dispersed system and phase separation naturally occurs by virtue of the numerous phase boundaries present, such that partitioning calculations of component mass are simply averages across all particles. Whilst the effect of non-ideality will be further complicated by phase separation, it should be remembered that the source profiles and histories of particle populations will very likely be a greater agent of segregation of components than the phase separation predicted by thermodynamic equilibrium (i.e. component mixing state generally follows source contribution). Development of thermodynamic models that include consideration of phase separation of atmospheric components will be most useful when used to refine predictions of component separation dynamically-induced in particle populations, rather than to dictate it. There are many limitations to the current study. Notably it is limited to non-aliphatic components. Whilst the very much more complicated extension to consider aromatic and cyclic components is underway, the current study serves to illustrate the high dependence on predictive techniques of secondary organic aerosol characteristics pre-
Full Screen / Esc
Printer-friendly Version Interactive Discussion
|
15399
Discussion Paper
Allan, J. D., Topping, D. O., Good, N., Irwin, M., Flynn, M., Williams, P. I., Coe, H., Baker, A. R., ¨ Martino, M., Niedermeier, N., Wiedensohler, A., Lehmann, S., Muller, K., Herrmann, H., and McFiggans, G.: Composition and properties of atmospheric particles in the eastern
|
25
Discussion Paper
References
ACPD 10, 15379–15415, 2010
SOA component partitioning sensitivity – Part 1 G. McFiggans et al.
Title Page Abstract
Introduction
Conclusions
References
Tables
Figures
J
I
J
I
Back
Close
|
20
Acknowledgements. This work was carried out within the UK NERC-funded “QUantifying the Earth SysTem” (QUEST) project under the “QUest Aerosol and Atmospheric Chemistry” (QUAAC) grant number NE/C001613/1 and EU-funded “European Integrated project on Aerosol Cloud Climate and Air Quality interactions” (EUCAARI) under contract number 0368332. DOT was supported by UK National Centre for Atmospheric Sciences (NCAS) funding. Additional support was provided by the NERC-funded “Vast Improvement” project NE/E018181/1.
Discussion Paper
15
|
10
Discussion Paper
5
dicted by absorptive partitioning. Furthermore, the dependence of the sensitivity on the nature and mass of any absorptive core and on the total OA mass loading has not been explored, though is expected to be smaller than those explored here. It should be noted that neither consideration is likely to alter the general and quite unsurprising finding that the sensitivity of the calculations to the property predictions according to all metrics is greater for the more simplified representations. Since very much greater under- or over-prediction of all metrics is possible when a low complexity representation of the organic components is used, it will be extremely important to ensure that i) any simplification of organic aerosol components for large-scale modelling applications adequately represents those present in the atmosphere and that ii) the component properties are accurately represented by any estimation method employed in the model. This clearly indicates to the requirement for refinement and continued critical evaluation of predictive techniques as well as for appropriate laboratory data for a basis set of appropriate data covering the range of atmospheric functionality (as well as test set for technique evaluation). For vapour pressures, such data have only recently been emerging for more widely representative compounds than simple monofunctional proxies (e.g. Booth et al., 2010).
Full Screen / Esc
Printer-friendly Version Interactive Discussion
15400
|
| Discussion Paper
30
Discussion Paper
25
ACPD 10, 15379–15415, 2010
SOA component partitioning sensitivity – Part 1 G. McFiggans et al.
Title Page Abstract
Introduction
Conclusions
References
Tables
Figures
J
I
J
I
Back
Close
|
20
Discussion Paper
15
|
10
Discussion Paper
5
Atlantic and impacts on gas phase uptake rates, Atmos. Chem. Phys., 9, 9299–9314, doi:10.5194/acp-9-9299-2009, 2009. 15384 Aumont, B., Szopa, S., and Madronich, S.: Modelling the evolution of organic carbon during its gas-phase tropospheric oxidation: development of an explicit model based on a self generating approach, Atmos. Chem. Phys., 5, 2497–2517, doi:10.5194/acp-5-2497-2005, 2005. 15381 Barley, M., Topping, D. O., Jenkin, M. J., and McFiggans, G.: Sensitivities of the absorptive partitioning model of secondary organic aerosol formation to the inclusion of water, Atmos. Chem. Phys., 9, 2919–2932, doi:10.5194/acp-9-2919-2009, 2009. 15385, 15393 Barley, M. H. and McFiggans, G.: The critical assessment of vapour pressure estimation methods for use in modelling the formation of atmospheric organic aerosol, Atmos. Chem. Phys., 10, 749–767, doi:10.5194/acp-10-749-2010, 2010. 15382, 15386, 15387 Bloss, C., Wagner, V., Bonzanini, A., Jenkin, M. E., Wirtz, K., Martin-Reviejo, M., and Pilling, M. J.: Evaluation of detailed aromatic mechanisms (MCMv3 and MCMv3.1) against environmental chamber data, Atmos. Chem. Phys., 5, 623–639, doi:10.5194/acp-5-6232005, 2005a. 15381 Bloss, C., Wagner, V., Jenkin, M. E., Volkamer, R., Bloss, W. J., Lee, J. D., Heard, D. E., Wirtz, K., Martin-Reviejo, M., Rea, G., Wenger, J. C., and Pilling, M. J.: Development of a detailed chemical mechanism (MCMv3.1) for the atmospheric oxidation of aromatic hydrocarbons, Atmos. Chem. Phys., 5, 641–664, doi:10.5194/acp-5-641-2005, 2005b. 15381 Bloss, W., Lee, J., Johnson, G., Sommariva, R., Heard, D., Saiz-Lopez, A., Plane, J., McFiggans, G., Coe, H., Flynn, M., Williams, P., Rickard, A., and Fleming, Z.: Impact of halogen monoxide chemistry upon boundary layer OH and HO2 concentrations at a coastal site, Geophys. Res. Lett., 32, L06814, doi:10.1029/2004GL022084, 2005c. 15384 Booth, A. M., Barley, M. H., Topping, D. O., McFiggans, G., Garforth, A., and Percival, C. J.: Solid state and sub-cooled liquid vapour pressures of substituted dicarboxylic acids using Knudsen Effusion Mass Spectrometry (KEMS) and Differential Scanning Calorimetry, Atmos. Chem. Phys., 10, 4879–4892, doi:10.5194/acp-10-4879-2010, 2010. 15399 Clegg, S. L., Kleeman, M. J., Griffin, R. J., and Seinfeld, J. H.: Effects of uncertainties in the thermodynamic properties of aerosol components in an air quality model Part 1: Treatment of inorganic electrolytes and organic compounds in the condensed phase, Atmos. Chem. Phys., 8, 1057–1085, doi:10.5194/acp-8-1057-2008, 2008. 15383
Full Screen / Esc
Printer-friendly Version Interactive Discussion
15401
|
| Discussion Paper
30
Discussion Paper
25
ACPD 10, 15379–15415, 2010
SOA component partitioning sensitivity – Part 1 G. McFiggans et al.
Title Page Abstract
Introduction
Conclusions
References
Tables
Figures
J
I
J
I
Back
Close
|
20
Discussion Paper
15
|
10
Discussion Paper
5
Coe, H., Allan, J. D., Alfarra, M. R., Bower, K. N., Flynn, M. J., McFiggans, G. B., Topping, D. O., Williams, P. I., O’Dowd, C. D., Dall’Osto, M., Beddows, D. C. S., and Harrison, R. M.: Chemical and physical characteristics of aerosol particles at a remote coastal location, Mace Head, Ireland, during NAMBLEX, Atmos. Chem. Phys., 6, 3289–3301, doi:10.5194/acp-6-32892006, 2006. 15384 ¨ Compernolle, S., Ceulemans, K., and Muller, J.-F.: Influence of non-ideality on condensation to aerosol, Atmos. Chem. Phys., 9, 1325–1337, doi:10.5194/acp-9-1325-2009, 2009. 15387 Donahue, N. M., Robinson, A. L., Stanier, C. O., and Pandis, S. N.: Coupled partitioning, dilution, and chemical aging of semivolatile organics, Environ. Sci. Technol., 40, 2635–2643, 2006. 15385, 15390, 15394 Emmerson, K. M., Carslaw, N., Carslaw, D. C., Lee, J. D., McFiggans, G., Bloss, W. J., Gravestock, T., Heard, D. E., Hopkins, J., Ingham, T., Pilling, M. J., Smith, S. C., Jacob, M., and Monks, P. S.: Free radical modelling studies during the UK TORCH Campaign in Summer 2003, Atmos. Chem. Phys., 7, 167–181, doi:10.5194/acp-7-167-2007, 2007. 15384 Erdakos, G. B. and Pankow, J. F.: Gas/particle partitioning of neutral and ionizing compounds to single- and multi-phase aerosol particles. 2. Phase separation in liquid particulate matter containing both polar and low-polarity organic compounds, Atmos. Environ., 38, 1005–1013, 2004. 15398 Fredenslund, A., Jones, R. L., and Prausnitz, J. M.: Group-contribution estimation of activitycoefficients in nonideal liquid-mixtures, Aiche J., 21, 1086–1099, 1975. 15383 Fuchs, N. A. and Sutugin, A. G.: Highly Dispersed Aerosols, Ann Arbor Science, Ann Arbor, MI, 1971. 15384 Goldstein, A. H. and Galbally, I. E.: Known and unexplored organic constituents in the Earth’s atmosphere, Environ. Sci. Technol., 41, 1514–1521, 2007. 15381 Haggerstone, A., Carpenter, L., Carslaw, N., and McFiggans, G.: Improved model predictions of HO2 with gas to particle mass transfer rates calculated using aerosol number size distributions, J. Geophys. Res.-Atmos., 110, D04303, doi:10.1029/2004JD005282, 2005. 15384 Hallquist, M., Wenger, J. C., Baltensperger, U., Rudich, Y., Simpson, D., Claeys, M., Dommen, J., Donahue, N. M., George, C., Goldstein, A. H., Hamilton, J. F., Herrmann, H., Hoffmann, T., Iinuma, Y., Jang, M., Jenkin, M. E., Jimenez, J. L., Kiendler-Scharr, A., Maen´ ot, ˆ A. S. H., Seinfeld, J. H., haut, W., McFiggans, G., Mentel, Th. F., Monod, A., Prev Surratt, J. D., Szmigielski, R., and Wildt, J.: The formation, properties and impact of secondary organic aerosol: current and emerging issues, Atmos. Chem. Phys., 9, 5155–5236,
Full Screen / Esc
Printer-friendly Version Interactive Discussion
15402
|
| Discussion Paper
30
Discussion Paper
25
ACPD 10, 15379–15415, 2010
SOA component partitioning sensitivity – Part 1 G. McFiggans et al.
Title Page Abstract
Introduction
Conclusions
References
Tables
Figures
J
I
J
I
Back
Close
|
20
Discussion Paper
15
|
10
Discussion Paper
5
doi:10.5194/acp-9-5155-2009, 2009. 15381, 15393 Hamilton, J. F., Lewis, A. C., Carey, T. J., and Wenger, J. C.: Characterization of polar compounds and oligomers in secondary organic aerosol using liquid chromatography coupled to mass spectrometry, Anal. Chem., 80, 474–480, 2008. 15381 Hansen, H. K., Rasmussen, P., Fredenslund, A., Schiller, M., and Gmehling, J.: Vapor-liquidequilibria by unifac group contribution. 5. Revision and extension, Ind. Eng. Chem. Res., 30, 2352–2355, 1991. 15389 Heald, C. L., Jacob, D. J., Park, R. J., Russell, L. M., Huebert, B. J., Seinfeld, J. H., Liao, H., and Weber, R. J.: A large organic aerosol source in the free troposphere missing from current models, Geophys. Res. Lett., 32, L18809, doi:10.1029/2005GL023831, 2005. 15381 Iinuma, Y., Boge, O., Gnauk, T., and Herrmann, H.: Aerosolchamber study of the alphapinene/O3 reaction: influence of particle acidity on aerosol yields and products, Atmos. Environ., 38, 761–773, 2004. 15381 IPCC (Intergovernmental Panel on Climate Change): The Physical Science Basis, Fourth Assessment Report, Chapter 2, Working Group I Report, Cambridge University Press, 2007. 15380 Jang, M. S. and Kamens, R. M.: Atmospheric secondary aerosol formation by heterogeneous reactions of aldehydes in the presence of a sulfuric acid aerosol catalyst, Environ. Sci. Technol., 35, 4758–4766, 2001. 15381 Joback, K. G. and Reid, R. C.: Estimation of pure-component properties from groupcontributions, Chem. Eng. Commun., 57, 233–243, 1987. 15387 Johnson, D. and Marston, G.: The gas-phase ozonolysis of unsaturated volatile organic compounds in the troposphere, Chem. Soc. Rev., 37, 699–716, 2008. 15381 Jonsson, A. M., Hallquist, M., and Ljungstrom, E.: Impact of humidity on the ozone initiated oxidation of limonene, delta(3)-carene, and alpha-pinene, Environ. Sci. Technol., 40, 188– 194, 2006. 15381 Kalberer, M., Paulsen, D., Sax, M., Steinbacher, M., Dommen, J., Prevot, A. S. H., Fisseha, R., Weingartner, E., Frankevich, V., Zenobi, R., and Baltensperger, U.: Identification of polymers as major components of atmospheric organic aerosols, Science, 303, 1659–1662, 2004. 15381 Lewis, A. C., Carslaw, N., Marriott, P. J., Kinghorn, R. M., Morrison, P., Lee, A. L., Bartle, K. D., and Pilling, M. J.: A larger pool of ozone-forming carbon compounds in urban atmospheres, Nature, 405, 778–781, 2000. 15381
Full Screen / Esc
Printer-friendly Version Interactive Discussion
15403
|
| Discussion Paper
30
Discussion Paper
25
ACPD 10, 15379–15415, 2010
SOA component partitioning sensitivity – Part 1 G. McFiggans et al.
Title Page Abstract
Introduction
Conclusions
References
Tables
Figures
J
I
J
I
Back
Close
|
20
Discussion Paper
15
|
10
Discussion Paper
5
Marcolli, C. and Peter, Th.: Water activity in polyol/water systems: new UNIFAC parameterization, Atmos. Chem. Phys., 5, 1545–1555, doi:10.5194/acp-5-1545-2005, 2005. 15383, 15388 Myrdal, P. B. and Yalkowsky, S. H.: Estimating pure component vapor pressures of complex organic molecules, Ind. Eng. Chem. Res., 36, 2494–2499, 1997. 15387 Nannoolal, Y., Rarey, J., Ramjugernath, D., and Cordes, W.: Estimation of pure component properties Part 1. Estimation of the normal boiling point of non-electrolyte organic compounds via group contributions and group interactions, Fluid Phase Equilibr., 226, 45–63, 2004. 15387 Nannoolal, Y., Rarey, J., and Ramjugernath, D.: Estimation of pure component properties. Part 3. Estimation of the vapor pressure of non-electrolyte organic compounds via group contributions and group interactions, Fluid Phase Equilibr., 269, 117–133, 2008. 15387 Odum, J. R., Hoffmann, T., Bowman, F., Collins, D., Flagan, R. C., and Seinfeld, J. H.: Gas/particle partitioning and secondary organic aerosol yields, Environ. Sci. Technol., 30, 2580–2585, 1996. 15381, 15382 Pankow, J. F.: An absorption-model of gas-particle partitioning of organic-compounds in the atmosphere, Atmos. Environ., 28, 185–188, 1994. 15381, 15382, 15385, 15386 Pankow, J. F., Seinfeld, J. H., Asher, W. E., and Erdakos, G. B.: Modeling the formation of secondary organic aerosol. 1. Application of theoretical principles to measurements obtained in the alpha-pinene/, beta- pinene/, sabinene/, delta(3)-carene/, and cyclohexene/ozone systems, Environ. Sci. Technol., 35, 1164–1172, 2001. 15382, 15386 Pankow, J. F. and Chang, E. I.: Variation in the sensitivity of predicted levels of atmospheric organic particulate matter (OPM), Environ. Sci. Technol., 42, 7321–7329, doi:10.1021/es8003377, 2008. 15393 Peng, C., Chan, M. N., and Chan, C. K.: The hygroscopic properties of dicarboxylic and multifunctional acids: measurements and UNIFAC predictions, Environ. Sci. Technol., 35, 4495– 4501, 2001. 15383, 15387 Raatikainen, T. and Laaksonen, A.: Application of several activity coefficient models to waterorganic-electrolyte aerosols of atmospheric interest, Atmos. Chem. Phys., 5, 2475–2495, doi:10.5194/acp-5-2475-2005, 2005. 15382 Schwartz, S. E.: Mass-transport considerations pertinent to aqueous phase reactions of gases in liquid-water clouds, in: Chemistry of Multiphase Atmospheric Systems, edited by: Jaeschke, W., NATO ASI Series, vol. G6, 1986. 15384
Full Screen / Esc
Printer-friendly Version Interactive Discussion
15404
|
| Discussion Paper
30
Discussion Paper
25
ACPD 10, 15379–15415, 2010
SOA component partitioning sensitivity – Part 1 G. McFiggans et al.
Title Page Abstract
Introduction
Conclusions
References
Tables
Figures
J
I
J
I
Back
Close
|
20
Discussion Paper
15
|
10
Discussion Paper
5
Seinfeld, J. H., Erdakos, G. B., Asher, W. E., and Pankow, J. F.: Modeling the formation of secondary organic aerosol (SOA). 2. The predicted effects of relative humidity on aerosol formation in the alpha-pinene-, beta-pinene-, sabinene-, delta(3)-carene-, and cyclohexeneozone systems, Environ. Sci. Technol., 35, 1806–1817, 2001. 15381, 15393 Sommariva, R., Bloss, W. J., Brough, N., Carslaw, N., Flynn, M., Haggerstone, A. L., Heard, D. E., Hopkins, J. R., Lee, J. D., Lewis, A. C., McFiggans, G., Monks, P. S., Penkett, S. A., Pilling, M. J., Plane, J. M. C., Read, K. A., Saiz-Lopez, A., Rickard, A. R., and Williams, P. I.: OH and HO2 chemistry during NAMBLEX: roles of oxygenates, halogen oxides and heterogeneous uptake, Atmos. Chem. Phys., 6, 1135–1153, doi:10.5194/acp-61135-2006, 2006. 15384 Stanier, C. O., Pathak, R. K., and Pandis, S. N.: Measurements of the volatility of aerosols from alpha-piniene ozonolysis, Environ. Sci. Technol., 41, 2756–2763, 2007. 15381 Stein, S. E. and Brown, R. L.: Estimation of normal boiling points from group contributions, J. Chem. Inf. Comp. Sci., 34, 581–587, 1994. 15387 Tong, C. H., Clegg, S. L., and Seinfeld, J. H.: Comparison of activity coefficient models for atmospheric aerosols containing mixtures of electrolytes, organics, and water, Atmos. Environ., 42, 5459–5482, 2008. 15387, 15388, 15398 Topping, D. O., McFiggans, G. B., and Coe, H.: A curved multi-component aerosol hygroscopicity model framework: Part 2 – Including organic compounds, Atmos. Chem. Phys., 5, 1223–1242, doi:10.5194/acp-5-1223-2005, 2005. 15387 Williams, B. J., Goldstein, A. H., Millet, D. B., Holzinger, R., Kreisberg, N. M., Hering, S. V., White, A. B., Worsnop, D. R., Allan, J. D., and Jimenez, J. L.: Chemical speciation of organic aerosol during the International Consortium for Atmospheric Research on Transport and Transformation 2004: Results from in situ measurements, J. Geophys. Res.-Atmos., 112, D10S26, doi:10.1029/2006JD007601, 2007. 15384 Yan, W. D., Topphoff, M., Rose, C., and Gemhling, J.: Prediction of vapor-liquid equilibria in mixed-solvent electrolyte systems using the group contribution concept, Fluid Phase Equilibr., 162, 97–113, 1999. 15383 Zhang, Q., Jimenez, J. L., Canagaratna, M. R., Allan, J. D., Coe, H., Ulbrich, I., Alfarra, M. R., Takami, A., Middlebrook, A. M., Sun, Y. L., Dzepina, K., Dunlea, E., Docherty, K., DeCarlo, P. F., Salcedo, D., Onasch, T., Jayne, J. T., Miyoshi, T., Shimono, A., Hatakeyama, S., Takegawa, N., Kondo, Y., Schneider, J., Drewnick, F., Borrmann, S., Weimer, S., Demerjian, K., Williams, P., Bower, K., Bahreini, R., Cottrell, L., Griffin, R. J., Rautiainen, J.,
Full Screen / Esc
Printer-friendly Version Interactive Discussion
| Discussion Paper
10
Discussion Paper
5
Sun, J. Y., Zhang, Y. M., and Worsnop, D. R.: Ubiquity and dominance of oxygenated species in organic aerosols in anthropogenically-influenced Northern Hemisphere midlatitudes, Geophys. Res. Lett., 34, L13801, doi:10.1029/2007GL029979, 2007. 15381 Zuend, A., Marcolli, C., Luo, B. P., and Peter, T.: A thermodynamic model of mixed organicinorganic aerosols to predict activity coefficients, Atmos. Chem. Phys., 8, 4559–4593, doi:10.5194/acp-8-4559-2008, 2008. 15383, 15388, 15398 Zuend, A., Marcolli, C., Peter, T., and Seinfeld, J. H.: Computation of liquid-liquid equilibria and phase stabilities: implications for RH-dependent gas/particle partitioning of organicinorganic aerosols, Atmos. Chem. Phys. Discuss., 10, 12497–12561, doi:10.5194/acpd-1012497-2010, 2010. 15398
ACPD 10, 15379–15415, 2010
SOA component partitioning sensitivity – Part 1 G. McFiggans et al.
Title Page Introduction
Conclusions
References
Tables
Figures
J
I
J
I
Back
Close
|
Abstract
Discussion Paper | Discussion Paper |
15405
Full Screen / Esc
Printer-friendly Version Interactive Discussion
G. McFiggans et al.: SOA component partitioning sensitivity; part 1
11
Discussion Paper
0.35
|
0.2
0.15
10, 15379–15415, 2010
SOA component partitioning sensitivity – Part 1 G. McFiggans et al.
Title Page Abstract
Introduction
Conclusions
References
Tables
Figures
J
I
J
I
Back
Close
|
0.1
0.05
0
1
2
3
4
5
6
7
8
9
10
11
12
Number of carbon atoms
Discussion Paper
Probability of occurence
0.25
Discussion Paper
Group1 Group2 Group3 Group4 Group5 Group6
0.3
ACPD
|
clarity
figure
|
15406
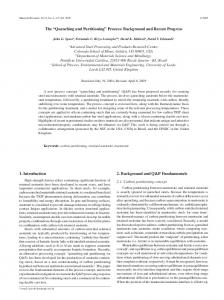
Discussion Paper
Fig. 1. An illustration of a randomly-generated distribution of functional groups as a function of 1. An illustration of a randomly-generated distribution of functhe carbon Fig. number. each case, distributions tional groups as aIn function of the carbon number. In each case, of the 29 functional groups represented within distributions of the model 29 functional groups represented withinonly the the modified-UNIFAC are generated; 6 are shown here for clarity. modified-UNIFAC model are generated; only 6 are shown here for
Full Screen / Esc
Printer-friendly Version Interactive Discussion
Discussion Paper
2
10
0
10
10, 15379–15415, 2010
SOA component partitioning sensitivity – Part 1 G. McFiggans et al.
Title Page Abstract
Introduction
Conclusions
References
Tables
Figures
J
I
J
I
Back
Close
|
−2
10
2
10
100
1000
10000
Number of compounds
|
15407
Discussion Paper
variants, all T - & RH-values
|
Fig. 2. An example illustration of the sensitivity of predicted total condensed organic mass Fig. 2. An example illustration of the sensitivity of predicted toacross all conditions to mass theacross differences vapour pressure predictive technique in the partitiontal condensed organic all conditions to in the differences in vapour pressure predictive technique in the partitioning model of non-ideality (red bars, n=9). The left-hand ing model (green bars, n=45) and the inclusion (green bars, n=45) and the inclusion of non-ideality (red bars, n=9). The left-hand bar in each pair encompasses all property prediction bar in each pair encompasses all property prediction variants, all T - and RH-values.
Discussion Paper
Factor difference in condensed mass
|
Vapour pressure Non−ideality
Wet Dry
Discussion Paper
4
10
ACPD
Full Screen / Esc
Printer-friendly Version Interactive Discussion
J−N/VP
4
10
2
2
10
10
Discussion Paper
SB−N/VP
4
10
|
0
10
−2
−2
10
10
−4
10
N−MY/VP
4
SB−MY/VP
4
10
10
0
10
0
10
−2
10
−2
10
−2
10
10
−4
−4
2
10 10 100 1000 10000
2
10 100 1000 10000
Fig. 3. Sensitivities of predicted total organic mass for an example functionality distribution Fig. 3. Sensitivities of predicted total organic mass for an examacross changing temperatures for wet (greenforbars, ple functionality distribution across changing temperatures wet n=9) and dry (blue bars, n=3) conditions us(green bars, n=9)model and dry (blue n=3) of conditions using the pressure predictive techniques. See Sect. 3.1 ing the partitioning withbars, each the vapour partitioning model with each of the vapour pressure predictive techfor a fuller discussion. niques. See section 3.1 for a fuller discussion.
15408
|
10 10 100 1000 10000
Discussion Paper
2
|
−4
J−MY/VP
4
2
10
0
10 100 1000 10000
10
2
10
2
Discussion Paper
2
10
10 10 100 1000 10000
10, 15379–15415, 2010
SOA component partitioning sensitivity – Part 1 G. McFiggans et al.
Title Page Abstract
Introduction
Conclusions
References
Tables
Figures
J
I
J
I
Back
Close
|
10
−4
2
Discussion Paper
0
10
ACPD
Full Screen / Esc
Printer-friendly Version Interactive Discussion
1.4
0.45
1.2
1
0.35 0.3
0.8
0.25 0.6
10, 15379–15415, 2010
SOA component partitioning sensitivity – Part 1 G. McFiggans et al.
Title Page Abstract
Introduction
Conclusions
References
Tables
Figures
J
I
J
I
Back
Close
|
0.2
0.4
0.1 0.2 0.05
−4
−2
0
2
4
6
0
Discussion Paper
0.15
0 −6
Discussion Paper
0.4
|
VP (2) VP (10) VP (100) VP (1000) VP (10000) Act
Discussion Paper
0.5
ACPD
Factor difference in condensed mass (log)
| |
15409
Discussion Paper
Fig. 4. Distribution of sensitivities of predicted total organic mass to change in vapour presFig. 4. Distribution of sensitivities of predicted total organic mass sure technique the inclusion ofinclusion non-ideality across all 1000 functionality distributions. See to change in and vapour pressure technique and the of nonall 1000 functionality distributions. See section 3.1 Sect. 3.1ideality for aacross fuller discussion. for a fuller discussion.
Full Screen / Esc
Printer-friendly Version Interactive Discussion
Discussion Paper
ACPD 10, 15379–15415, 2010
| Discussion Paper
SOA component partitioning sensitivity – Part 1 G. McFiggans et al.
Title Page Introduction
Conclusions
References
Tables
Figures
J
I
J
I
Back
Close
|
Abstract
Discussion Paper | Fig. 5. Predicted binned component volatility for a 10 000 compound representation of one example functionality distribution set. The abscissa is the base 10 logarithm of the saturation Fig. 5. Predicted of binned volatility forrespective a 10000 comconcentration the component components in the volatility bin. The green bars correspond to pound representationand of one distribution set.The total condensed mass is indicated on the particulate theexample yellowfunctionality to the vapour phase. The abscissa is the base 10 logarithm of the saturation concentration each panel. See Sect. 3.2 for a fuller discussion.
Discussion Paper
15410
|
of the components in the respective volatility bin. The green bars correspond to the particulate and the yellow to the vapour phase. The total condensed mass is indicated on each panel. See section 3.2 for a fuller discussion.
Full Screen / Esc
Printer-friendly Version Interactive Discussion
Discussion Paper
50
30
20
10
|
0
Discussion Paper
% of condensed mass
40
−10
−20