Social Networks as Data Source for Recommendation Systems Mathias Bank1 and Juergen Franke1 Daimler AG, Research & Development, D-89081 Ulm, Germany
[email protected]
Abstract. Reviews and review based rankings are widely used in recommendation systems to provide potential customers quality information about selected products. During the last years, many researchers have shown that these reviews are neither objective nor do they represent real quality values. Even established ranking methods designed to fix this problem have been shown to be unreliable. In this work, user generated content of fora, weblogs and similar trustworthy social networks is proposed as an alternative data source. It is shown how this data can be used to calculate a satisfaction and relevance measure for different product features to provide potential customers reliable quality information. The method is evaluated in the automotive domain using J.D. Power’s established Initial Quality Study to ensure providing meaningful quality-related data. Key words: social networks, reviews, recommendation system
1 Introduction During the last 10 years, the e-commerce sector has shown that online shopping portals have a great growth potential which has not even been stopped by the economic crisis. Nevertheless, in a highly competitive environment it is simply not enough to offer product catalogs only. Today, potential customers expect more comfort: In addition to high quality product information they want to be guided through the large number of possible products. Recommendation systems have been successfully used by many different e-commerce portals to suggest relevant products by providing product rankings or experience reviews of other customers [1, 2]. There are different types of systems to convert browsers into buyers, improve cross-selling or enforce customer loyalty [1]. Reviews and review based rankings are the most widely used recommendation system which is supposed to provide relevant quality information based on the experience of other customers. Recent work has shown that this simple and widely used method does not reflect real quality values [3, 4] and that even different rating methods (e.g. amazon’s “helpful” ratings) cannot assure quality relevant reviews [5, 6]. Nevertheless, 78% of Internet users rely on recommendations from consumers and 61% trust customer opinions posted online [7].
2
M. Bank, J. Franke
In this work, a new recommendation system is presented that is designed to provide reliable and quality relevant product information. Instead of relying on a small number of locally available and possibly manipulated data, it utilizes user generated content in Internet fora, web-logs and other social networks. The very large amount of mostly unbiased comments (section 2) is used to provide the customer a satisfaction and relevance measure on different abstraction levels. The proposed system provides these measures for the complete life-cycle of a selected product and is also able to analyze quality changes over time by selecting different time slots. This is a very important information for long-run products like cars or hotels.
2 User Generated Content as Recommendation Source In most community systems, review based recommendation systems are realized using free-text fields in addition to star-ratings. While shop owners can increase their revenue offering comment functionality [4, 8], customers are able to read product experience of other customers [3]. This win-win situation leads to a highly accepted recommendation system that is realized in nearly every online shop system and thus comments are becoming an accepted form of cultural expression [3]. Unfortunately, customer reviews are not objective at all. Recent work has shown that most of the reviews posted in online markets are bimodal [9]: they are either allotted an extremely high rating or an extremely low rating. The additional available average numerical star-rating does not convey a lot of information in this situation so that the users have to read free-text comments. It has been shown that most of these comments are positively biased. In some situations, they are misused for advertisement, promotion and communication issues or they are simply duplicated [3]. A measure is needed to distinguish high quality reviews from low quality reviews. Different shopping systems (e.g. amazon.com) have introduced a peer-reviewed measure, in which each customer can specify if a review was helpful. It has been shown that these assessments are influenced by a number of factors [5, 6]. Nevertheless, studies have used these votes to train ranking models [10], which in consequence reflect this bias. Different approaches try to solve this problem by using extractable meta data like objectivity, subjectivity and readability to create an objective quality measure [8, 5]. Previously mentioned methods do not take time into account, so that it is not possible to identify quality problems over time: The review based recommendation systems assume that there are no quality changes. This is surely not correct for products which are sold for a long time like cars or hotels. Additionally, these methods require a product to have reviews. New or low-traffic items do not have such reviews so that customers may prefer other products. Shop owners and product manufacturers can counteract this by adding some baits but there are also paid or manipulated comments [3]. This not-recommended method undermines trust and thus harms the long-term reliability.
Social Networks as Data Source for Recommendation Systems
3
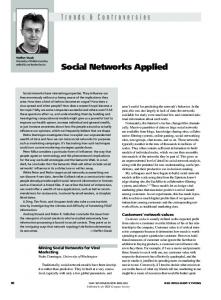
In the following section, a new recommendation system is proposed that is able to fix these vulnerabilities. Instead of relying only on locally available comments that are possibly manipulated to increase sales, the algorithm takes user generated content of fora, weblogs and other social networks into account. Currently, there are more than 475 million active Internet users in the world. More than 38% want to start their own web-log and 34% of blog authors are writing their opinions on products and brands [11]. It is assumed that this data is not as biased as product reviews because there are no ulterior financial motives. Nevertheless, the data source has to be selected carefully. During the last years, especially weblogs have attracted attention due to paid content which is why in the USA the Federal Trade Commission FTC regulates weblogs in their use of paid content with the beginning of December 1st, 20091 . An analysis of 1, 196 discussions in Internet fora has shown however, that most of these discussions are focused on topics the customer needs help or advice (fig. 1). These discussions provide a lot of quality information. A carefully selected data source of Internet fora and trustworthy weblogs is the base for the proposed recommendation system. It is not recommended to track “the whole” Internet.
Off topic
Offer
Car description
Service description
Problem description
Car modification
60,00% 50,00% 40,00% 30,00% 20,00% 10,00% 0,00%
Fig. 1. Abstract topic analysis on 1, 196 entries of the automotive forum benzworld.org. Nearly 50% of the posts are dealing with technical or conceptual problems in which the author needs some advice. 25% of the entries are not dealing with any car at all and can be disregarded for quality analysis.
3 Social Network Analysis In the following, the workflow of the proposed recommendation system is discussed in detail. It is assumed that user generated content of weblogs, fora or other social networks is already downloaded by specialized web crawlers that only store relevant user generated content additional to author names and posting time [12]. Advertisement, navigation and other page structure elements are already filtered out. 1
http://www.ftc.gov/os/2009/10/091005endorsementguidesfnnotice.pdf
4
M. Bank, J. Franke
3.1 Data Analysis In contrast to product reviews, user generated content in social networks is not focused on quality or satisfaction reports nor is it supposed to be analyzed automatically. While there is some structured information in product reviews (e.g. star ratings or pro and contra lists) the discussed user postings are completely unstructured. The text neither contains a special field that defines the discussed product features nor does it provide a defined field for the customer’s satisfaction. It is for the algorithms to introduce this structure. This is done by data cleaning, natural language processing and information extraction algorithms. The schematic of the proposed workflow can be seen in figure 2. The recommendation system itself is designed to be independent of used data analysis algorithms. This is why different approaches are discussed and the used algorithms for the realized prototype (section 4) are presented in the following subsections. Pre-processing First of all, in a multilingual approach the language of the text has to be identified to load special language dependent resources and algorithms at downstream steps. This is done using a n-gram classification [13]. After tokenization using regular expressions, the content information is enriched with part-of-speech tagging applying the TreeTagger algorithm [14]. Contrary to texts typically used for research issues, user contributions in weblogs, fora and similar systems are of poor quality, containing a lot of abbreviations, misspellings, dialect words, community specific nicknames and syntax (e.g. @nickname: ...) so that some cleaning steps are necessary. Tokens which influence analysis negatively — such as stop words, abbreviations, (nick-) names, e-mail addresses and URLs which can be disregarded in downstream analysis steps — are annotated using simple word lists. Misspelled and dialect words are fixed in English comments [15, 16]. In other languages this step is not done because tests have shown that a correction will cause more errors2 . Finally redundant text doublets caused by quotations are annotated comparing word n-grams to detect similar text fragments across postings in a discussion thread. Topic Detection In recent years, different researchers have focused aspectbased opinion mining to capture reviewers’ opinions toward different product aspects (e.g. [17, 18, 19, 20]). Product feature extraction and categorization is surely the most difficult task in this process. Next to different statistical approaches using co-occurrences, association rules [17], PMI [18] and probability based algorithms [19] have been proposed to handle this difficult task. Synonym treatment is suggested by means of ontologies similar to Wordnet [17, 18] or by using fuzzy string matches [5]. Contrary to the discussed approaches, the proposed recommendation system is not designed to focus on product features but on topics generally. The candidate list of potential topics has to be extracted of completely unstructured user 2
In German, for example, it is possible to combine different single words to a new one, which to our knowledge cannot be reliably handled by current available algorithms.
Social Networks as Data Source for Recommendation Systems
5
comments. The usage of semistructured information [20] is not possible due to missing data structures. Different rule based approaches have shown an average precision between 79% and 89% on usually uniformly formulated phrases [17]. These performances cannot be assumed in unstructured content found in weblogs or fora because there are many different comment structures available. Schierle and Trabold proposed to realize a taxonomy based approach [21]: To label each comment with related topics, the terminology of a product domain is organized in a taxonomy providing the possibility to store multi-lingual synonyms for each concept. The special taxonomy structure makes it possible to disambiguate different concepts having the same word associated to them regarding part-of-speech and context. Using simple token matching algorithms, each user comment can be labeled with corresponding terminology terms. This approach ensures high precision which is very important for a recommendation system to gain customers’ trust. Thanks to the large amount of available data it is possible to prefer precision while maintaining sufficient data points. The taxonomy structure itself summarizes different concepts to topics. In the following, these topics are called “product features” because it is not important if the analysis focuses on specific features or abstract topics. To ensure adequate recall values and to cover different terms used by customers, this taxonomy can be extended using semi-supervised terminology extraction algorithms presented in previously mentioned publications. This approach causes of course more human effort. Low precision results, however, would undermine user trust because of wrong topic classification. In addition, off-topic discussions are excluded in the product analysis using this method. Sentiment Analysis Next to the topics the users are talking about, it is important to know in which mood they are talking. Recent work dealing with user reviews has used already classified pro and contra information provided by the users themselves [17, 20]. Scaffidi et al. suggest to use the additional used star rating assuming that this average rating represents user satisfaction for mentioned product features [19]. This was already disproved by Kano et al. [22] who have recognized that product features satisfy a customer in varying degrees. Lexicon based approaches have been introduced to assign sentiment values to words causing emotions [23, 24, 25]. This simple technique is not adequate for most real world scenarios because the intended sentiment depends not only on single words but on the context. Different machine learning approaches have been proposed to take this into account (e.g. [26, 27]). Dave et al. have shown that these methods perform well on whole reviews but not on sentences [27] so that it is not possible to extract topic related sentiment information. The proposed analysis algorithm uses an approach similar to the algorithm used for topic detection: A sentiment lexicon is represented as a taxonomy, enriched with context information in which a given sentiment value is valid. Each concept appearance in user generated content is annotated with the corresponding sentiment value ∈ [−1; 1]. To take relational information into account, each sentiment word is assigned to the feature annotation located next to it.
6
M. Bank, J. Franke
3.2 User Driven SWOT Analysis The proposed recommendation system is supposed to provide an abstract view to all user comments that are dealing with specific products and product features. To provide customer related information about product specific strengths and weaknesses, opportunities and threats (SWOT), two different measures are calculated: 1. First a satisfaction index is calculated to estimate the overall quality estimation for each feature yi and product xj . 2. Additionally, a relevance index is calculated to provide information on how relevant the product feature is in customers’ point of view. Satisfaction Calculation Intuitively, one might assume that satisfaction is the ratio of the number of positive to negative comments. But this presupposes to have a balanced lexicon and a balanced language. Both conditions are very unlikely. That is why the system defines neutral satisfaction for a feature yi as ratio of positive f + (yi ) and negative f − (yi ) comments for all products. The satisfaction index s(yi , xj ) for a given product xj is based on the number of positive posts concerning a product-feature combination f + (yi , xj ) and the number of negative posts f − (yi , xj ). fpositive = fnegative =
s(yi , xj ) =
f + (yi ,xj ) f + (yi ) f − (yi ,xj ) f − (yi )
f positive −1 f negative
if fpositive ≤ fnegative
f negative 1 − f positive
else
(1)
A potential customer can compare the satisfaction value of different products x1 , . . . , xn on feature level yi : A higher satisfaction value s ∈ [−1; 1] for product xj and feature yi implies higher satisfaction compared to other products with feature yi . Relevance Calculation Different product features are discussed with varying frequency. A feature the customer has to deal with every day is more critical in case of misbehavior than a feature used more rarely. A user driven recommendation system has to take this issue into account and thus has to provide a relevance measure. Recent work has used absolute counts [17]. The analysis of user comments has shown however that it is important to be aware of different frequencies of occurrence for different products: On the one side product A is much more mentioned than product B because A is a mainstream product. On the other side a non-mainstream product C can be mentioned even more frequently because the manufacturer was able to motivate users of social networks to talk about its products (e.g. Apple).
Social Networks as Data Source for Recommendation Systems
7
The relevance of a given feature yi for product xj is the probability p(yi |xj ) that depends on the frequency f of both features relative to the product itself: p(yi |xj ) =
f (yi , xj ) f (xj )
(2)
The formula measures the probability that other users publish comments about feature yi while dealing with product xj . Thus it provides information about how relevant feature yi is depending on product xj . It is not necessary to care about different product frequencies any more.
4 Evaluation 4.1 Prototype Implementation The proposed recommendation system has been realized as a prototype in the automotive domain. It tracks 20 automotive Internet fora and 103 weblogs. In sum, the analysis system has downloaded 13 million German and English user comments. The taxonomy for topic detection contains 2, 081 automotive-related multilingual concepts (e.g. components, service terms) with 5, 392 synonyms. These terms have been extracted from different automotive lexica in addition to cooccurrences found in real fora data. The sentiment lexicon was created based on [28] in addition to English translations. User comments are preprocessed using the OASIS Unstructured Information Management Architecture (UIMA) [29, 30]. All analysis results are stored in a Lucene data index for fast data access so that incremental data updates are possible (fig. 2). Backend
Frontend SWOT Analysis
Sentiment Analysis
Topic Detection
PoS Tagger
Spelling Correction
Language Detection
ForumBlog-Crawler Crawler [5] (RSS)
Tokenizer
Pre-Processing
Lucene Index
Relevance Analysis
Data Analysis
Satisfaction Analysis
Data Collection
Fig. 2. Prototype architecture for the proposed recommendation system: The prototype tracks different Internet fora and weblogs and analyzes the downloaded data (section 3.1). The extracted information is stored in a Lucene data index for fast access and incremental updates, which is used by the frontend for the SWOT analysis (section 3.2).
The frontend, the customer interacts with, is a Rich Internet Application (RIA) based on GWT3 . The user can drag products and product features to 3
http://code.google.com/webtoolkit/
8
M. Bank, J. Franke
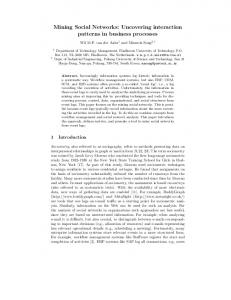
an analysis table in which the system automatically calculates all necessary frequencies using Lucene search queries. The recommendation system additionally classifies each satisfaction value to five different groups based on empirically determined borders. Each class is represented by one of five different arrows in order to give a quick quality impression (figure 3).
(a) satisfaction analysis
(b) time analysis
Fig. 3. Prototype use case: A potential customer wants to compare customer satisfaction for three different car models. After selecting features relevant to the user, the prototype calculates the satisfaction and the relevance index (a). Each product-feature combination can be analyzed over time (b).
Next to the abstract overview, the user can analyze the satisfaction and relevance indices over time to see quality changes during the last months and years. The user is able to list the corresponding comments to get linked to the original web pages. 4.2 Evaluation Results In order to assess whether the proposed system performs a useful product advice, two different questions are analyzed. First, it has to be ensured, that there is enough data available to generate statistically relevant statements. Using the taxonomy structure, the average number of postings for manufacturers, products, product models and product features at different levels of detail can be quantified. The analysis shows that there is a large number of comments available for manufacturers and products (fig. 4 (a)). The sales designation instead can be found in an insufficient number. This is caused by the fact that sales designations in the automotive domain are specifying different product variations which in most cases are not subject of a problem description. Model names and internal model series are well mentioned. Product features on the other side are discussed in varying frequency: While feature comments are numerous for more abstract features (fig. 4 (b)) special ones are rarely mentioned. In this situation, the taxonomy approach does not fit. The user is neither mentioning a feature nor a synonym. To improve the system quality on detail level, it would be additionally necessary to link symptoms to all relevant product features, which on the other side would decrease data precision.
Social Networks as Data Source for Recommendation Systems 1000000
1000000,00
100000
100000,00
10000
10000,00
1000
1000,00
100
100,00
10
10,00
1 manufacturer
model
internal model series
sales designation
(a) product coverage
9
1,00 1
2
3 4 Hierarchy Level
5
6
7
(b) topic coverage
Fig. 4. Coverage analysis: There is a large number of comments (y axis) available for manufacturers, models and internal model series. Sales designation instead is less useful due to small reliability (a). The discovery of product features depends on the hierarchical level (b). Very specific components are not mentioned in reliable number.
Ensuring the topics of analysis can be found in the proposed data source, the resulting product ratings have been compared to survey results of J.D. Power’s “Initial Quality Study” IQS. This study is based on a 228-question battery designed to provide manufacturers with information to facilitate identifying problems. Using J.D. Power’s quality index, it is possible to compare the system output to a well established quality measure. This is done by comparing 36 different cars of 10 different manufacturers in 2008. For each selected model, there are more than 400 user comments available so that each result is statistically reliable. Due to different categorization methods, both measures are compared on the most abstract level. IQS distinguishes three different ratings: Initial Quality, Performance & Design and Predicted Reliability. Each one measures the quality relative to other cars in the market. The three parts are merged to one global car rating ∈ [1; 5]. The proposed recommendation system distinguishes different features defined by the taxonomy structure. A comparable concept is the most abstract topic: component, which consists of all other product features. The calculated correlation coefficient of both measures is 0.46. Thus, there is no perfect match between J.D. Power’s IQS survey and the satisfaction index proposed in this work. Nevertheless there is some correlation. Due to different measure intervals, the significance of correlation can not be calculated directly. Therefore, the proposed satisfaction index ∈ [−1; 1] is rescaled to J.D. Power’s measure interval ∈ [1; 5] using a simple linear regression, which does not affect correlation. s2 (yi , xj ) = 3.66 ∗ s(yi , xj ) + 3.31
(3)
The correlation of both measures would be significant if the expected difference is 0. Using a t-test4 , H0 (µ0 = 0) could not be rejected and thus, there is no evidence that there is a systematic difference. To minimize the Type II error, 4
Both measures are normally distributed, which is ensured using the Shapiro-Wilk Normality Test
10
M. Bank, J. Franke
the t-test is calculated for other possible differences (table 1). The root mean squared error of both measures is 0.65. H0 µ0 = 0 µ0 = 0.25 µ0 = 0.5 µ0 = 1 µ0 = 2
t −0.015 −1.833 −3.650 −7.284 −14.554
two-tailed p-value interpretation 0.988 not rejectable 0.073 rejectable for α = 10% 0.001 rejectable for α = 1% 2.4 ∗ 10−9 rejectable 2 ∗ 10−19 rejectable
Table 1. t-test for significance calculation
There are some reasons for expecting small differences between J.D. Power’s IQS and the proposed measure (e.g. ambiguities, irony, sarcasm, . . . ). The main reason is that J.D. Power uses a questionnaire while the proposed recommendation system only collects unrequested user feedback which not only contains information about hard problem facts but also soft facts (e.g. service quality). These customer expectations are implicitly available in the Internet data which makes the data biased compared to J.D. Power’s IQS. This fact changed the overall result, however, only moderately so that the proposed recommendation system tends to similar statements regarding the well established J.D. Power’s Initial Quality Study.
5 Conclusion Shopping systems can significantly increase the sales volume by providing product reviews created by other customers. Although it has been shown by different researchers that these reviews are not reliable in terms of product quality, potential customers trust in these comments. It is anticipated that this issue will decrease the long-term usage of the currently widely used recommendation system. In this work, an alternative data source is presented: social networks. Using different text mining techniques, user generated content of Internet fora, weblogs and other trustworthy social networks can be utilized to provide customers a mostly unbiased aspect-oriented satisfaction overview. Next to different abstraction levels, a potential customer can analyze quality changes over time. The applicability has been shown in the automotive domain. The analysis method does not depend on the proposed natural language processing algorithms, so that the recommendation system can benefit from future research in the area of topic detection and sentiment analysis. Especially topic relevant algorithms could improve the recommendation system on product detail level.
Social Networks as Data Source for Recommendation Systems
11
References 1. J. B. Schafer, J. Konstan, and J. Riedl, “Recommender systems in e-commerce,” Proceedings of the 1st ACM conference on Electronic commerce, pp. 158–166, 1999. 2. M. Montaner, B. L´ opez, and J. L. de la Rosa, “A taxonomy of recommender agents on the internet,” Artificial Intelligence Review, vol. 19, pp. 285 – 330, 2003. 3. S. David and T. J. Pinch, “Six degrees of reputation: The use and abuse of online review and recommendation systems,” First Monday, July 2006, special Issue on Commercial Applications of the Internet. 4. N. Hu, L. Liu, and J. J. Zhang, “Do online reviews affect product sales? the role of reviewer characteristics and temporal effects,” Inf. Technol. and Management, vol. 9, no. 3, pp. 201–214, 2008. 5. J. Liu, Y. Cao, C.-Y. Lin, Y. Huang, and M. Zhou, “Low-quality product review detection in opinion summarization,” in Proceedings of the Joint Conference on Empirical Methods in Natural Language Processing and Computational Natural Language Learning (EMNLP-CoNLL), 2007, pp. 334–342, poster paper. 6. C. Danescu-Niculescu-Mizil, G. Kossinets, J. Kleinberg, and L. Lee, “How opinions are received by online communities: a case study on amazon.com helpfulness votes,” in WWW ’09: Proceedings of the 18th international conference on World wide web. New York, NY, USA: ACM, 2009, pp. 141–150. 7. Nielsen online, “Buzzmetrics,” May 2008. [Online]. Available: http://de.nielsen. com/products/documents/NielsenonlineBuzzMetrics20080521.pdf 8. A. Ghose and P. G. Ipeirotis, “Designing novel review ranking systems: predicting the usefulness and impact of reviews,” in ICEC ’07: Proceedings of the ninth international conference on Electronic commerce. New York, NY, USA: ACM, 2007, pp. 303–310. 9. N. Hu, P. A. Pavlou, and J. Zhang, “Can online reviews reveal a product’s true quality?: empirical findings and analytical modeling of online word-of-mouth communication,” in EC ’06: Proceedings of the 7th ACM conference on Electronic commerce. New York, NY, USA: ACM, 2006, pp. 324–330. 10. S.-M. Kim, P. Pantel, T. Chklovski, and M. Pennacchiotti, “Automatically assessing review helpfulness,” in EMNLP ’06: Proceedings of the 2006 Conference on Empirical Methods in Natural Language Processing. Morristown, NJ, USA: Association for Computational Linguistics, 2006, pp. 423–430. 11. Universal McCann, “Wave.3 - social media tracker,” March 2008. [Online]. Available: http://www.universalmccann.com/ 12. M. Bank and M. Mattes, “Automatic user comment detection in flat internet fora.” in DEXA Workshops. IEEE Computer Society, 2009, pp. 373–377. 13. W. B. Cavnar and J. M. Trenkle, “N-gram-based text categorization,” in In Proceedings of SDAIR-94, 3rd Annual Symposium on Document Analysis and Information Retrieval, 1994, pp. 161–175. 14. H. Schmid, “Probabilistic part-of-speech tagging using decision trees,” in Proceedings of International Conference on New Methods in Language Processing, September 1994. [Online]. Available: http://www.ims.uni-stuttgart.de/ftp/pub/ corpora/tree-tagger1.pdf 15. M. Schierle, S. Schulz, and M. Ackermann, “From spelling correction to text cleaning - using context information.” in Data Analysis, Machine Learning and Applications, ser. Studies in Classification, Data Analysis, and Knowledge Organization. Springer, 2008, pp. 397–404.
12
M. Bank, J. Franke
16. W. D. Smet and M.-F. Moens, “Generating a topic hierarchy from dialect texts.” in DEXA Workshops. IEEE Computer Society, 2007, pp. 249–253. 17. B. Liu, M. Hu, and J. Cheng, “Opinion observer: analyzing and comparing opinions on the web,” in WWW ’05: Proceedings of the 14th international conference on World Wide Web. New York, NY, USA: ACM, 2005, pp. 342–351. 18. A.-M. Popescu and O. Etzioni, “Extracting product features and opinions from reviews,” in HLT ’05: Proceedings of the conference on Human Language Technology and Empirical Methods in Natural Language Processing. Morristown, NJ, USA: Association for Computational Linguistics, 2005, pp. 339–346. 19. C. Scaffidi, K. Bierhoff, E. Chang, M. Felker, H. Ng, and C. Jin, “Red opal: productfeature scoring from reviews,” in EC ’07: Proceedings of the 8th ACM conference on Electronic commerce. New York, NY, USA: ACM, 2007, pp. 182–191. 20. H. Guo, H. Zhu, Z. Guo, X. Zhang, and Z. Su, “Product feature categorization with multilevel latent semantic association,” in CIKM ’09: Proceeding of the 18th ACM conference on Information and knowledge management. New York, NY, USA: ACM, 2009, pp. 1087–1096. 21. M. Schierle and D. Trabold, “Multilingual knowledge based concept recognition in textual data,” in Proceedings of the 32nd Annual Conference of the GfKl, 2008. 22. N. Kano, N. Seraku, F. Takashi, and S. Tsuji, “Attractive quality and must-be quality,” in The Journal of the Japanese Society for Quality Control, vol. 14, no. 2, 1984, pp. 39–48. 23. J. M. Wiebe, R. F. Bruce, and T. P. O’Hara, “Development and use of a goldstandard data set for subjectivity classifications,” in Proceedings of the 37th annual meeting of the Association for Computational Linguistics on Computational Linguistics. Morristown, NJ, USA: Association for Computational Linguistics, 1999, pp. 246–253. 24. V. Hatzivassiloglou and J. M. Wiebe, “Effects of adjective orientation and gradability on sentence subjectivity,” in Proceedings of the 18th conference on Computational linguistics. Morristown, NJ, USA: Association for Computational Linguistics, 2000, pp. 299–305. 25. P. D. Turney, “Thumbs up or thumbs down?: semantic orientation applied to unsupervised classification of reviews,” in ACL ’02: Proceedings of the 40th Annual Meeting on Association for Computational Linguistics. Morristown, NJ, USA: Association for Computational Linguistics, 2002, pp. 417–424. 26. B. Pang, L. Lee, and S. Vaithyanathan, “Thumbs up?: sentiment classification using machine learning techniques,” in EMNLP ’02: Proceedings of the ACL-02 conference on Empirical methods in natural language processing. Morristown, NJ, USA: Association for Computational Linguistics, 2002, pp. 79–86. 27. K. Dave, S. Lawrence, and D. M. Pennock, “Mining the peanut gallery: opinion extraction and semantic classification of product reviews,” in WWW ’03: Proceedings of the 12th international conference on World Wide Web. New York, NY, USA: ACM, 2003, pp. 519–528. 28. R. Remus, U. Quasthoff, and G. Heyer, “SentiWS - a German-language Resource for Sentiment Analysis,” in Proceedings of LREC 2010, 2010. 29. D. Ferrucci and A. Lally, “UIMA: An architectural approach to unstructured information processing in the corporate research environment,” Natural Language Engineering, vol. 10, no. 3/4, pp. 327–348, 2004. 30. D. Ferrucci, “Oasis unstructured information management architecture (uima), version 1.0,” 2008. [Online]. Available: http://www.oasis-open.org/committees/ download.php/28492/uima-spec-wd-05.pdf