while maintaining a short message delivery time. Regarding content search and retrieval services,. Information-Centric Network (ICN) has been drawing.
Socially-Aware Content Retrieval using Random Walks in Disruption Tolerant Networks Tuan Le, Haik Kalantarian, Mario Gerla Dept. of Computer Science, UCLA Los Angeles, USA {tuanle, kalantarian, gerla}@cs.ucla.edu
Abstract—In this paper, we propose a distributed content retrieval scheme for Disruption Tolerant Networks (DTNs). Our scheme consists of two key components: a content discovery (lookup) service and a routing protocol for message delivery. Both components rely on three key social metrics: centrality, social level, and social tie. Centrality guides the placement of the content lookup service. Social level guides the forwarding of content requests to a content lookup service node. Social tie is exploited to deliver content requests to the content provider, and content data to the requester node. We leverage bounded random walks to estimate a node’s centrality. The X-means clustering algorithm is used to compute a node’s social level. Lastly, a node’s social tie is computed based on the frequency and recency of node contacts. Extensive real-trace-driven simulation results show that our scheme requires less control overhead while maintaining comparable performance for content retrieval applications. Keywords—Disruption Tolerant Networks; Content Retrieval; Random Walk; Social Metrics
I. I NTRODUCTION In Disruption Tolerant Networks (DTNs) [1], mobile nodes contact each other opportunistically. Due to unpredictable node mobility, it is difficult to maintain persistent end-to-end connection between nodes. Thus, the store-carry-and-forward method is used for data transfers from source to destination. Node mobility is exploited to relay packets opportunistically upon contacting other nodes. A key challenge in DTN routing is to determine the appropriate relay selection strategy in order to minimize the number of message forwardings among nodes while maintaining a short message delivery time. Regarding content search and retrieval services, Information-Centric Network (ICN) has been drawing increased attention in both academia and industry. In ICN, users do not need to know where the content is stored, but are only interested in what the content is. Each content packet is identified by a unique name, generally drawn from a hierarchical naming scheme. The content retrieval follows the query-reply mode. A content consumer spreads an Interest packet through the network. When matching content is found either at the content provider, or at the intermediate content cache server, the content data will trace its way back to the content consumer using the reverse route of the incoming Interest. Several existing ICN proposals have been studied and implemented in the Internet and Mobile Ad-Hoc Network (MANET) c 978-1-4799-8461-9/15/$31.00 2015 IEEE
testbeds (e.g., CCN [2], NDN [3], Vehicle-NDN [4], and MANET-CCN [5]). However, these are designed for connected real-time networks, and are not suitable for disruption-tolerant mobile ICN networks. In this paper, we propose an ICN architecture for content retrieval in DTNs, called SociallyAware Content Retrieval using random walks (SACR). Given the potentially large size of mobile social networks, one major design challenge of any content retrieval scheme is to locate content providers and deliver requests/contents to target nodes in a reasonable amount of time without flooding the network. Our design is built upon the theoretical properties of random walks and social relationships among DTN nodes. Specifically, we rely on three key social metrics: centrality, social level, and social tie. Centrality guides the placement of the content lookup service. Social level guides the routing of content requests to the content lookup service. Social tie guides the delivery of content requests to the content provider and content data to the requester node. We estimate a node’s centrality using fixed-length random walks. Social level is computed using the X-means clustering algorithm. Finally, social tie is computed based on frequency and recency of node contacts. The paper makes the following contributions: • We design a distributed and lightweight protocol that leverages random walks of bounded length to estimate a node’s centrality. The resulting protocol has low message overhead, and thus is suitable for battery-powered devices such as smartphones. • We propose the use of the X-means clustering algorithm, which can automatically discover the appropriate number of clusters, to build a hierarchical social level based on each node’s centrality. This hierarchy serves to improve the efficiency of the relay strategy. • We develop a distributed content discovery service and a social-tie based routing protocol that support efficient content lookup and content delivery with low overhead. The rest of the paper is organized as follows. Section II reviews the related work. Section III describes the design of the content retrieval scheme in detail. Section IV presents the experimental results. Section V concludes the paper. II. R ELATED W ORK In this section, we review recent developments in ICNs, routing protocols for DTNs, and applications of random walks.
A. Information Centric Networks ICN has attracted much attention from the research community. Recent studies focus on high-level architectures of ICN, and provide sketches of the required components. ContentCentric Network (CCN) [2] and Named Data Network (NDN) [3] are two implemented proposals for the ICN concept in the Internet. Their components, including Forwarding Information Base (FIB), Pending Interest Table (PIT), and Content Store (CS) form the caching and forwarding system for the content data. Several mobile ICN architectures have also been proposed for mobile environments, e.g., Vehicle-NDN [4] for traffic information dissemination, and MANET-CCN [5] for tactical and emergency application. However, all these architectures are designed for connected real-time networks rather than disruption-tolerant mobile ICN networks. B. DTN Routing Protocols Much work has been done regarding network architectures and algorithms for routing and forwarding in DTNs. Research on packet forwarding in DTNs originates from Epidemic routing [6], which floods the entire network. Recent studies develop relay selection techniques to approach the performance of Epidemic routing with lower forwarding cost. In [7], nodes are ranked using weighted social information. Messages are forwarded to the most popular nodes given that popular nodes are more likely to meet other nodes in the network. The explicit friendships are used to build the social relationships based on their personal communications. SimBetTS [8] uses egocentric centrality and social similarity to forward messages toward the node with the highest centrality, to increase the possibility of finding the optimal carrier to the final destination. BubbleRap [9] combines the observed hierarchy of centrality and observed community structure with explicit labels to decide on the best forwarding nodes. In this paper, we present a routing protocol that selects a relay node based on its social-tie strength with the final destination. Social tie is a function of the frequency and recency of node contacts. C. Random Walks In an undirected graph, a random walk is a stochastic process that starts from a given node, and then selects one of its neighbors uniformly at random to visit next. Random walks have been widely used to measure the social centrality metric. For example, Newman [10] introduced the randomwalk betweenness centrality, which is a relaxation of the shortest-path betweenness which assumes that information spreads only along the shortest paths. This measure counts how often a node is traversed by a random walk between all possible node pairs. Noh and Rieger [11] proposed the random-walk closeness centrality, which measures the average speed at which a random walk reaches a node from other nodes in the network. Random walks have also been broadly explored in designing content search protocols and routing protocols. Sarshar [12] introduced a scalable search algorithm that uses random-walks
on random graphs with heavy-tailed degree distributions, to provide access to any content on any node with probability one. Yu et al. [13] proposed SybilGuard, which uses random walks in social networks to mitigate the negative impact of sybil attacks on P2P systems. Unlike the random-walk betweenness metric [10], our work applies bounded-length instead of all-pairs random walks for two reasons. First, in practice, it is difficult for a mobile user to know every other user, and thus specify random-walk destinations. Second, all-pairs random walks may incur much higher message overhead compared to bounded random walks. III. P ROTOCOL D ESIGN Our content retrieval scheme relies on three key social metrics: centrality, social level, and social tie. Centrality guides the placement of the content discovery service. Social level guides the forwarding of content requests to a content discovery service node. Once the content provider ID is discovered, social tie is exploited to deliver content requests to the content provider, and content data to the requester node. In this section, we first describe the computation of these social metrics. We then outline a protocol for nodes to build and exchange social knowledge. After that, we discuss the formation of the distributed content discovery service, and the Interest and Data packet routing protocols. A. Random Walk Protocol for Centrality Estimation Centrality measures the popularity of a mobile node in a social network. Typically, nodes with high centrality tend to interact frequently with many other nodes. The key idea behind the random walk protocol is that if we periodically perform random walks from a small group of mobile nodes, high centrality nodes are likely to be visited by these random walkers more often than average. The proposed protocol works as follows. Each node maintains a random-walk counter, which is initialized to zero, to record how many times it has received random-walk probing packets (i.e., visited by the random walkers). Each node also maintains a local queue to store probing packets. Every T seconds, a node generates a random-walk probing packet with probability q. This packet contains only a pre-configured timeto-live (TTL) field L. The value of L determines the length of the random walks (i.e., the number of nodes visited by the random walker). During contact of a node with its peers, if it has a probing packet in its local queue, it sends this packet to a randomly selected peer. When a node receives a probing packet, it increments the random-walk counter by one, and also decrements L in the packet by one. A probing packet with L = 0 will be discarded. Otherwise, it will be stored in the receiving node’s local queue, waiting for the opportunity to be forwarded to another random peer. Pseudocode 1 outlines the reception of probing packets. However, there is an issue with this random-walk counter update. A node that has a high counter value at time t1 continues to have a high counter value at later time t2 , even though it may not be socially active (i.e., has high centrality)
Pseudocode 1: Handle RW probing packet arrival if packet.type = RW P ROBIN G then rwCounter ← rwCounter + 1 packet.T T L ← packet.T T L − 1 if packet.T T L > 0 then queue.add(packet) else discard(packet)
at t2 . To address this issue, we periodically update the counter by leveraging an exponential moving average. The idea is as follows. Each node maintains two pieces of local information: a running random-walk counter value (RCV), and a current window counter (CWC). RCV represents the node’s past rate of receiving random-walk probing packets as an exponential moving average (i.e., the node’s past centrality status), while CWC is used to obtain information about the number of random-walk probing packets received in the current time interval. RCV is periodically updated to account for the most recent CWC, in which the rate of receiving probing packets was obtained. Updates to RCV are computed as follows: RCV ← α · CW C + (1 − α) · RCV
(1)
This exponential moving average places an emphasis proportional to α on the most recent complete CWC. Updating CWC is straightforward: for every random-walk probing packet received, CWC is incremented by one as shown in Pseudocode 1, where CWC is rwCounter. When the current window update interval has expired, RCV is updated and CWC is reset to zero. Pseudocode 2 outlines the running counter update process, where W represents the current window update interval parameter. Pseudocode 2: Update running RW counter if time ≥ nextU pdate then RCV ← α · CW C + (1 − α) · RCV CW C ← 0 nextU pdate ← time + W
As we can see, if a node is less socially active in the current update interval, it will be less likely to be visited by the random walkers. As a result, RCV decreases proportionally to α when its CWC is close to zero. Thus, RCV correctly reflects the centrality status of a node at different points in time. In our experiments, we set α = 0.75 and W = 60 seconds. In summary, the performance of the random walk protocol relies on three key parameters: T - the frequency that a mobile node generates new random-walk probing packets, q - the probability of generating a probing packet (i.e., the fraction of nodes that initialize random walks), and L - the length of the random walks (i.e., the number of nodes visited by a single random walker). These parameters determine both the quality of estimating node centrality, and the number of probing packets spreading over the network. The choices of these parameters are further elaborated upon in Section IV.
B. Social Level Computation A social level represents a group of nodes that have similar centrality (i.e., similar level of contacts with other nodes in the network). To compute social level, we use the X-means clustering algorithm to group together nodes with similar centrality into the same cluster. X-means can automatically discover the appropriate number of clusters, and runs in linear time and space in low dimensions (up to seven dimensions) [14]. For example, in our experiments, clustering the centrality values (a one-dimensional set of integers) of 10,000 nodes takes less than three seconds on an Intel Core i7 @2.9GHz. C. Social Tie Computation Two nodes are said to have a strong tie if they have met frequently in the recent past. We compute the social tie between two nodes using the history of encounter events. How much each encounter event contributes to the social-tie value is determined by a weighing function F (x), where x is the time span from the encounter event to the current time. Assume that the system time is represented by an integer, and is based on n encounter events of node i. Then, the social-tie value of node i’s relationship with node j at the current time tbase , denoted by Ri (j), is computed as: Ri (j) =
n X
F (tbase − tjk )
(2)
k=1
where F (x) is a weighing function, {tj1 , tj2 , · · · , tjn } are the encounter times when node i met node j, and tj1 < tj2 < · · · < tjn ≤ tbase . As an example, suppose node i met node j at times 1, 3, and 5, and that the current time (tbase ) is 10. Then, node i’s social-tie relationship with node j at tbase , denoted by Ri (j), is computed as: Ri (j) = F (10 − 1) + F (10 − 3) + F (10 − 5) = F (9) + F (7) + F (5) The weighing function F (x) essentially reflects the influence of the recency and frequency of encounter events. In order to give more weight to more recent encounter events, F (x) should be a monotonically non-increasing function. A class of functions that satisfy this condition is F (x) = ( z1 )λx , where z ≥ 2, and 0 ≤ λ ≤ 1. The control parameter λ allows a trade-off between recency and frequency in contributing to the social-tie value. As λ approaches 0, frequency contributes more than recency. On the other hand, as λ approaches 1, recency has higher weight than frequency. The social-tie value is solely determined by frequency when λ = 0, and by recency when λ = 1. Following [15], we set z = 2 and λ = e−4 , which have previously been shown to achieve a good tradeoff between recency and frequency. D. Social Knowledge Formation In order to make an informed forwarding decision, a node needs to obtain network-wide knowledge of social status of other nodes. This knowledge is gained by both local observation and information exchange.
1) Local observation: A node can learn the centrality of an encounter node by recording the random walk counter value that is maintained locally by its encounter. To compute social level, a node runs the X-means clustering algorithm, where the input is the centrality value of the node and its encounters. Finally, a node computes the social-tie strength relationship with its encounter node using the social-tie equation (Equation 2), where the input comes from the history of encounter events between two nodes. Each node maintains two tables: centrality table and socialtie table. Each row in the centrality table has the following format:
to an m-bit vector, using a set of k different hash functions, each of which maps the content name to one of the m bit vector positions. This bit vector represents our content name digest. Bloom filters are very space-efficient, and can be used to carry out content name lookups in O(1) operations. The optimal size of the Bloom Filter depends on two factors: n the expected number of contents owned by a node, and p the allowable false positive probability (the probability that a content is said to belong to a node even though it does not). Based on [16], the number of bits m is computed as:
hencounter -node-id , centrality, timestampi
Note that in (3), we assume that k is optimal, i.e., k = m n ln 2 [16]. In our experiments, we set n = 1, 000 and p = 0.05, which yields a Bloom Filter of size m = 6, 236 bits. The content discovery service is formed as follows. Each node maintains a digest table, where each row has the following format:
Here, timestamp records the time when the random-walk counter value is updated. Each row in the social-tie table has the following format: hpeerX, peerY, social -tie-value, timestampi Here, timestamp is the time at which the social-tie value between peerX and peerY is computed. It is the tbase variable in Equation 2. 2) Knowledge exchange: Nodes, especially low-centrality nodes, tend to have limited knowledge of the social network through local observation (i.e., through direct contacts with other nodes). To gain knowledge of nodes that have never met, during the encounter period, nodes can exchange and merge their local observations. This is achieved by exchanging both the centrality table and social-tie table between two encounter nodes. In the event of a merge conflict (i.e., when there are two entries with the same encounter -node-id in the case of a centrality table, or peerIDs in the case of a social-tie table), we keep the entry with the latest timestamp. Through this process, a node can learn the node centrality and social-tie values between different pairs of nodes in the network. E. Distributed Content Discovery Service A content discovery (lookup) service is the backbone of any content retrieval scheme. In our design, we distribute this service around central nodes (i.e., high-centrality nodes). Note that the set of central nodes can change over time since nodes can become socially active or inactive at different points in time. The intuition behind selecting central nodes is that central nodes tend to meet many other nodes, and thus have better knowledge of which node owns which content in the network. Furthermore, central nodes have low average social distance to other nodes, meaning that, on average, a message (e.g., a content request) can be delivered to central nodes faster than to the other nodes, thus reducing the overall latency of the content retrieval process. One important design issue with the content discovery service is content management. Any scheme that maintains and advertises a plain list of content names is inherently costly and not scalable due to its large size. Instead, we use a compact probabilistic data structure called a Bloom Filter to store the content names. The basic idea is to map a list of content names
m=−
n ln p (ln 2)2
(3)
hcontent-provider -id , content-name-digest, timestampi Here, content-name-digest is a compact representation of content names owned by the provider, and is represented using a Bloom Filter. Initially, this table is populated with a single record, which is the content-name-digest owned by the current node. Each node then actively advertises the digest table to higher centrality nodes. Upon receiving the digest table, a high-centrality node merges it into the local digest table. In the event of a merge conflict (i.e, when there are two entries with the same content-provider -id ), we keep the entry with the latest timestamp. Through this process, central nodes will eventually collect all content name digests from lower centrality nodes, and thus be able to answer different queries regarding the content provider’s identity. F. Interest Packet Forwarding Interest packet forwarding is achieved in two stages: before and after the content provider’s identity is revealed. In the first stage, a requester generates an Interest packet (a content request message), and carries it until it meets a node that has a higher social level than itself. At that point, the requester forwards the Interest packet to the encounter node. In theory, an Interest packet can be forwarded to any highcentrality nodes because they have broad knowledge of content providers. However, nodes with similar centrality tend to have very similar knowledge, and thus there may not be much benefit to forward multiple request replicas to these nodes. To reduce the transmission cost, we cluster nodes into different social levels as in Section III-B. Nodes with similar centrality will be grouped into the same cluster. The Interest packet is only forwarded from a low social-level cluster to a high social-level cluster; there is no Interest forwarding within a cluster. Furthermore, each node keeps track of the last relay node. Extra Interest forwarding is made only when the encounter node has a higher social level than the last relay node. Following this strategy, the Interest packet is forwarded
800
0.7 Epidemic SACR
700
Average delay (sec)
Success ratio
Epidemic SACR 10000
600
0.5 0.4 0.3 0.2
8000
500 400 300
6000
4000 200
0.1 0 100
12000 Epidemic SACR
Total cost
0.6
2000
100
200
300
400
500 600 700 Duration (sec)
800
900 1000 1100
0 100
(a) Success ratio
200
300
400
500 600 700 Duration (sec)
800
900 1000 1100
0 100
200
300
(b) Average delay
400
500 600 700 Duration (sec)
800
900 1000 1100
(c) Total cost
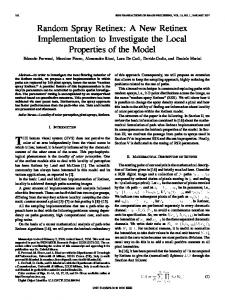
Fig. 1. Performance comparison of content retrieval schemes.
upward, level by level, toward the most popular (central) node in the social-level hierarchy. Since the content name digest is continuously updated and propagated toward higher social-level nodes, if the content is present in the network, the Interest name will eventually match the content name in the digest table of some central node. At that point, the content provider ID is disclosed, and the Interest packet is social-tie routed toward the content provider. Note that in social-tie routing, the packet is forwarded to an encounter node only if the encounter has a higher social tie to the destination node than the current node. G. Data Packet Forwarding Upon receiving an Interest packet, if a node owns the content that matches the request, it will generate a Data packet, and sends it back to the requester using social-tie routing. The content provider only responds once to the same Interest packet that originates from the same requester. Subsequently received duplicate Interest packets are ignored. IV. P ERFORMANCE E VALUATION In this section, we evaluate the performance of the proposed SACR scheme in a packet-level simulation, using a real-world mobility trace. We first describe the simulation setup, followed by the metrics used and the results. A. Simulation Setup We conduct the simulations using the NS-3.19 network simulator. We adopt the IEEE 802.11g wireless channel model and the PHY/MAC parameters as listed in Table I. To gain meaningful results, we use the San Francisco cab mobility trace that consists of 116 nodes and is collected in one hour in the downtown area of 5,700m x 6,600m [17]. Vehicles advertise Hello messages every 100ms. The broadcast range of each vehicle is fixed to 300m, which is typical in a vehicular ad hoc network (VANET) setting. In our simulations, each node owns unique content of the same size (1MB). In addition, each node requests random content in the network. For statistical convergence, we repeat each simulation 20 times. We evaluate SACR against Epidemic. Content retrieval is achieved in Epidemic by having the requester node flood the network with an Interest packet. Upon receiving the Interest
TABLE I. SIMULATION PARAMETERS Parameter RxNoiseFigure TxPowerLevels TxPowerStart/TxPowerEnd m channelStartingFrequency TxGain/RxGain EnergyDetectionThreshold CcaModelThreshold RTSThreshold CWMin CWMax ShortEntryLimit LongEntryLimit SlotTime SIFS
Value 7 1 12.5 dBm 2407 MHz 1.0 -74.5 dBm -77.5 dBm 0B 15 1023 7 7 20 µs 20 µs
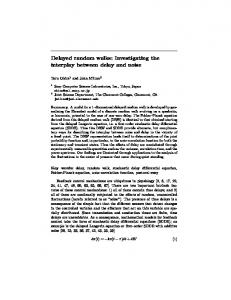
packet, the content owner in return floods the corresponding Data packet. In addition, we also evaluate the performance sensitivity of SACR to different random-walk parameter settings. B. Evaluation Metrics We use the following metrics for evaluation: • Success ratio: the ratio of content queries being satisfied with the requested data. • Average delay: the average interval of time for delivering responses to content queries. • Total cost: the total number of message replicas in the network. This includes both Interest and Data packets. C. Comparative Results Fig. 1 shows the performance of Epidemic and our proposed SACR scheme. Although Epidemic-based content retrieval has a higher success ratio and lower average delay than SACR, it also has a worse cost as a result of its flooding-based approach. D. Effects of Random-Walk Parameters We evaluate the performance of SACR with different lengths L, probabilities q, and frequencies of random walks T . The simulation results are plotted in Fig. 2. Note that each curve is labeled as RW -L-q-T . The figure shows that the success ratio of SACR is improved when increasing the length, probability, or frequency of random walks, at the cost of higher random-walk probing packet overhead. Similar improvements
0.7
0.7 RW−1−0.1−200 RW−5−0.1−200 RW−10−0.1−200
0.6
0.6
0.5
0.4 0.3
0.4 0.3
0.4 0.3
0.2
0.2
0.2
0.1
0.1
0.1
0 100
200
300
400
500 600 700 Duration (sec)
800
0 100
900 1000 1100
RW−1−0.1−200 RW−1−0.1−100 RW−1−0.1−50
0.5 Success ratio
Success ratio
0.5 Success ratio
0.7
RW−1−0.1−200 RW−1−0.2−200 RW−1−0.3−200
0.6
200
300
(a) Varying L
400
500 600 700 Duration (sec)
800
0 100
900 1000 1100
200
300
(b) Varying q
400
500 600 700 Duration (sec)
800
900 1000 1100
(c) Varying T
Fig. 2. Comparison of SACR’s success ratios under different random walk parameters. Each curve is labeled as RW -L-q-T .
500 400 300 200 100
1
5 Random−walk length (L)
10
(a) q = 0.1, T = 200s
Number of random−walk probing packets
Number of random−walk probing packets
Number of random−walk probing packets
600
0
700
700
700
600 500 400 300 200 100 0
0.1
0.2 Random−walk probability (q)
(b) L = 1, T = 200s
0.3
600 500 400 300 200 100 0
200
100 Random−walk frequency (T)
50
(c) q = 0.1, L = 1
Fig. 3. Comparison of the message overhead under different random walk parameters.
are observed (not shown here due to space constraints) and predictable across the delay and cost metrics. These improvements can be primarily attributed to a more accurate centrality estimation. We also evaluate the message overhead of the random walk protocol after 1,100 seconds of the simulation. We plot the results in Fig. 3. Theoretically, the number of random-walk probing packets (C) propagated in the network after D seconds of the simulation can be approximated as: D ·L (4) T where n is the network size, D is the simulation duration, and q, T , and L are random walk parameters. In Subsection IV-C, we set q = 0.3, T = 50s, and L = 10, which yields C ≈ 7, 700. C ≈n·q·
V. C ONCLUSION In this paper, we have proposed a distributed content retrieval scheme for DTNs. Our scheme relies on three key social concepts: centrality, social level, and social tie. Bounded random walks are leveraged to estimate node centrality. The X-means clustering algorithm is used to group nodes with similar centrality into the same social level. Lastly, the social tie is computed based on the frequency and recency of node contacts. We have presented a distributed content discovery service and a routing protocol for efficient content query and delivery. Extensive simulation results show that our scheme achieves comparable performance for content retrieval applications, while requiring less control overhead.
R EFERENCES [1] K. Fall, “A delay-tolerant network architecture for challenged internets,” in Proceedings of the 2003 conference on Applications, technologies, architectures, and protocols for computer communications. ACM, 2003. [2] V. Jacobson et al., “Content-centric networking: Whitepaper describing future assurable global networks,” Response to DARPA RFI SN07-12. [3] L. Zhang et al., “Named data networking (ndn) project,” Relat´orio T´ecnico NDN-0001, Xerox Palo Alto Research Center-PARC, 2010. [4] L. Wang et al., “Rapid traffic information dissemination using named data,” in Workshop on Emerging Mobile Networking, 2012. [5] S.-Y. Oh et al., “Content centric networking in tactical and emergency manets,” in Wireless Days (WD), 2010 IFIP. IEEE, 2010, pp. 1–5. [6] A. Vahdat, D. Becker et al., “Epidemic routing for partially connected ad hoc networks,” Duke University, Tech. Rep., 2000. [7] A. Mtibaa et al., “Peoplerank: Social opportunistic forwarding,” in INFOCOM, 2010 Proceedings IEEE. IEEE, 2010, pp. 1–5. [8] E. M. Daly and M. Haahr, “Social network analysis for information flow in disconnected delay-tolerant manets,” Mobile Computing, 2009. [9] P. Hui et al., “Bubble rap: Social-based forwarding in delay-tolerant networks,” Mobile Computing, 2011. [10] M. E. Newman, “A measure of betweenness centrality based on random walks,” Social networks, vol. 27, no. 1, pp. 39–54, 2005. [11] J. D. Noh and H. Rieger, “Random walks on complex networks,” Physical review letters, vol. 92, no. 11, p. 118701, 2004. [12] N. Sarshar et al., “Percolation search in power law networks: Making unstructured peer-to-peer networks scalable,” in Peer-to-Peer Computing, 2004. Fourth International Conference on. IEEE, 2004, pp. 2–9. [13] H. Yu et al., “Sybilguard: defending against sybil attacks via social networks,” in Computer Communication Review, 2006. [14] D. Pelleg et al., “X-means: Extending k-means with efficient estimation of the number of clusters.” in ICML, 2000, pp. 727–734. [15] D. Lee et al., “Lrfu: A spectrum of policies that subsumes the least recently used and least frequently used policies,” Computers, 2001. [16] A. Kirsch and M. Mitzenmacher, “Less hashing, same performance: Building a better bloom filter,” Random Structures & Algorithms, 2008. [17] J. Lakkakorpi, “ns-3 module for routing and congestion control studies in mobile opportunistic dtns,” in Performance Evaluation of Computer and Telecommunication Systems, 2013 International Symposium on.