Rev Saúde Pública 2016;50:37
Original Article
http://www.rsp.fsp.usp.br/
Socioeconomic and regional differences in active transportation in Brazil Thiago Hérick de SáI, Rafael Henrique Moraes PereiraII,III, Ana Clara DuranIV, Carlos Augusto MonteiroI Núcleo de Pesquisas Epidemiológicas em Nutrição e Saúde. Faculdade de Saúde Pública. Universidade de São Paulo. São Paulo, SP, Brasil II Instituto de Pesquisa Econômica Aplicada. Brasília, DF, Brasil III Transport Studies Unit. University of Oxford. Oxford, OX, UK IV University of Illinois at Chicago. Chicago, IL, USA I
ABSTRACT OBJECTIVE: To present national estimates regarding walking or cycling for commuting in Brazil and in 10 metropolitan regions. METHODS: By using data from the Health section of 2008’s Pesquisa Nacional por Amostra de Domicílio (Brazil’s National Household Sample Survey), we estimated how often employed people walk or cycle to work, disaggregating our results by sex, age range, education level, household monthly income per capita, urban or rural address, metropolitan regions, and macro-regions in Brazil. Furthermore, we estimated the distribution of this same frequency according to quintiles of household monthly income per capita in each metropolitan region of the country. RESULTS: A third of the employed men and women walk or cycle from home to work in Brazil. For both sexes, this share decreases as income and education levels rise, and it is higher among younger individuals, especially among those living in rural areas and in the Northeast region of the country. Depending on the metropolitan region, the practice of active transportation is two to five times more frequent among low-income individuals than among high-income individuals. Correspondence: Thiago Hérick de Sá Departamento de Nutrição – FSP/USP Av. Doutor Arnaldo, 715 Cerqueira Cesar 01246-904 São Paulo, SP, Brasil E-mail:
[email protected] Received: 17 Jan 2015
CONCLUSIONS: Walking or cycling to work in Brazil is most frequent among low-income individuals and the ones living in less economically developed areas. Active transportation evaluation in Brazil provides important information for public health and urban mobility policy-making DESCRIPTORS: Motor Activity. Walking. Transportation. Urban Health. City Planning. Health Inequalities. Healthy City. Metropolitan Zones.
Approved: 15 Feb 2016 How to cite: Sá TH, Pereira RHM, Duran AC, Monteiro CA. Socioeconomic and regional differences in active transportation in Brazil. Rev Saude Publica. 2015;50:37. Copyright: This is an open-access article distributed under the terms of the Creative Commons Attribution License, which permits unrestricted use, distribution, and reproduction in any medium, provided that the original author and source are credited.
DOI:10.1590/S1518-8787.2016050006126
1
Active transportation in Brazil
Sá TH et al.
INTRODUCTION Using active modes of transport in cities, such as walking or cycling, brings benefits to people’s health10,30,31 and to the population – examples include the reduction in pollution and traffic accidents11,23,30,31. Promoting active modes of transportation could also have a positive economic impact, besides the direct impact on health13. The promotion of active transport is greatly favored by the understanding of the frequency and distribution of this practice in specific contexts. The most common active transport modes, such as walking or cycling, are related to individual factors (age, sex, income, education), environmental factors (climate, topography, and built environment), and characteristics that are specific to each itinerary, such as the distance to be covered, the reason for the travel, and its cost2,22. Taken together, these factors help us understand why the proportion of people who use active transport varies across countries1,9, regions or cities12,25, and socioeconomic strata of the population14. Studies suggest that city infrastructures also determine the habits of walking or cycling28, besides promoting higher safety23. Nonetheless, the extent of these effects varies according to income and age14. There is a lack of national estimates on the frequency and distribution of active transport in Brazil. A great deal of the country’s literature is limited to local studies, mainly in the South and Southeast regions29. Disclosing these data may contribute to the planning of policies and programs that consider regional characteristics of active transportation, as well as national strategies to foster these practices across the socioeconomic spectrum. This study aimed to provide national estimates on the frequency and distribution of walking or cycling for commuting in Brazil. METHODS Data Source
This study used data from the Health section of Pesquisa Nacional por Amostra de Domicílio (PNAD – Brazil’s National Household Sample Survey), which was conducted by the Brazilian Institute of Geography and Statistics (IBGE) in 2008a. PNAD is the only annual sample survey with public nationwide data on commuting to worka. Its section on health from 2008 investigated topics related to the population’s health, among which the practice of physical activity in different domains (physical leisure activities, commuting to work, professional activities, and heavy cleaning in the household environment). Sample plan and data collection
Instituto Brasileiro de Geografia e Estatística. Pesquisa Nacional por Amostra de Domicílios 2008: um panorama da saúde no Brasil: acesso e utilização dos serviços, condições de saúde e fatores de risco e proteção à saúde. Rio de Janeiro; 2010 [cited 2016 Feb 26]. Available from: http://www. ibge.gov.br/home/estatistica/ populacao/panorama_saude_ brasil_2003_2008/default.shtm
a
The PNAD sample from 2008 was obtained through complex probability sampling by clusters in two or three stages: municipality, census tract, and household. In the first and second stages, the spatial units (municipality and census tracts, respectively) were selected with replacement and with probability proportional to the population in 2000’s Brazilian Population Censusa. In the third stage, households were randomly selected according to the number of households in each census tract. All the household residents were interviewed or had their information disclosed by other members of their families. Employing appropriate weighting factors, the data from PNAD 2008 allow estimates that are representative of the total Brazilian population, urban or rural populations, and of the populations in macro-regions, states, and metropolitan regions in Brazil. The questionnaire from PNAD 2008 included questions regarding commuting to work by bicycle or on foot and the time spent on commuting. Individuals 13 year old or younger or those with health problems that prevented them from walking approximately 100 meters or shopping for groceries, clothes, or medications without help, were excluded from the survey. DOI:10.1590/S1518-8787.2016050006126
2
Active transportation in Brazil
Sá TH et al.
Study variables and data analysis
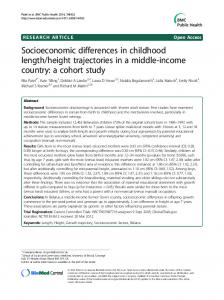
An indicator was created for the practice of active transport to work by calculating the share of employed people aged 14 years or older who walk or cycle to work, regardless of the trip duration. This indicator and its corresponding 95% confidence interval (95%CI) were separately estimated for men and women considering differences by sex previously observed in the Brazilian population7,15. These estimates were calculated by sex considering their age (15-24; 25-34; 35-44; 45-54; 55-64, and ≥ 65 years), education level (1-3; 4-7; 8-10; 11-14, and ≥ 15 years of study), macro-region of residence (North; Northeast; South; Southeast, and Midwest), whether they lived in a macro-region (yes; no), metropolitan region (Belem; Belo Horizonte; Curitiba; Distrito Federal; Fortaleza; Porto Alegre; Recife; Rio de Janeiro; Salvador; and Sao Paulo), urbanicity (rural or urban areas), and household monthly income per capita (in decile groups). Furthermore, for participants living in the nine largest metropolitan regions in Brazil or the Federal District, we estimated the distribution of walking or cycling to work according to the quintiles of household income per capita, calculated for each urban area. The frequency and distribution of people whose active commute lasts 30 minutes or longer – a commonly used indicator in the literature3,7,15,18,27 – are available upon request and on personal storage websites such as Research Gate. The differences observed between groups were considered to be statistically significant when the specific estimate of one of them was not contained in the interval estimate of the other, namely, 95%CI16. The study followed the principles of the Declaration of Helsinki, and was approved by the Research Ethics Committee of the Faculdade de Saúde Pública of the Universidade de São Paulo. The analytical procedures in this study were executed on R statistical package (2.15.3). We used by the survey package in order to consider PNAD 2008’s design and sample weights. RESULTS The Table shows estimates for active transport for men and women by urbanicity, metropolitan region, and macro-region. Around one third of Brazil’s male and female populations actively commute. In the country’s metropolitan regions, this share drops to a little less than 20.0%. The highest shares of active travel were found among those residing in rural areas, whereas the smaller shares were observed in the Northeast and Southeast macro-regions. In general, the share of men and women who use active transport modes to work is similar in all analyzed subgroups, with the exception of those who live in rural areas and in the North macro-region. There, more men and women walk or cycle to work. Figures 1 to 3 show the frequency of active transport to work among men and women by income deciles, education, and age, respectively. The share of people who walk or cycle to work decreases as income and education levels rise for men and women (Figures 1 and 2). However, such reduction is more prominent among men, contributing with our findings that point to more highly educated and high-income women than men actively commuting to work. A higher frequency of active travel to work was observed among teenagers (14 to 19 years of age). Significant differences by sex were only observed among adults who were 55 years or older (Figure 3). Figure 4 shows the share of men and women who walk or cycle to work by quintiles of household monthly income per capita in the 10 metropolitan regions. In all urban areas, the quintile of the population with the lowest income was found to have higher active transport levels (between two and five times higher) than the wealthiest portion of the study population. Nonetheless, the differences between groups at the extremes of the income distribution DOI:10.1590/S1518-8787.2016050006126
3
Active transportation in Brazil
Sá TH et al.
Table. Share of the population of 14 years of age or older who walk or cycle to work, according to sociodemographic variables. Brazil, 2008. Men Sociodemographic characteristic n (thousands) % 95%CI Household status Rural* 5,271 53,4 50,8–55,9 Urban* 12,055 29,5 29,0–30,1 Metropolitan region No 14,556 40,4 39,4–41,3 Yes 2,769 18,9 18,3–19,6 Macro-region Midwest* 774 24,2 22,7–25,7 Northeast* 6,365 46,9 45,2–48,5 North* 1,644 39,5 35,9–43,2 Southeast* 5,669 26,7 26,0–27,5 South* 2,648 33,8 32,0–35,6 Total 17,325,1 34,2 33,5–34,9 * Significant differences between men and women,
Women n (thousands) %
95%CI
2,666 9,692
45,2 31,0
42,7–47,9 30,4–31,7
10,178 2,181
40,0 18,7
39,1–40,9 18,0–19,4
615 3,859 922 4,505 2,291 12,358,5
26,5 40,5 35,8 28,1 37,2 33,3
25,0–28,1 39,0–42,0 33,4–38,3 27,1–29,2 35,5–38,9 32,6–34,0
70.0% 60.0% 50.0% 40.0% 30.0% 20.0% 10.0% 0% 1st
2nd
3rd Men
4th
5th
6th
7th
9th 8th Women
10th
Source: PNAD (IBGE). * Household monthly income per capita deciles. Figure 1. Frequency (%) of people walking or cycling to work among men and women and according to income deciles*. Brazil, 2008. 70.0% 60.0% 50.0% 40.0% 30.0% 20.0% 10.0% 0%
Less than 1 year
1-3 years Men
4-7 years
8-10 years
11-14 years Women
15 years or more
Source: PNAD (IBGE). Figure 2. Frequency (%) of people walking or cycling to work among men and women and according to years of study. Brazil, 2008. DOI:10.1590/S1518-8787.2016050006126
4
Active transportation in Brazil
Sá TH et al.
varied considerably between men and women and across metropolitan regions. The largest differences were observed in the male population residing in metropolitan regions located in Brazil’s North and Northeast regions. The smallest frequency of men and women who walk or cycle to work was found in the Federal District, for both the wealthiest (Q5) and the poorest portions of the sample (Q1). The Federal District had the smallest difference by income level in the country (Figure 4).
70.0% 60.0% 50.0% 40.0% 30.0% 20.0% 10.0% 0%
15-24
25-34
35-44
45-54
55-64
Men
65+
Women
Source: PNAD (IBGE). Figure 3. Frequency (%) of people walking or cycling to work among men and women and according to age ranges. Brazil, 2008. 0%
(A) Men
10.0%
20.0%
30.0%
40.0%
50.0%
0%
(B) Women
Fortaleza
Fortaleza
Recife
Recife
Belem
Belem
Salvador
Salvador
Curitiba
Curitiba
Belo Horizonte
Belo Horizonte
Porto Alegre
Porto Alegre
10.0%
20.0%
30.0%
40.0%
50.0%
MR
MR Rio de Janeiro
Rio de Janeiro
Sao Paulo
Sao Paulo
Distrito Federal
Distrito Federal Wealthiest quintile
Average
Poorest quintile
Source: PNAD (IBGE). MR: Metropolitan regions * Household monthly income per capita deciles. Figure 4. Share of employed men (A) and women (B) who walk or cycle to work, according to income quintiles. Brazilian metropolitan regions, 2008. DOI:10.1590/S1518-8787.2016050006126
5
Active transportation in Brazil
Sá TH et al.
DISCUSSION Socioeconomic and regional differences were found in active transport to work in Brazil, and it was observed to be the most common practice among low-income individuals and in the least economically developed areas (rural area; non-metropolitan regions; North and Northeast macro-regions; and metropolitan regions of Belem, Recife, and Fortaleza). The inverse association of income and active transport was also found in other Brazilian6,7,25,27,b and international studies2. The results of this study show one rare example of health inequalities that favor lower-income individuals. The inverse relationship between the practice of active travel and people’s income levels possibly reflects budget constraints of low-income families, the gentrification in Brazilian cities, and poor public transportation conditions. Not necessarily a practice that is motivated by socioenvironmental and health benefits6,26,c,d. Spatial segregation, coupled with an inefficient public transportation system, contributes to increase longer distances covered on foot or by bicycle as it increases the time it takes people to access the public transportation system and its connectionsd.
b Companhia do Metropolitano de São Paulo. Pesquisa Origem e Destino 2007: Região Metropolitana de São Paulo: síntese das informações da pesquisa domiciliar. São Paulo: Diretoria de Planejamento e Expansão dos Transportes Metropolitanos; 2008 [cited 2016 Feb 26]. Available from: http://www. OD2007/sintese_ od2007.pdf metro.sp.gov.br/ metro/arquivos/
Institutos Nacionais de Ciência e Tecnologia, Observatório das Metrópoles. Evolução da frota de automóveis e motos no Brasil 2001 – 2012 (relatório 20213). Rio de Janeiro; 2013 [cited 2016 Feb 26]. Available from: http://www. observatoriodasmetropoles.net/ download/auto_motos2013.pdf
c
d ONU Hábitat –Programa de las Naciones Unidas para los Asentamientos Humanos. Estado de las ciudades de América Latina y el Caribe 2012: rumbo a una nueva transición urbana. Kenia; 2012 [cited 2016 Feb 26]. Available from: http://www.onuhabitat. org/index.php?option=com_ docman&task=doc_ view&gid=8 16&tmpl=component&format=ra w&Itemid=538 e Associação Brasileira dos Fabricantes de Motocicletas, Ciclomotores, Motonetas, Bicicletas e Similares. Anuário da Indústria Brasileira de Motociclos. São Paulo (SP): ABRACICLO; 2011.
When we compare Brazil’s 10 metropolitan regions, we identify little variation in the frequency of active transport among the 20.0% wealthiest people in the population (with the exception of the Federal District). On the other hand, among individuals in the first quintile of household income, a higher prevalence of active commuting was found in the least economically developed metropolitan regions, where transportation systems deteriorated worse over the last decades, such as Belem, Fortaleza, and Recife21. Considering the maintenance of the current spatial structure of cities and transportation systems, along with rising income and purchasing power conditions of low-income individuals in Brazil19, levels of walking or cycling to work are expected to decrease and get closer to the homogeneously low level observed among high-income individuals. Comparing Brazil’s Federal District to other metropolitan regions, the smaller share of active transport both among the wealthiest and the poorest individuals reflects Brasilia’s unique urban planning – which is largely car-oriented - and the long distances a great deal of the population need to cover between the satellite cities and Brazilian capital, where most of the jobs are located17. Another reason that leads us to believe in the worsening of the indicator is the expansion of household car ownershipe. The rising income in Brazil from 2004-2014 was accompanied by an increase that is more than proportional in transportation expenditures, especially among low-income individualse. Furthermore, despite this substantial growth in motorization rates, which took place in North and Northeast large cities, these rates still correspond to half of those observed for other Brazilian metropolitan regions21. Although time series with nationally representative information on active transport in Brazil are unavailable, a documented reduction in Brazilian major cities has been reported18. A similar situation can be observed in rural areas, especially due to the increasing sales of motorcycles17,19. Despite the lack of detailed information on the evolution of motorized trips in rural areas, the highest fleet growth between 2001 and 2012 was observed in municipalities of up to 20,000 inhabitants (an approximate 400.0% increase), which was higher that the growth rate observed for automobiles (143.0%)c. However, mobility policies that focus on improving and integrating several modes of transport may help increase the rates of active commute already shown in other contexts3,5,8. Approximately a third of men and women actively commute to work in Brazil, similar to European countries such as France (34.9%) and Holland (37.9%), and below the rates found in China (46.1%)9. Active transportation was more prevalent among men only in a few metropolitan regions (Recife, Belem, and Fortaleza), in rural areas, and among the oldest (55 years of age or older); and it is more frequent among women in the highest income and education level strata. Issues regarding the adoption of healthier habits and differences concerning the ownership of vehicles inside one’s household may be driving gender-related DOI:10.1590/S1518-8787.2016050006126
6
Active transportation in Brazil
Sá TH et al.
differences4. Such differences may also contribute to explain the slower increase in obesity rates among women of higher education levels as compared to equally educated men20. More detailed studies on the relationships between household chores, out-of-home activities, and gender roles in the determination of the practice of walking or cycling to and from work in Brazil are required to confirm these hypotheses. This study has some limitations. They include the impossibility of including walking or cycling for other reasons other than work. Nevertheless, commuting for work accounts for approximately 45.0% of all trips in Brazilian metropolitan regionsf. Additionally, PNAD’s data do not allow us to evaluate walking and cycling separately or to explore covered distances, nor to which extent these practices vary within the same city. These issues would be extremely relevant for impact evaluation of public policies that seek to increase the share of non-motorized transportation modes. This is, however, one of the first studies that used PNAD’s new weighting factors, which allowed us to estimate walking or cycling to work for the entire country, besides describing differences in such practice by socioeconomic and geographic variables. Recent socioeconomic changes that took place in Brazil influenced the population’s access to automobiles and motorcycles. However, the access to public services ( for example, public transportation) did not occur at the same rate. Our study contributes to the understanding of health inequalities in Brazil and brings elements to urban mobility policy-making that focus on the integration of transport modes and on increasing the share of non-motorized trips considering socioeconomic and regional differences. The practice of active commuting has marked regional and socioeconomic differences in Brazil. Current national and regional policies, such as Brazil’s National Urban Mobility Policyg and city-level Master plans should consider our findings in shaping active commuting levels across the country. Finally, policy makers must ensure that low-income individuals are not affected by a necessary migration to motorized transport modes by reducing distances of daily commute as well as improving their access to adequate dedicated infrastructure for walking and bicycling, and to public transportation. REFERENCES 1. Bassett DR Jr, Pucher J, Buehler R, Thompson DL, Crouter SE. Walking, cycling, and obesity rates in Europe, North America, and Australia. J Phys Act Health. 2008;5(6):795-814. Corporación Andina de Fomento. Desarrollo urbano y movilidad en América Latina. Ciudad de Panamá: CAF Observatorio de la Movilidad Urbana; 2011 [cited 2016 Feb 27]. Available from: http:// www.caf.com/media/4203/ desarrollourbano_y_movilidad_ americalatina.pdf
f
Brasil. Lei no 12.587, de 3 de janeiro de 2012. Institui as diretrizes da Política Nacional de Mobilidade Urbana; revoga dispositivos dos Decretos-Leis nºs 3.326, de 3 de junho de 1941, e 5.405, de 13 de abril de 1943, da Consolidação das Leis do Trabalho (CLT), aprovada pelo Decreto-Lei nº 5.452, de 1º de maio de 1943, e das Leis nºs 5.917, de 10 de setembro de 1973, e 6.261, de 14 de novembro de 1975; e dá outras providências. Diario Oficial Uniao. 4 jan 2012; Seção 1: 1. g
2. Bauman AE, Reis RS, Sallis JF, Wells JC, Loos RJF, Martin BW, et al. Correlates of physical activity: why are some people physically active and others not? Lancet. 2012;380(9838):258-71. DOI:10.1016/S0140-6736(12)60735-1 3. Cervero R, Sarmiento OL, Jacoby E, Gomez LF, Neiman A. Influences of built environment on walking and cycling: lessons from Bogotá. Int J Sustain Transport. 2009;3(4):203-26. DOI:10.1080/15568310802178314 4. Crane R. Is there a quiet revolution in women’s travel? Revisiting the gender gap in commuting. J Am Plan Assoc. 2007;73(3):298-316. DOI:10.1080/01944360708977979. 5. Edwards RD. Public transit, obesity, and medical costs: assessing the magnitudes. Prev Med. 2008;46(1):14-21. DOI:10.1016/j.ypmed.2007.10.004 6. Florindo AA, Guimarães VV, Cesar CLG, Barros MBA, Alves MCGP, Goldbaum M. Epidemiology of leisure, transportation, occupational, and household physical activity: prevalence and associated factors. J Phys Act Health. 2009;6(5):625-32. 7. Florindo AA, Hallal PC, Moura EC, Malta DC. Prática de atividades físicas e fatores associados em adultos, Brasil, 2006. Rev Saude Publica. 2009;43 Suppl 2:65-73. DOI:10.1590/S0034-89102009000900009 8. Gómez LF, Sarmiento OL, Parra DC, Schmid TL, Pratt M, Jacoby E, et al. Characteristics of the built environment associated with leisure-time physical activity among adults in Bogotá, Colombia: a multilevel study. J Phys Act Health. 2010;7 Suppl 2:S196-203. DOI:10.1590/S1518-8787.2016050006126
7
Active transportation in Brazil
Sá TH et al.
9. Hallal PC, Andersen LB, Bull FC, Guthold R, Haskell W, Ekelund U. Global physical activity levels: surveillance progress, pitfalls, and prospects. Lancet. 2012;380(9838):247-57. DOI:10.1016/S0140-6736(12)60646-1 10. Hamer M, Chida Y. Active commuting and cardiovascular risk: a meta-analytic review. Prev Med. 2008;46(1):9-13. DOI:10.1016/j.ypmed.2007.03.006 11. Hartog JJ, Boogaard H, Nijland H, Hoek G. Do the health benefits of cycling outweigh the risks? Environ Health Perspect. 2010;118(8):1109-16. 12. Hirsch JA, Diez Roux AV, Rodriguez DA, Brines SJ, Moore KA. Discrete land uses and transportation walking in two U.S. cities: the Multi-Ethnic Study of Atherosclerosis. Health Place. 2013;24:196-202. DOI:10.1016/j.healthplace.2013.09.007DOI:10.1289/ehp.0901747 13. Jarrett J, Woodcock J, Griffiths UK, Chalabi Z, Edwards P, Roberts I, et al. Effect of increasing active travel in urban England and Wales on costs to the National Health Service. Lancet. 2012;379(9832):2198-205. DOI:10.1016/S0140-6736(12)60766-1 14. Kerr J, Frank L, Sallis JF, Chapman J. Urban form correlates of pedestrian travel in youth: differences by gender, race-ethnicity and household attributes. Transport Res D Transp Environ. 2007;12(3):177-82. DOI:10.1016/j.trd.2007.01.006 15. Knuth AG, Malta DC, Dumith SC, Pereira CA, Morais Neto OL, Temporão JG, et al. Prática de atividade física e sedentarismo em brasileiros: resultados da Pesquisa Nacional por Amostra de Domicílios (PNAD) 2008. Cienc Saude Coletiva. 2011;16(9):3697-705. DOI:10.1590/S1413-81232011001000007 16. Krzywinski M, Altman N. Points of significance: error bars. Nat Methods. 2013;10(10):921-2. DOI:10.1038/nmeth.2659 17. Martins AAC, Lima Neto VC. Dependência do automóvel, o planejamento regional e Brasília. Universitas Arquitet Comum Soc. 2013;10(1):23-34. DOI:10.5102/uc.v10i1.1982 18. Mielke GI, Hallal PC, Malta DC, Lee IM. Time trends of physical activity and television viewing time in Brazil: 2006-2012. Int J Behav Nutr Phys Act. 2014;11:101. DOI:10.1186/s12966-014-0101-4 19. Morais MP, Carvalho CH, Rego PA. Condições de moradia, saneamento básico e mobilidade urbana no Brasil: evidências a partir da PNAD 2009. In: Castro JA, Araújo HE, organizadores. Situação social brasileira: monitoramento das condições de vida 2. Brasília (DF): Instituto de Pesquisas Econômicas Aplicadas; 2012. p.139-59. 20. Moura EC, Claro RM. Estimates of obesity trends in Brazil, 2006-2009. Int J Public Health. 2012;57(1):127-33. DOI:10.1007/s00038-011-0262-8 21. Pereira RHM, Schwanen T. Commute time in Brazil (1992-2009): differences between metropolitan areas, by income levels and gender. Brasília (DF): IPEA; 2013. p.1-29. (Discussion Paper, 192). 22. Pinjari AR, Pendyala RM, Bhat CR, Waddell PA. Modeling the choice continuum: an integrated model of residential location, auto ownership, bicycle ownership, and commute tour mode choice decisions. Transportation. 2011;38(6):933-58. DOI:10.1007/s11116-011-9360-y 23. Pucher J, Dijkstra L. Promoting safe walking and cycling to improve public health: lessons from The Netherlands and Germany. Am J Public Health. 2003;93(9):1509-16. DOI:10.2105/AJPH.93.9.1509 24. Pucher J, Dill J, Handy S. Infrastructure, programs, and policies to increase bicycling: an international review. Prev Med. 2010;50 Suppl 1:S106-25. DOI:10.1016/j.ypmed.2009.07.028 25. Reis RS, Hino AAF, Parra DC, Hallal PC, Brownson RC. Bicycling and walking for transportation in three Brazilian cities. Am J Prev Med. 2013;44(2):e9-e17. DOI:10.1016/j.amepre.2012.10.014 26. Rydin Y, Bleahu A, Davies M, Dávila JD, Friel S, De Grandis G, et al. Shaping cities for health: complexity and the planning of urban environments in the 21st century. Lancet. 2012;379(9831):2079-108. DOI:10.1016/S0140-6736(12)60435-8 27. Sá TH, Salvador EP, Florindo AA. Factors associated with physical inactivity in transportation in Brazilian adults living in a low socioeconomic area. J Phys Activ Health. 2013;10(6):856-62. 28. Saelens BE, Sallis JF, Frank LD. Environmental correlates of walking and cycling: findings from the transportation, urban design, and planning literatures. Ann Behav Med. 2003;25(2):80-91. DOI:10.1207/S15324796ABM2502_03 DOI:10.1590/S1518-8787.2016050006126
8
Active transportation in Brazil
Sá TH et al.
29. Santos CM, Barbosa JMV, Cheng LA, Wanderley Júnior RS, Barros MVG. Atividade física no contexto dos deslocamentos: revisão sistemática dos estudos epidemiológicos realizados no Brasil. Rev Bras Ativ Fis Saude. 2009;14(1):15-22. 30. Saunders LE, Green JM, Petticrew MP, Steinbach R, Roberts H. What are the health benefits of active travel? A systematic review of trials and cohort studies. PLoS One. 2013;8(8):e69912. DOI:10.1371/journal.pone.0069912 31. Shephard RJ. Is active commuting the answer to population health? Sports Med. 2008;38(9):751-8. DOI:10.2165/00007256-200838090-00004
Funding: Fundação de Amparo à Pesquisa do Estado de São Paulo (FAPESP – Process 2012/08565-4 – THS’ PhD research grant). Authors’ Contribution: Analysis of data: RHMP. Interpretation of results: THS, RHMP, ACD, CAM. Drafting of the manuscript: THS, RHMP, ACD. Critical review of the manuscript: CAM. All authors approved the final draft of the article. Conflict of Interest: The authors declare no conflict of interest. DOI:10.1590/S1518-8787.2016050006126
9