SCIENCE: Soft Computing based Image ENhancement for Contrast Enhancement Kumud Saxena
Avinash Pokhriyal
Sushma Lehri
Assistant Professor RBSMTC, Agra
Associate Professor RBSMTC, Agra
[email protected]
[email protected]
Ex-Director, IET, Dr. B. R. Ambedkar University, Agra
[email protected]
ABSTRACT Image enhancement is an essential task to be performed for image recognition. An image needs to be pre-processed for getting the best possible outcome for further image analysis. In this paper we have propose a block processing based two-step fuzzy method for image contrast enhancement. The method enhances the input image by dividing the input image into blocks, and then apply a two-step enhancement method – first each block ‘s fuzzy histogram is computed and dynamically equalized, and then that block is fuzzified with a new membership function and pixel’s intensity is modified to get a finally enhanced block after defuzzification. After twostep fuzzy process is applied to each block, all the enhanced blocks are rearranged to obtain the final enhanced image. The experimental results show that the proposed soft computing based enhancement method gives better results as compared to other state of the art enhancement methods. Keywords- Image enhancement, Soft computing, HE, CLAHE, Fuzzy sets, Membership function, Contrast enhancement, MSE, PSNR, RMSE
1.
INTRODUCTION
The images acquired from digital media are poor in contrast and image enhancement is a basic task of image processing to fine tune digital images and make them more suitable for human vision or for further analysis. This may be achieved by transforming the image gray levels in such a way that the dark pixels appear darker and light pixels appear lighter. Such a transform increases the differences in gray level intensity and thus enables our vision system to recognize these differences. A digital image is an ordered array of pixels, each characterized by a gray level. Contrast within an image is measure of difference between the gray-levels in the image. The greater the contrast, the greater is the distinction between graylevels in the image. Images of high contrast have either all black or all white regions; there is very
little similar gray-levels in the image, and very few black or white regions. High-contrast images can be thought of as crisp, and low contrast ones as completely fuzzy. Images with good gradation of grays between black and white are usually the best images for purposes of recognition by humans. Several techniques have been applied to improve the contrast enhancement in an image. Some of them have been discussed here for comparing the results with the new proposed technique. Some image processing problems are fuzzy in nature. Whether a pixel should be darker than its current state, where is the boundary between two image segments, what a particular object is in a scene analysis problem, and other similar questions are examples for situations that a fuzzy approach can be the more suitable way to manage the imperfection. In recent years, fuzzy-set theory has been applied to image processing [1] to enhance low contrast images and obtain the images with good visual quality. In [2], we proposed a novel hybrid technique – IEHFS, for removing noise from an image and it gave better results as compared with other conventional filters. In this paper, we introduce a blockwise two-step fuzzy enhancement method – SCIENCE (Soft Computing based Image ENhancement for Contrast Enhancement), and analyze its results by comparing it to other image enhancement methods. The rest of the paper is divided as follows: Section 2 discusses histogram-based and fuzzybased contrast enhancement techniques. Section 3 discusses some drawbacks of conventional histogram based methods like histogram equalisation, and other histogram-based image enhancement methods and Fuzzy image based contrast enhancement methods. Section 4 discusses the proposed enhancement method – SCIENCE (Soft Computing based Image ENhancement for Contrast Enhancement), which uses two-step fuzzy image enhancement. Section 5 compares the proposed method with other compatible enhancement methods. Finally, section 6 gives the conclusion drawn from the results.
2. IMAGE CONTRAST ENHANCEMENT TECHNIQUES 2.1 Histogram Equalization (HE) based Image Enhancement HE generates a gray map which changes the histogram of an image and redistributes all pixel values to be as close as possible to a user specified desired histogram, so that they are evenly distributed across their range. HE allows for areas of lower local contrast to gain a higher contrast. HE automatically determines a transformation function seeking to produce an output image with a uniform histogram. Through this adjustment the intensities can be better distributed on the histogram. HE accomplishes this by effectively speaking out the most frequent intensity values. HE automatically determines a transformation function seeking to produce an output image with a uniform histogram. Let X={X(i,j)} denotes a image composed of L discrete gray levels X= { 0, 1,…….., 1}. For a given Image X, the probability density function ( k). ( k)= / where =0,1,…… 1, represents the number of times that the level k appears in the input image X, is the total number of samples in the input image, and ( k) is associated with the histogram of the input image which represents the number of pixels that have a specific intensity . Based on the probability density function ,the cumulative density function is defined as ( )=
( )
Where, = for k=0,1,.......L-1 and ( definition.
1)
=1 by
HE is a scheme that maps the input image into the entire dynamic range,( 0, 1) by using the cumulative density function as a transform function. A transform function f(x) based on the cumulative density function defined as : ( )= 0+(
1
0)
( )
Then the output image of the HE, Y={Y(i,j)} can be expressed as = ( ) = {( ( , )/ ( , ) }. Based on information theory, entropy of message source will get the maximum value when the message has uniform distribution property. An example of histogram equalization of color image is shown in figure 1.
(a) (b) Figure1: (a) Original image (b) HE of the image Though simple to implement, faster in execution and usually good in performance for variety of images, the histogram equalization introduces major changes in the image gray level when the spread of the histogram is not significant. Also, it cannot preserve the overall imagebrightness which is critical to medical, surveillance and consumer electronics applications. CLAHE[4] works on small image tiles, each tile's contrast is enhanced and the histogram of the output region approximately matches the histogram specified by a distribution (Gaussian, Rayleigh, Poisson, etc.). The neighbouring tiles are combined using bilinear interpolation to eliminate artificially induced boundaries. The contrast, especially in homogeneous areas, can be limited to avoid amplifying any noise[5]. This method is prone to create artifacts. The unreliability of this method make it unsuitable for the research objectives. Bi-histogram equalisation method[6] partitions histogram in two sub-histograms and equalize them independently. The method minimizes mean intensity change. Image parameters selected grayscale threshold (eg median gray level, mean gray level etc.) is used for partitioning. Though this method can perform good contrast enhancement, it also cause more annoying side effects depending on the variation of gray level distribution in the histogram [7].Multi-histogram equalisation method[8] is an extension of bihistogram equalization, where the histogram is partitioned into multiple sub-histograms and then each sub-histogram is equalized independently. This method improves the mean image brightness preserving capability. Histogram features such as local peak or valley points act as markers for partitioning of the histogram.
2.2 Fuzzy based Image Enhancement Fuzzy sets are sets whose elements have degrees of membership[3]. In classical set theory, the membership of elements either belongs or does not belong to the set. The fuzzy set theory, however permits the gradual assessment of the membership of elements in a set, and can be used in a wide range of domains in which information is incomplete or imprecise.
membership value or function. Thus a fuzzy image can be represented as:
Fuzzy sets theory has been applied to image processing in recent years to get high-quality results. Pal and King proposed an algorithm which enhanced the image contrast based on fuzzy sets theory and it has been applied to many applications in image processing [9]. We discuss here the Pal & King’s fuzzy image enhancement method.
= where, . The membership function of the gray value essentially reflects the membership or belongingness of the pixel to a certain class.
Conventionally an image X of size x is represented as a 2-D matrix where the pixel at location ( , ) , = 0 ,. .. , 1, = 0, . . . , , is represented as . Thus for an n-bit gray scale image can take values from 0 to L - 1, where = 2 and mathematically
Define the membership function: For an image whose gray level at location (m, n) is given by , the membership function is defined as = (
=
)= 1+
x
F
x
(2.1)
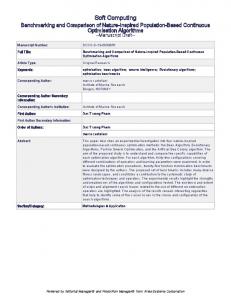
where x is the maximum gray level available in the image and F , F are denominational and exponential fuzzifiers respectively [1]. These two parameters have the effect of altering the ambiguity of membership function. Fig 2.1 shows the relationship between and .
Definition of a fuzzy image includes the gray value along with a membership value associated with it. This membership value , represents the extent to which a pixel at location (m ,n) belongs to a class, having a specific attribute. Thus in fuzzy set theory, an image X of size M x N having L levels of gray can be considered as an array of fuzzy singletons, each associated with a
Membership function
mn
1.2 1 0.8 0.6
Fe=1.5
0.4
Fe=2 Fe=2.5
0.2 0 0
50
100
150
200
250
300
Gray value xmn Figure 2.1: Relationship between x ) 1 when Eq. 2.1 shows that as ( x = x , i.e., the highest gray level represents maximum brightness. The membership function, as in Eq. 2.1, represents the degree of brightness of a particular pixel. It may be noted that the membership value always occurs within a range defined by [ , l]. The minimum gray level that a pixel can assume is 0, which yields the lower limit of a. Thus is obtained as = 1+
x F
( 2.2)
and
(F = 40, x
= 255)
Modify the membership values: A well-chosen intensifier operator stretches the contrast in an image. It transforms membership values above 0.5 to higher or lower values. Intensifier operation becomes increasingly nonlinear as the membership values moves away from 0.5 to still higher values and those below 0.5 to still lower values. If we define this intensifier operator as T1, we can define T1 for the membership values of brightness for an image as,
=
(
2
)=
2(1
, ,
)
The graphical effect of this recursive transformation for a typical membership function is shown in figure 2.2 below. The increase in successive applications of the transformation, the curve gets steeper. As i approaches infinity, the shape approaches a crisp function. The parameter i allows the user to use an appropriate level of enhancement for domain-specific situations.
0.5 1
0.5