Nutrients 2009, 1, 316-328; doi:10.3390/nu1020316 OPEN ACCESS
nutrients ISSN 2072-6643 www.mdpi.com/journal/nutrients Article
Soft Fruit Traceability in Food Matrices using Real-Time PCR Luisa Palmieri *, Elisa Bozza and Lara Giongo Fondazione Edmund Mach, IASMA Research and Innovation Centre, Genomics and Crop Biology Area, Via E. Mach 1, 38010, San Michele all’Adige (TN), Italy; E-Mails:
[email protected] (E.B.);
[email protected] (L.G.) * Author to whom correspondence should be addressed: E-Mail:
[email protected]. Received: 9 October 2009 / Accepted: 15 December 2009 / Published: 23 December 2009
Abstract: Food product authentication provides a means of monitoring and identifying products for consumer protection and regulatory compliance. There is a scarcity of analytical methods for confirming the identity of fruit pulp in products containing Soft Fruit. In the present work we have developed a very sensible qualitative and quantitative method to determine the presence of berry DNAs in different food matrices. To our knowledge, this is the first study that shows the applicability, to Soft Fruit traceability, of melting curve analysis and multiplexed fluorescent probes, in a Real-Time PCR platform. This methodology aims to protect the consumer from label misrepresentation. Keywords: soft fruit; traceability; real-time PCR; strawberry; blueberry; currant; raspberry; orange; pineapple
1. Introduction It is well known that soft fruit species contain numerous bioactive compounds that are beneficial to human health and well-being and may reduce the risk of disease by beneficially targeting body functions [1]. For this reason, these fruits can be used in varying proportions as ingredients in so-called Functional Foods [2]. Consumers are frequently attracted by the beneficial effects described on the label of such foods, therefore labels can be an important educational tool in helping consumers to make healthy food choices. Food labeling and traceability are regulated by EU directive 2000/13/EC, and subsequent
Nutrients 2009, 1
317
amendments [3], and EU regulation 178/2002 [4], respectively. However, in some cases there is either accidental or fraudulent substitution [5]. Substitution represents not only an attempt to deceive the consumer but may also go hand in hand with dangerous practices [6]. Furthermore, there are increasing concerns regarding the presence of allergens in food products [7]. The ability to detect misrepresentation and deliberate adulteration is therefore essential for protecting the consumer. Several modern analytical techniques are able to determine the plant or animal species present in a given food product [8-10]. In particular, techniques based on DNA analysis have become routine in the need to identify raw food materials [11] and could complement the chemical pool of methods that are frequently ineffective in processed food products due to the complex nature of the food matrices. Moreover, DNA is more resistant to food processing then chemical and biochemical compounds [12]. The pulps of soft fruits are widespread and essential ingredients in juices, jams, baby foods, snacks and yogurts. In the majority of these products the percentage of fruit they contain is declared. The widening market of these products has led to speculation that they may contain artificial aromas and be adulterated and mislabeled. At the moment, there is a scarcity of methods for confirming the identity of berry pulps in products containing fruit. These methods are based on HPLC [13], SPME-CG [14] and UPLC-MS/MS [15] chemical analyses or they are molecular-genetic procedures based on PCR and sequencing techniques, such as CAPS (Cleavable Amplifiable Polymorphic Sites) and Pyrosequencing® analyses [16]. However, these types of analysis are problematic for various reasons. Firstly, there are problems with the chemical methodologies employed in the product’s manufacturing system and storage. The CAPS approach is also problematic as it is based on mitochondrial DNA analysis, which in plants is heterogeneous and poorly characterized, while Pyrosequencing® is based on the analysis of SNPs on rbcL (ribulose biphosphate carboxylase large subunit) sequences and these being chloroplast genes the copy number varies in different tissues and different species [17]. The selection of appropriate target sequences is, therefore, important for successful quantitative analysis. The 5S DNA sequence is a suitable alternative plant sequence as it is present in a high copy number. The 5S rRNA gene sequence is highly conserved between plant species while the spacer is speciesspecific; the sequence has been used for phylogenetic studies [18], species identification [19] and also in a traceability study [20]. In real-time PCR, using primer pairs developed from the 5S rRNA sequence [21] and on ANS (anthocyanidin synthase) sequences [22] we can discriminate between five different berry genera and species and between these fruits and other fruit species mixed together in different types of fruit-based food products. In addition, we obtained new sequences for some of the fruit species analyzed and these were used to design new primers and fluorescent probes which were useful for quantitative analysis. 2. Results and Discussion The DNA of raspberry, blueberry, blackberry, redcurrant and strawberry as well as other fruits was extracted using a commercial kit from nine “home made” juices, from 14 juice mixes (30/70%, 50/50%, 70/30%) and from 14 commercial food products. The amounts of total DNA obtained ranged between 0.003 and 1.4 μg for juices, and between 0.005 and 0.182 μg for food products (Table 1).
Nutrients 2009, 1
318 Table 1. Sample list and quantity of DNA extracted.
Home Made Juice
Composition
DNA extracted/400 µL *
Pineapple Orange Apple Raspberry Redcurrant Blueberry Strawberry Red Orange Blackberry
100% pineapple 100% orange 100% apple 100% raspberry 100% redcurrant 100% blueberry 100% strawberry 100% red orange 100% blackberry
0.063 μg 0.346 μg 1.400 μg 0.543 μg 0.008 μg 0.006 μg 0.043 μg 0.157 μg 0.246 μg
Juice Mixes
Composition
DNA extracted/400 µL *
Blueberry–Orange Blueberry–Orange Blueberry–Orange Pineapple-Strawberry Pineapple-Strawberry Pineapple-Strawberry Redcurrant-Blueberry Redcurrant-Blueberry Redcurrant-Pineapple Redcurrant-Pineapple Strawberry-Blueberry Strawberry-Blueberry Orange-Strawberry Orange-Strawberry
70%–30% 50%–50% 30%–70% 70%–30% 50%–50% 30%–70% 70%–30% 30%–70% 70%–30% 30%–70% 70%–30% 30%–70% 70%–30% 30%–70%
0.150 μg 0.178 μg 0.164 μg 0.026 μg 0.026 μg 0.145 μg 0.007 μg 0.003 μg 0.027 μg 0.011 μg 0.183 μg 0.032 μg 0.087 μg 0.356 μg
Commercial products
Declared Composition
DNA extracted/350 mgº
Blackberry Yogurt Apple Yogurt Strawberry Jam Apple/blueberry baby food Raspberry Jam Blueberry Jam Snack with Strawberry Jam Blackcurrant Juice Soft Fruit Juice
not declared of 15% fruit content: 65% apple 100% strawberry 74% apple, 15% blueberry 100% raspberry 100% blueberry not declared minimum 25% blackcurrant 30% fruit content: 16% apple, 5% strawberry, 5% blackcurrant, 4% blackberry 55% blueberry, 45% wine grapes 40% blackcurrant not declared 18% orange, 14% apple, 3% cranberry 24% blueberry
0.025 μg 0.019 μg 0.085 μg 0.067 μg 0.125 μg 0.182 μg 0.107 μg 0.005 μg 0.021 μg
Blueberry/Grape Juice Blackcurrant Jam Soft Fruit Yogurt Red Fruit Juice Mixed Juice * °
0.002 μg 0.151 μg 0.046 μg 0.021 μg not determined
DNA was extracted starting from 400 µL of juice
DNA was extracted starting from 350 mg of commercial product
Nutrients 2009, 1
319
The extraction methods may have unpredictable effects on discriminative PCRs and there is a risk of misidentification, therefore DNA integrity assessment is necessary in order to ensure that the subsequent analysis with molecular markers is accurate [23]. To achieve this, 10 new degenerate primers were designed on conserved regions of the rbcL sequence after alignment of rbcL sequences from apple (X69749.1), blackcurrant (L11204.2), blueberry (L12625.2, AF419837.1, AF419836.1, AF419835.1, AF421107.1, AF124576.1), raspberry (U06825.1), strawberry (U06805.1), orange (58678-60105), pineapple (L19977.1) and pomegranate (L10223.1) (Table 2). Nine of these primers were used in different combinations to amplify DNA extracted from the juices and the resulting amplification products had a range of 1,000 to 100 pb. Six of these nine were used to amplify DNA derived from commercial food products. In the latter case the amplification limit was between 250 and 1,000 bp. Table 2. Sequences and matching of rbcL primers. Primer name rbcL1 forward rbcL2 forward rbcLA reverse rbcLB reverse rbcLC reverse rbcLD reverse rbcLE reverse rbcLF reverse rbcLH reverse
Sequence 5’-TTGGCAGCATTYCGAGTAACTCC-3’ 5’-TGGCAGCATTYCGAGTAACTC-3’ 5’-CCTTTRTAACGATCAAGRC-3’ 5’-AACCYTCTTCAAAAAGGTC-3’ 5’-TTCSGCACAAAATAMGAAACGG-3’ 5’-TAGTATTTGCDGTGAATCCC-3’ 5’-TGATCTCCACCAGACAKACG-3’ 5’-ATATGCCAAACRTGRATACC-3’ 5’-ATATGCCAAACRTGRATACC-3’
Match with
rbcL1 forward rbcL1 forward rbcL1 forward rbcL1 forward/rbcL2 forward rbcL1 forward/rbcL2 forward rbcL1 forward/rbcL2 forward rbcL1 forward
To discriminate between different fruit species, it is necessary to detect sequence-specific amplification products, as in the detection of GMOs [24] or other raw materials (hazelnut, olive oil, solanaceae) [25-27]. Both primer pairs used in these analyses detected polymorphic profiles that were able to discriminate between our species. Using primer pairs designed from ANS fragments it was possible to discriminate between strawberry, raspberry/blackberry, apple and orange. Using primers PI and PII designed on the 5S rRNA sequence, polymorphic bands were detected in pineapple, orange, apple, raspberry, blueberry and strawberry. Both qualitative analyses were done using the simple PCR technique (Figures 1 and 2) on a real-time PCR platform (Figure 3). In the second case, the fruit species were discriminated using the specific melting temperature of amplicon picks obtained with EvaGreen® fluorescent DNA staining.
Nutrients 2009, 1 Figure 1. Amplification profile of some DNA samples extracted from “home-made” fruit juices observed with EMFxaANS primers.
Figure 2. Amplification profile of some DNA samples extracted from “home–made” fruit juices observed with PI and PII primers.
320
Nutrients 2009, 1
321
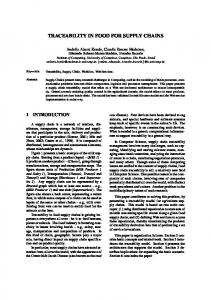
Figure 3. Melting peaks resulting from amplification with EMFxaANS primers showing the different melting temperatures for different fruit juices: pink line - strawberry juice, Tm 84.4 °C; light blue line - blueberry juice, Tm 85.5 °C; blue line - raspberry juice, Tm 82 °C; orange line - blackcurrant juice, Tm 85 °C; green line - blackberry juice, Tm 82.3 °C; brown and dark blue lines - pineapple juice and apple juice, Tm 77.3 °C.
Using EMFxaANS and PI/PII primers for some fruit species revealed the presence of more than one band on the agarose gel, which was supported by the presence of two peaks in real-time PCR. In these cases, it was necessary to sequence single bands cut from the gel. The identity of the polymorphic cut gel bands was determined after purification and sequencing. To determine homologies, with other ANS or 5S sequences of other plant species, the sequencing analysis products were evaluated by a BLAST search within the NCBI GenBank. New sequences were obtained for blueberry, pineapple, raspberry and orange. The new primers designed from these sequences (Table 3) gave us small specific amplification products that were useful for qualitative analyses of “home-made” juices and commercial products. Table 3. Sequences and melting temperatures of primers designed on new sequences. Name Orange forward Orange reverse Blueberry forward Blueberry reverse Pineapple forward Pineapple reverse Strawberry forward Strawberry reverse
Sequence 5’-GGCACGGGTTAAGTAGATTTGC-3’ 5’-TTATATGTTCGCGCTGGTATGATC-3’ 5’-CGACCTTGGCGGAAAACA-3’ 5’-AAGTGAGTTCCCTCCACTTTCG-3’ 5’-GGAGGAGCCCGAAAAACG-3’ 5’-TTTCCGCCTTCTCAAGCAGTT-3’ 5’-CGAAAGGGCAAGGAAAAATG-3’ 5’-GCTCCTCCCGAGCTCATCT-3’
Melting temp. (°C ) 60.3 57.1 56.0 60.0 58.2 57.9 55.3 61.0
Nutrients 2009, 1
322
With these new primers final qualitative and “relative quantitative” analyses were carried out on DNA extracted from pure, single-species juices, juices mixed in different proportions and commercial products with declared percentages (Figures 4 and 5). We carried out a regression analysis on our “relative standards” based on fluorescences detected at different percentages and obtained R2 values ranging from 0.99 for pineapple to 0.93 for strawberry. Figure 4. Melting peak profiles of real-time PCRs carried out on mixed juices with the new species-specific primer pairs.
Blueberry “relative standard” was used to compare DNA extracted from blueberry/apple baby food and blueberry/wine grape juice. The juice mix was found to have a blueberry content of 34% and the baby food 25%. The result obtained with commercial food confirmed the transferability and robustness of the protocol developed with fresh juices. Figure 5. Melting peak profiles of real-time PCR carried out with blueberry juice at different percentages and blueberry-based foods with the new species-specific primer pairs.
Nutrients 2009, 1
323
A preliminary result was obtained using specific primers and two probes designed on blueberry and orange sequences. These two probes were found to have good specificity, even when used on mixed and multiplexed juices (Figure 6). The Multiplex PCR procedure is a useful method for the simultaneous detection of different species in one reaction and has been successfully applied to GMO detection in food [28]. In the future, these probes will be used to optimize quantitative analyses following the development of a quantitative internal standard using a Duplo-Target Plasmid Calibrator [29]. Figure 6. Multiplex real-time PCR carried out with dual labeled probes on DNA extracted from blueberry and orange juices mixed at different percentages.
This research achieved its major objective, which was to develop a preliminary protocol to trace the presence of different berries and other fruits in simple and more complex food matrices. It was clearly demonstrated that a sufficient quantity of fruit DNA can be obtained from home-made and commercial food products. These DNAs can be successfully used for analyses on highly sensitive high-throughput platforms such as Real-Time. As is well-known, quantitative determinations carried out with EvaGreen® or SyberGreen® chemistry are influenced by variations in the efficiency of amplifications determined by primer sequences and the detection of fluorescence at the amplification plateau and may be good indicators for subsequent absolute quantitative analysis. The development of specific fluorescent probes is a good point of departure in the short term, given that these represent an absolute and highly sensitive quantitative protocol able to detect the presence of the fruits in question even in very low quantities, as has been demonstrated in other published works on determining the presence of GMOs in human and animal foods [30,31]. Finally, the new sequences obtained for some of these small fruits can be used to improve knowledge of these plant species through the enhancement of new molecular markers based on detection of single nucleotide polymorphisms (SNPs) able to discriminate between the species and varieties.
Nutrients 2009, 1
324
3. Experimental Section 3.1. Food Samples and DNA Extraction DNA was extracted starting from 400 µL of nine “home-made” fruit juices, from 400 µL of 14 mixes of these juices and from 350 mg of 14 food products containing soft fruits (Table 1) using GreesDNAFoodKIT® (InCura). DNA quantification was carried out using a Qbit-fluorimeter® (Invitrogen). 3.2. DNA Integrity Evaluation DNA integrity was assessed using capillary electrophoresis on Experion® DNA-Chip (Biorad) and by PCR analysis with rbcL primer pairs developed on a ribulose biphosphate carboxylase large subunit (rbcL) sequence that produced amplicons with increasing length. PCRs were performed in 25 µL volume containing: ≅ 30 ng of DNA, 1X reaction buffer, 0.1 mM dNTPs, 0.6 µM of each possible pair of primers (Table 2) and 1.75 U of Hot Start Taq Polymerase DNA with the following profile: 95 °C for 7 min, 35 cycles at 95 °C for 15 sec, 56 °C for 30 sec, 72 °C for 30 sec; final extension at 72 °C for 10 min. The PCR products were visualized on 1.5% GelStar™ Nucleic Acid Stain (Lonza, Milan, Italy) stained agarose gel on transilluminator and on Experion® DNA-chip. 3.3. PCR Analysis Basic PCR analyses were carried out using primer pairs designed on ANS and 5S rRNA sequence regions. PCRs were performed from EMFxaANS primers in a final volume of 25 µL containing: ≅ 30 ng of DNA, 1x PCR Buffer, 0.2 mM dNTPs, 0.5 µM of each primer and 1.25 U of HotStart Taq Polymerase using the thermal profile reported in the published work [22]; for degenerated primers designed on 5S-NTS region in a final volume of 20 µL containing: ≅ 30 ng of DNA, 1X PCR Buffer, 0.2 mM dNTPs, 0.2 µM of each primer and 0.8 U of HotStart Taq Polymerase with the following thermal profile: 95°C for 5 min, Touch Down PCR 10 cycles at 95 °C for 45 sec, from 68 to 63 °C (decreasing 0.5°C with each cycle) for 45 sec, 72 °C for 1 min, 35 cycles at 95 °C for 45 sec, 63 °C for 45 sec, 72°C for 1 min, final extension at 72 °C for 7 min. DNA was extracted from the leaves of the various berry plants analyzed as an amplification control. 3.4. Sequencing Analysis Polymorphic PCR fragments derived from amplification with ANS and PI, PII primers were cut and purified using the commercial kit GreesDNA-KitCleanOut® (InCura). Purification products were sequenced using a BigDie 3.1 ABI kit according to manufacturer’s specifications.
Nutrients 2009, 1
325
3.5. Qualitative and Quantitative Real-Time PCR The primers used in the basic PCR analyses were used to evaluate the different melting temperatures of the amplicons obtained by Real Time PCRs performed on Roche LightCycler® (analysis with EMFxaANS primers) and Bio-Rad CFX® (analysis with 5S-primers) Real-Time platforms using, respectively, SYBRGreen® (ABI) and EvaGreen® (Biorad) according to manufacturers’ protocols. New primers and probes were designed on new sequences of blueberry, orange, pineapple, strawberry and raspberry using Primer Express software (ABI) (Table 3). A realtime PCR using the new primer pairs and an EvaGreen® kit was carried out on DNA extracted from: 100% orange juice, 100% blueberry juice, 100% strawberry juice, 100% pineapple juice, mixes of these juices in varying proportions (30/70%, 50/50%, 70/30%) and commercial products with declared percentages (blueberry jam, one baby food, blueberry/wine grape juice, mixed juice, strawberry jam, soft fruit juice) with the following thermal profile: 95 °C for 3 min, 40 cycles at 95 °C for 10 sec, 52 °C for 10 sec, 72 °C for 30 sec, 1 cycle at 95 °C for 10 sec, 55 °C for 30 sec, a melt curve from 65 °C to 95 °C with an increment of 0.5 °C every 0.05 sec. A preliminary analysis in simple and multiplex PCR was carried out with new primer pairs specific to blueberry and orange and with the fluorescent probes 5’-Cy5-AACCACGTGCCTTGGEclipseQuencer-3’ and 5’-HEX-TGCACATGCTGATGGG-EclipseQuencer-3’ (Eurofins MGW Operon), respectively, using IQ Mastermix (Biorad) according to manufacturer’s specifications and with the following thermal profile: 95 °C for 3 min, 40 cycles at 95 °C for 10 sec, 51 °C for 10 sec, 72 °C for 30 sec. The plate was read at the end of each cycle. 4. Conclusions Under EU law[4], ““traceability” means the ability to trace and follow a food, feed, food-producing animal or substance intended to be incorporated into a food or feed, through all stages of production, processing and distribution” and “Food law shall aim at the protection of interests of consumers and shall provide a basis for consumers to make informed choices in relation to the foods they consume”. To safeguard the food industry, growers, distributors and consumers from fraud and satisfy the increasing high-throughput demands of the food industry, new analytical methodologies able to make more specialized and accurate measurements are needed. These methodologies must focus on performance, sensitivity, reliability, simplified use and routine assays. The preliminary analytical method that we have developed and are improving aims to detect and quantify the presence of soft fruits along the food chain “from farm to fork” and, as a consequence, aims to increase the demand for raw materials from the growers by the food industry and help the consumer in product choice. Improving knowledge of berry sequences and species-specific probe numbers will increase the power of this traceability method. Acknowledgements The work was partially carried out within the Interberry and Sicilberry projects.
Nutrients 2009, 1
326
References and Notes 1. 2.
3. 4.
5.
6. 7. 8. 9. 10.
11. 12.
13.
14. 15.
16.
Hunter, D.C.; Zhang, J.; Stevenson, L.M.; Skinner, M.A. Fruit-based functional foods II: the process for identifying potential ingredients. Int. J. Food Sci. Technol. 2008, 43, 2123-2129. Traill, W.B.; Arnoult, M.H.P.; Chambers, S.A.; Deaville, E.R.; Gordon, M.H.; John, P.; Jones, P.J.; Kliem, K.E.; Mortimer, S.R.; Tiffin, J.R. The potential for competitive and healthy food chains of benefit to the countryside. Trends Food Sci. Technol. 2008, 19, 248-254. Commission Regulation (EC) No 13/2000 on the labelling, presentation and advertising of food. Off. J. Eur. Communities 2000, L109, 29-42. Commission Regulation (EC) No 178/2002 laying down the general principles and requirements of food law, establishing the European Food Safety Authority and laying down procedures in matters of food safety. Off. J. Eur. Communities 2002, L31, 1-24. Gardner, A.M.; Yurawecz, M.P.; Cunningham, W.C.; Diachenko, G.C.; Mazzola, E.P.; Brumley, W.C. Isolation and identification of C16 and C18 fatty acid esters of chloropropanediol in adulteration Spanish cooking oils. Bull. Environ. Contam. Toxicol. 1983, 31, 625-630. Novak, J.; Grausgruber-Gröger, S.; Lukas, B. DNA-based authentication of plant extracts. Food Res. Int. 2007, 40, 388-392. Ehlert, A.; Demmel, A.; Hupfer, C.; Busch, U.; Engel, K.-H. Simultaneous detection of DNA from 10 allergens by ligation-dependent probe amplification. Food Addit. Contam. 2009, 26, 409-418. Peres, B.; Barlet, N.; Loiseau, G.; Montet, D. Review of the current methods of analytical traceability allowing determination of the origin of foodstuffs. Food Control 2007, 18, 228-235. Patel, T. Real Juice, pure fraud. New Sci. 1994, 1926, 26-30. Consolandi, C.; Palmieri, L.; Severgnini, M.; Maestri, E.; Marmiroli, N.; Agrimonti, C.; Baldoni, L.; Donini, P.; De Bellis, G.; Castiglioni, B. A procedure for olive oil traceability and authenticity: DNA extraction, multiplex PCR and LDR-universal array analysis. Eur. Food Technol. 2008, 227, 1429-1438. Woolfe, M.; Promrose, S. Food forensics: Using DNA technology to combat misdescription and fraud. Trends Biotechnol. 2004, 22, 222-226. Marmiroli, N.; Peano, C.; Maestri, E. Advanced PCR techniques in identifying 369 food components. In Food Authenticity and Traceability; Lees, M., Eds.; CRC Press: Cambridge U.K., 2003; pp. 3-33. Scotter, M.J.; Castle, L.; Roberts, D.P.T.; MacArthur R.; Brereton, P.A.; Hasnip, S.K.; Katz, N. Development and single-laboratory validation of an HPLC method for the determination of cyclamate sweetener in foodstuffs. Food Addit. Contam. 2009, 26, 614-622 Reid, L.M.; O’Donnell, C.P.; Downey, G. Potential of SPME-GC and Chemometrics to detect adulteration of soft fruit purées. J. Agric. Food Chem. 2004, 52, 421-427. Nagy, K.; Redeuil, K.; Bertholet, R.; Steiling, H.; Kussmann, M. Quantification of anthocyanins and flavonols milk-based food products by Ultra Performance Liquid Chromatography-Tandem Mass Spectrometry. Anal. Chem. 2009, 81, 6347-6356. Ortola-Vidal, A.; Schnerr, H.; Rojmyr, M.; Lysholm, F.; Knight, A. Quantitative identification of plant genera in food products using PCR and Pyrosequencing® technology. Food Control 2007, 18, 921-927
Nutrients 2009, 1
327
17. Lamppa, G.K.; Bendich, A.J. Changes in chloroplast DNA levels during development of pea (Pisum sativum). Plant Physiol. 1979, 64, 126-130 18. Liu, Z.L.; Zhang, D.; Wang, X.Q.; Ma, X.F.; Wang, X.R. Intragenomic and interspecific 5s rRNA sequence variation in five Asian pines. Am. J. Bot. 2003, 90, 17-24. 19. Bertea, C.M.; Luciano, P.; Bossi, S.; Leoni F.; Baiocchi, C.; Medana, C.; Azzolin, C.M.M.; Temporale, G.; Lombardozzi, M.A.; Maffei, M.E. PCR and PCR-RFLP of the 5S-rRNA-NTS region and salvinorin A analyses for the rapid and unequivocal determination of Salvia divinorum. Phytochemistry 2006, 67, 371-378. 20. Doveri, S.; Lee, D. Development of sensitive crop-specific polymerase chain reaction assay using 5S DNA: applications in food traceability. J. Agric. Food Chem. 2007, 55, 4640-4644. 21. Cox, A. V.; Bennett, M. D.; Dyer, T. A. Use of the polymerase chain reaction to detect spacer size heterogeneity in plant 5S-rRNA gene clusters and to locate such clusters in wheat (Triticum aestivum L.). Theor. Appl. Genet. 1992, 83, 684-690. 22. Sargent, D.J.; Rys, A.; Nier, S.; Simpson, D.W.; Tobutt, K.R. The development and mapping of functional markers in Fragaria and their transferability and potential for mapping in other genera. Theor. Appl. Genet. 2007, 114, 373-384. 23. Sagi, N.; Monma, K.; Ibe, A.; Kamata, K. Comparative evaluation of three different extraction methods for rice (Oryza sativa L.) genomic DNA. J. Agric. Food Chem. 2009, 57, 2745-2753. 24. Xu, W.; Yuan, Y.; Luo, Y.; Bal, W.; Zhang, C.; Huang, K. Event-specific detection of stacked genetically modified maize Bt11 × GA21 by UP-M-PCR and Real-Time PCR. J. Agric. Food Chem. 2009, 57, 395-402. 25. D’Andrea, M.; Coïsson, J.D.; Travaglia, F.; Garino, C.; Arlorio, M. Development and validation of a SYBR-Green I real-Time PCR Protocol to Detect Hazelnut (Corylus avellana L.) in foods through calibration via plasmid reference standard. J. Agric. Food Chem. 2009, 57, 11201-11208. 26. Pafundo, S.; Agrimonti, C.; Maestri, E.; Marmiroli, N. Applicability of SCAR markers to food genomics: olive oil traceability. J. Agric. Food Chem. 2007, 55, 6052-6069. 27. Chaouachi, M.; Malki, R.E.; Berard, A.; Romaniuk, M.; Laval, V.; Brunel, D.; bertheau, Y. development of a Real-Time PCR method for the differential detection and quantification of four solanaceae in GMO analysis: potato (Solanum Tuberosum), tomato (Solanum Lycopersicum), eggplant (Solanum Melongena), and pepper (Capsicum Annuum). J. Agric. Food Chem. 2008, 56, 1818-1828. 28. Germini, A.; Zanetti, A.; Salati, C.; Rossi, S.; Forré, C.; Schmid, S.; Marchelli, R. Development of a seven-target multiplex PCR for the simultaneous detection of transgenic soybean and maize in feeds and foods. J. Agric. Food Chem. 2004, 52, 3275-3280. 29. Dalla Costa, L.; Vaccari, I.; Mandolini, M.; Martinelli, L. Elaboration of a reliable strategy based on Real-Time PCR To characterize genetically modified plantlets and to evaluate the efficiency of a marker gene removal in grape (Vitis spp.). J. Agric. Food Chem. 2009, 57, 2668-2677. 30. Peano, C.; Samson, M.; Palmieri, L.; Gulli, M.; Marmiroli, N. Qualitative and quantitative evaluation of the genomic DNA extracted from GMO and non-GMO foodstuffs with four different extraction methods. J. Agric. Food Chem. 2004, 52, 6962-6968.
Nutrients 2009, 1
328
31. Anklam, E.; Gadani, F.; Heinze, P.; Pijnenburg, H.; Van Den Eade, G. Analytical methods for detection and determination of genetically modified organisms in agricultural crops and plantderived foods products. Eur. Food Res. Technol. 2002, 214, 3-26. © 2009 by the authors; licensee Molecular Diversity Preservation International, Basel, Switzerland. This article is an open-access article distributed under the terms and conditions of the Creative Commons Attribution license (http://creativecommons.org/licenses/by/3.0/).