Soft Problems in Using Consumer Electronic Products C.J. Kim, Delft University of Technology, Delft, The Netherlands
[email protected] H.H.C.M. Christiaans Delft University of Technology, Delft, The Netherlands
[email protected] D.J. van Eijk Delft University of Technology, Delft, The Netherlands
[email protected]
Abstract Manufacturers are confronted with complaints from consumers that are not related to technical failure. Failure seems to be related to an unexpected gap between actual product use and intended use by the manufacturer, as products are becoming more complex and miniaturized. This new class of consumer complaints in the consumer electronic industry is defined as “soft problems”. In this paper, we empirically analyze what soft problems consumers have experienced using consumer electronic products, and if culture leads to differences in soft problems between Korea and the Netherlands. From collected complaints, we first created categories of soft problems, analyzed the correlation between product categories and soft problems, and then compared the differences between both groups. Most soft problems are very closely related to product design factors and they differ between product categories. Differences are also found between the two cultural groups. The implications of these findings and suggestions for future research are discussed. Keywords: user complaint, usability, cross-cultural work
1. Introduction Since electronic products were launched on the consumer market consumers have experienced convenience as the products save labor and time in domestic chores. At the beginning most complaints made by consumers were about technical problems such as the failure or malfunction of products because they technically did not always work as well as consumers expected. However, electronic products have recently started to play a role in not only aiding people in a
functional way but also giving people mental pleasure. That is to say, they also provide fun and entertainment to people beyond being used as a physical or technical aid. For instance, people enjoy listening to music on an mp3 player and playing a game on their mobile phone. To meet these requirements, products are armed with more functions and then are integrated into a product (den Ouden, Lu, & Brombacher, 2005). As a result they become more and more complex (Broadbridge & Marshall, 1995). In addition, tolerance of consumers and end-users for quality and reliability problems with products is decreasing (Brombacher, 2005). Moreover, according to a survey, about half of consumer electronic products are returned with explanations or reasons which have nothing to do with technical failures or malfunctions (den Ouden, Yuan, Sonnemans, & Brombacher, 2006). Presumably it results from an unexpected gap between actual product use and intended use by the manufacturer (Chen-Yu, Hong, & Lee, 2001; Estelami, 2003; Goodman, Ward, & Broetzmann, 2002; Shin & Elliott, 2001). This new class of consumer complaints that has not been observed in the consumer electronic industry is defined as “soft problems” - as opposed to hard failures when a product does not meet the technical specifications, such as specified functions. As a result, it can be assumed that manufacturers are more and more confronted with complaints from consumers that are not related to technical failure, but to non-technical problems. With increasing product complexity, miniaturization and the resulting black-box designs, consumers demand user-friendliness and hence soft problems are becoming an increasingly important factor in coping with this phenomenon in the field of industrial product design. Nevertheless, it is consumer complaints resulting only from technical failure that thus far have been the topic of academic research with regard to quality and reliability management in the consumer electronics industry. Considering that experience in previous use of products influences purchase of new products, consumers who have been dissatisfied with a product even due to soft problems are unlikely to buy the same product again (Anderson, 1998; Bougie, Pieters, & Zeelenberg, 2003; Geva & Goldman, 1991; Schneider & Bowen, 1999; Spreng, Thomas & Page, 2001). This kind of dissatisfaction could also reproduce negative word-of-mouth publicity thus influencing the buying decision of other consumers (Anderson, 1998; Brown, Barry, Dacin, & Gunst, 2005; Lau & Ng, 2001). Therefore, it is significant to know and understand soft problems, which have not been reported to the manufacturers, but which the consumer has experienced, compared with the technical problems reported. In order to develop products that meet the consumer’s expectations, the root cause of these soft problems should be found as well. At present there is a lack of information on the causes of such soft problems. Hence, this study focuses on the root cause of soft problems experienced by the user in interaction with consumer electronic products. First, soft problems in using consumer
electronic products are explored in order to see if these problems are linked to the field of industrial design. Then, based on product categories, we will examine whether or not soft problems are specific to a certain category of products. Finally, it has been found that customers in different cultures have different complaint behaviors and intentions (Chen-Yu , Hong, & Lee,, 2001; Han & Hong, 2003; Laufer, 2002; Liu & McClure, 2001; Manrai & Manrai, 1993; Yuksel, Kilinc, & Yuksel, 2006). Moreover, people with different cultural backgrounds have different preferences regarding product design (Hariandja & Daams, 2005; Honold, 2000; Kim, Chrisitaans, & Diehl, 2006; Ono, 2006). Accordingly, soft problems are compared between groups with different cultural backgrounds to determine whether cultural differences play a role in the kind and level of soft problems caused by dissatisfaction.
2. Method A method had to be developed in order to address some of the issues raised here. First, some product designers were interviewed, focusing on consumers’ complaints and the product development process. Based on the interviews, a questionnaire was designed to ask consumers about soft problems they experience. Subjects were recruited to answer the questionnaire uploaded from a webpage on the internet.
2.1 Interview To set up an initial study for soft problems, four product designers were interviewed who were working or had worked at major companies that produce consumer electronic products for the international market in South Korea. As an explorative study, it was asked what kind of complaints and in what form they usually get from a helpdesk or from consumers, how they implement the demands collected from complaints in the process of product development, and finally what they think about soft problems from a manufacturer’s perspective.
2.2 Questionnaire Several open-ended questions were formulated to discover the causes of the soft problems experienced by users. Under conditions where dissatisfaction with a product does not need to be settled as urgently as a request for help to a helpdesk or a service center, the first question in the list was what product subjects feel most dissatisfied with other than technical problems, while interacting with household electronic products. The second question was what specific
dissatisfaction or complaints about non-technical complaints they have with the product mentioned in the first question.
2.3 Subjects South Korean and Dutch people were targeted in this study because, firstly, as members of OECD (Organization for Economic Co-operation and Development), they have no big difference in economic status and secondly, they differ in the cultural dimensions proposed by Hofstede (2003). According to Hofstede’s dimensions, the Netherlands can be regarded as a representative of Western European culture, with South Korea as a representative of Far East Asian culture. A total of 155 subjects participated in the web-based questionnaire: 109 Koreans and 46 Dutch, living in their own country were recruited through product review forums on the Internet. First, 109 Koreans and 23 Dutch took part in the open-ended questionnaire and then the other 23 Dutch participants, who have used an iPod, joined the web-based questionnaire focusing on the iPod as a product. The last group was involved in the study because we wanted to compare research methods focusing on a specific product versus on a broad range of products.
2.4 Procedure A link to the questionnaire was placed in a website and designed in such a way that subjects could answer the questions on the Internet in their own country. Subjects were invited to visit the website and answer some questions by email. No restrictions were placed in the open-ended questions. The answers given by subjects were automatically saved into a database on the Internet.
3. Results Through the interviews and the web-based questionnaire raw data were obtained. The information from the interviewees gave an overview of soft problems in practice. Categorization of the soft problems was done on the basis of the complaints from the questionnaire. Again, soft problems were analyzed or compared on many variables such as types of products, and cultural difference.
3.1 Interview While interviewing the product designers, the focus was on three questions; how they gather consumer complaints, how they use those complaints in product design, and their opinion on soft problems. With regard to the first question, it was found that there was no official channel for them to get or gather consumer complaints in the companies. Thus, they actually did not know much about consumers’ dissatisfaction. As a consequence of the fact that there was no channel to get feedback from the consumer, consumer complaints were not considered in the following product development process. In addition, there is no information available on soft problems of a nontechnical nature to give insight into the cause of the consumer’s dissatisfaction. Regarding the question as to how they cope with the soft problems that emerge in the consumer electronic product market nowadays, they gave the common opinion that soft problems are very difficult to deal with in the field of product design because every aspect of the product can pose a soft problem to someone because of diversity in preference and personality among consumers. Therefore, consumer complaints including soft problems were not regarded as an important factor in the process of product design in industry, despite the fact that product returns resulting from non-technical failures are growing.
3.2 Categorization A total of 336 complaints were reported through the web-based questionnaire in South Korea and the Netherlands. As mentioned in the interview with the product designers, soft problems come in a wide variety. While user problems have usually been translated into product design terms such as conceptual models, mapping, affordance, etc., in this study soft problems were categorized based on the consumer’s point of view in this study (see Table 1). In order to avoid culturally biased interpretation categorizing was conducted by four independent judges (two Dutch and two Korean). The result was a categorization of the 336 soft problems on consumer electronic products into 9 main categories and 27 subcategories.
3.3 Soft problems At first glance, not all subcategories of soft problems may appear to be closely linked to the field of product design. However, by taking a wide definition of product design (Han, Yun, Kwahk, & Hong, 2001), all the categories shown above are in fact dealt with in the process of product development. Some of them fall under product strategy, some under product safety and formgiving, and others under product usability in that they include both emotion and performance of
Table 1 Categorization of soft problems Category
Subcategory Understanding
Function
Finding Lack of need Compatibility Time
Performance
Battery Efficiency Error Sound Tactility Weight
Sensation
Heat No sense
Health
Fatigue Safety Cable Structure
Mechanism Shape Connection Service Maintenance
Cleaning Care Durability By-product Lack of function
Constraint
Lack of improvement Insufficient information
Trend Third party
Description Users know that a function exists and have no difficulty in finding it, but they don’t understand how to use it. Users have difficulty in finding a specific function. Users don’t use and need some functions. Sometimes these functions just confuse them. Product is impossible or difficult to use with other software or hardware. Product is annoying because it is too slow or too fast. Battery life is not long enough and seems to become less and less. Product is less efficient with regard to technical performance. Sometimes an error occurs that cannot be solved through a helpdesk. Product is not loud enough to listen to or is too noisy. Users feel unpleasant touching or using product. Product is heavy to carry or use. Users feel unpleasant because of heat emitted by product. User cannot feel any differences between options or levels. Users feel tired or fatigued in a part of their body while using product. Users are worried about harming their health. Product is annoying because of its cable. Users feel uncomfortable because of product’s mechanical structure. Product is too small or big to comfortably use or press. Problems occur because of its exterior form. Ejecting or connecting is irritating. It is difficult to get help or support. Software support is seldom updated. It is annoying to clean product. Product requires more care. Product is not strong or durable enough. Product produces by-products that need to be managed Users feel a need for a specific feature or function, with which the product would be more convenient to use Product is not improved compared with its previous version There is no feedback or feedforward in use Product’s design soon becomes boring or old-fashioned The problem comes not from the product itself but from a third party.
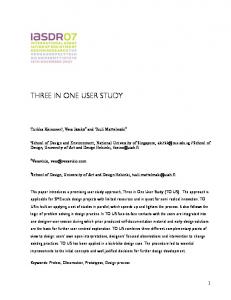
health 1%
maintenance 11%
sensation 9%
trend 1%
third party 1% performance 26%
mechanism 13% constraint 15%
function 23%
Fig. 1 Soft problems in per cent of total number of complaints (k=336)
products (Han, Yun, Kwahk, & Hong, 2001; Tractinsky, Katz, & Ikar, 2000). The most commonly occurring soft problem experienced was with regard to the performance of products (see Fig. 1). People’s complaints are about low compatibility, too slow or too rapid response time, low battery life, low efficiency and irregular errors of products. This is different from the technical problems, where products cannot be used at all any more, in that the product still works and is still used, even though users are dissatisfied due to the soft problems. Then, secondly, complaints about function are largely reported. This category consists of subcategories of understanding, finding, and lack of need. The subjects complained about having difficulty in understanding or finding functions. Furthermore, they were dissatisfied because products had many functions they did not need or use, confusing them when using these products. Constraint is ranked in the third place. Constraint means that a product lacks a necessary function, is not improved compared with its previous version, and gives insufficient information despite a consumer need for feedback or feedforward. Fourth, the subjects said that they had complaints about the mechanism of products: electronic products had a complex wiring system or a short cable, an irritating connection, uncomfortable mechanical structure, or were too large or too small in shape. Soft problems ranked in the fifth position were related to product maintenance. The
subjects expressed dissatisfaction with disappointing service, difficult cleaning, special care, low durability, or the production of (a) by-product(s) while using the product. Maintenance was followed by sensation, which is linked to human sensual dissatisfaction such as low sound quality, uncomfortable tactility, heaviness, heat generated by products, and obscure sensual perception. The others are health, trend, and problems due to a third party, which were the lowest ranked in soft problems by the subjects. For health, they complained that they felt tiredness or fatigue while or after using. And for trend, their complaint was that their products became old-fashioned too soon after having bought them. Finally, for the problem due to a third party, their complaint was that they were irritated by spam messages on their mobile phone.
3.4 Product categories and soft problems Based on the soft problems and products that the subjects complained about, a next step is to investigate the correlation between products and product category. Because there is variance in consumer complaints across different types of products (Oster, 1980), products were also categorized based on the cognitive effort required for use (see Table 2). For instance, more mental load is invested in using a laptop computer than a coffee machine. Besides, there are more possible adjustment and interaction opportunities with a laptop computer than with a coffee machine. The results show that most of the soft problems come from products in category 2 (see Fig. 2). The soft problems in category 1 and 3 were placed second and third respectively. Ironically, the least soft problems were experienced with the most complex products. The diagrams below show the percentage of soft problems according to product category (see Fig. 3, 4, and 5). Considering the four major soft problems that account for more than 50%, it was found that there is a major difference between product categories. For category 1 products the soft problems, mechanism, function, maintenance, and performance are ranked highest while the most important soft problems for category 2 products are performance, function, constraint, and maintenance. Finally, performance, sensation, mechanism, and maintenance account for most soft problems in category 3. For the category 1 products subjects expect them to be wellorganized in terms of shape and structure. The functions of category 1 and 2 products are expected to be easily found and understood. On the other hand, ‘sense’-friendliness and high performance are expected in the fairly complicated category 3 products. These differences between categories demonstrate that soft problems are dependent on the type of products as categorized according to the cognitive level required to use them.
Table 2 Product categories based on cognitive effort Category Category 1 Category 2 Category 3
Description Simple product with buttons that have distinct functions e.g. microwave, vacuum cleaner, alarm clock, washing machine, refrigerator Complicated products with several adjustments e.g. mobile phone, DVD player, remote control, mp3 player, digital camera Highly complex products with almost infinite functions and adjustments e.g. desktop computer, laptop computer, mobile PDA
Category 3 9%
Category 2 73%
Fig. 2 Proportion of soft problem per product category
Category 1 18%
trend 1%
health 3%
sensation 11%
mechanism 22%
constraint 12%
performance 13%
function 22% maintenance 16%
Category 1
Fig. 3 Soft problems with category 1 products (in per cent of number of complaints; k=76)
third party 1% sensation 6% mechanism 10%
performance 32%
maintenance 10%
constraint 16%
function 25%
Category 2
Fig. 4 Soft problem with category 2 products (in per cent of number of complaints; k=232)
constraint 11%
function 7% performance 32%
maintenance 7%
mechanism 14% sensation 29%
Category 3
Fig. 5 Soft problem with category 3 products (in per cent of number of complaints; k=28)
3.5 Cultural difference in soft problems Two samples of subjects with different cultural backgrounds participated in this study, people from the Netherlands and South Korea. The aim was to investigate whether or not culture influences soft problems by comparing people from the two countries. The number of soft problems reported was again used for comparison. First, the total number for each problem category was compared. Second, they were compared again according to product category. However, the number of soft problems between product categories between the two groups could not be compared since half the Dutch subjects were iPod users who described only their iPod from a soft problem perspective.
3.5.1 Soft problems between the cultural groups Figure 6 shows the distribution of soft problems for both cultural groups. In order to see if the differences are significant, the Mann-Whitney U test was used. See Table 3 for the results. Function, sensation, and constraint are significantly different between the Dutch and the Koreans.
45% 40% 35% 30% 25%
Dutch
20%
Korean
15% 10% 5%
rty th
ird
pa
tre nd
sm m ai nt en an ce co ns tra in t
m
ec
ha
ni
he al th
fu nc tio n
pe rfo rm an ce se ns at io n
0%
Fig. 6 Soft problem comparison between Dutch and Korean samples Table 3 Mann-Whitney U test result on all the soft problems function
performa
sensatio
1667
2081
1710
9170
9584
2376
Z
-2.689
-.542
Asymp. Sig. (2tailed)
.007**
.588
Mann-Whitney U Wilcoxon W
health
mechani
maintena
constrain
trend
third
2171
2175
2184
1733
2160
9674
9678
2850
9236
2826
2826
-3.085
-.438
-.120
-.072
-2.495
-.771
-.771
.002**
.661
.904
.942
.013*
.441
.441
2160
Grouping Variable: culture * Significant at 5 per cent level. ** Significant at 1 per cent level.
3.5.2 Soft problems per product category between the cultural groups The same comparison was made for each product category (see Fig. 7, 8, and 9). To determine the significant level the Mann-Whitney U test was used again. As Table 5 shows the two cultural groups differ significantly regarding complaints about function, sensation, and constraint of category 2 products; but there are no differences in category 1 and 3 (see Table 5 and 6). However, considering the noticeable differences in the graphs the lack of statistical significance is probably due to the low number of complaints.
Category 1 40% 35% 30% 25% Dutch
20%
Korean
15% 10% 5%
rty th
ird
pa
tre nd
sm m ai nt en an ce co ns tra in t
m
ec
ha
ni
he al th
fu nc tio n
pe rfo rm an ce se ns at io n
0%
Fig. 7 Soft problem comparison in product category 1 Table 4 Mann-Whitney U test result on the soft problems in category 1 function
perform
sensatio
mechani
maintena
constrain
164.5
133
159
147
175.5
180
984.5
953
204
967
220.5
1000
-1.452
-1.168
-1.614
-.775
-1.270
-.474
.000
.882
.147
.243
.106
.438
.204
.635
1.000
.929(a)
.366(a)
.694(a)
.234(a)
.602(a)
.408(a)
.909(a)
1.00(a)
Mann-Whitney U
177
176
144
Wilcoxon W
997
996
189
-.110
-.148
.912 .949(a)
Z Asymp. Sig. (2tailed) Exact Sig. [2*(1tailed Sig.)]
a Not corrected for ties. Grouping Variable: culture
health
trend
third
Category 2 35% 30% 25% 20%
Dutch Korean
15% 10% 5%
rty th
ird
pa
tre nd
sm m ai nt en an ce co ns tra in t
m
ec
ha
ni
he al th
fu nc tio n
pe rfo rm an ce se ns at io n
0%
Fig. 8 Soft problem comparison in product category 2 Table 5 Mann-Whitney U test result on the soft problems in category 2 function Mann-Whitney U Wilcoxon W Z Asymp. Sig. (2tailed)
perform
sensatio
health
mechani
maintena
constrain
trend
638
874.5
741
884
831
862
695.5
884
3053
3289.5
1092
1235
1182
3277
3110.5
1235
-2.481
-.204
-2.260
-.614
-.777
-.421
-2.072
-.614
.013*
.838
.024*
.539
.437
.674
.038*
.539
Grouping Variable: culture * Significant at 5 per cent level.
Category 3 120% 100% 80% Dutch
60%
Korean
40% 20%
rty th
ird
pa
tre nd
sm m ai nt en an ce co ns tra in t
m
ec
ha
ni
he al th
fu nc tio n
pe rfo rm an ce se ns at io n
0%
Fig. 9 Soft problem comparison in product category 3 Table 6 Mann-Whitney U test result on the soft problems in category 3 function
perform
sensatio
health
mechani
maintena
constrain
trend
third
Mann-Whitney U
5.500
3.500
3.000
6.500
5.000
5.500
5.000
6.500
6.500
Wilcoxon W
6.500
94.500
4.000
97.500
6.000
6.500
6.000
97.500
97.500
Z
-.408
-.832
-.971
.000
-.519
-.408
-.522
.000
.000
.683
.405
.332
1.000
.604
.683
.602
1.000
1.000
.857(a)
.571(a)
.571(a)
1.00(a)
.857(a)
.857(a)
.857(a)
1.00(a)
1.00(a)
Asymp. Sig. (2tailed) Exact Sig. [2*(1tailed Sig.)]
a Not corrected for ties. Grouping Variable: culture
4. Conclusions and Discussion Rather than taking a general, theoretical approach to soft problems, we chose to define, explore and compare them and how they relate to product type and user culture. In doing so, this represents an attempt to gain insight into the soft problems that are becoming more and more prevalent by weighing the appropriate empirical evidence. All the soft problems surveyed through the web-based questionnaire are dealt with in the field of product design, although they are very diverse. They seem closely related to product design.
Accordingly, the reported soft problems can play an important role in product design because they have hardly been considered in the process of product development to date, even though more and more consumers complain about these non-technical failures. According to responses given by the subjects, it can be concluded that most consumers feel dissatisfaction with the low performance of products with difficulty in understanding functions and with constraints, even though they may meet technical specifications. For products requiring less cognitive effort, mechanism, function, and maintenance are the main causes of soft problems, while they are not considered to be the major causes for products requiring more cognitive effort. It is interesting that soft problems related to sensation are followed by performance for the most complex consumer electronic products, and also that most soft problems come from the second product category (e.g. mobiles, digital cameras). The fact that the least soft problems are reported in the third product category, which requires the most cognitive effort, implies that ease of use is the main issue that needs to be dealt with in the second category. Soft problems are ranked differently in each product category. This demonstrates that soft problems are dependent on the type of product. Product developers can therefore give priority to some aspects that are relatively more important to a particular category under which a new product falls rather than others when developing and designing the product. The results also show that soft problems differ between people with different cultural backgrounds. This means that it is necessary to take into account cultural aspects or local preference when a product is developed for a market with a different culture. However, it appears necessary to further study soft problems in product categories 1 and 3, because the number of complaints about products in both categories was small and thus may have influenced the result of the comparison between the two cultural groups. For the research method, it was found that using open-ended questions on products having a soft problem is much more useful than focusing on a specific consumer product in order to get to know a broad range of soft problems. These explorative findings therefore represent a starting point for further research as soft problems are diverse and dependent on product type and user culture. This is also considering the current trend of consumers complaining more often about the non-technical aspects of consumer electronic products. In conclusion, these findings should be used for further research aimed firstly at finding the correlation between the soft problems associated with certain electronic products and the characteristics of users as to their sensorial, mental and physical capacities, and secondly, the limitations coupled to differences in, for instance, age, gender, and culture. Finally, the aim should
be to produce a design methodology for reducing usability problems associated with consumer electronic products.
References Anderson, E. W. (1998). Customer Satisfaction and Word of Mouth. Journal of Service Research, 1(1), 5-17. Bougie, R., Pieters, R., & Zeelenberg, M. (2003). Angry customers don't come back, they get back: The experience and behavioral implications of anger and dissatisfaction in services. Journal of the Academy of Marketing Science, 31(4), 377-393. Broadbridge, A., & Marshall, J. (1995). Consumer complaint behaviour: the case of electrical goods. International Journal of Retail & Distribution Management, 23, 8-18. Brombacher, A. C. (2005). Reliability in strongly innovative products; a threat or a challenge? Reliability Engineering and System Safety, 88, 125. Brown, T. J., Barry, T. E., Dacin, P. A., & Gunst, R. F. (2005). Spreading the Word: Investigating Antecedents of Consumers' Positive Word-of-Mouth Intentions and Behaviors in a Retailing Context. Journal of the Academy of Marketing Science, 33(2), 123-138. Chen-Yu, J. H., Hong, K.-H., & Lee, Y. (2001). A comparison of determinants of consumer satisfaction/dissatisfaction with the performance of apparel products between South Korea and the United States. Journal of Consumer studies and Home economics, 25(1), 62-71. den Ouden, E., Lu, Y., & Brombacher, A. (2005). Consumer oriented product quality: Why available approaches are no longer sufficient. Journal of Product Innovation Management (under review). den Ouden, E., Yuan, L., Sonnemans, P. J. M., & Brombacher, A. C. (2006). Quality and reliability problems from a consumer's perspective: an increasing problem overlooked by businesses? Quality and Reliability Engineering International, 22(7), 821-838. Estelami, H. (2003). Sources, characteristics, and dynamics of postpurchase price complaints. Journal of Business Research, 56(5), 411-419. Geva, A., & Goldman, A. (1991). Duality in consumer post-purchase attitude. Journal of Economic Psychology, 12(1), 141-164. Goodman, J. A., Ward, D., & Broetzmann, S. (2002). It might not be your product. Quality Progress, 35(4), 73, 76pgs. Han, S. H., & Hong, S. W. (2003). A systematic approach for coupling user satisfaction with product design. Ergonomics, 46(13-14), 1441-1461. Han, S. H., Yun, M. H., Kwahk, J., & Hong, S. W. (2001). Usability of consumer electronic products. International Journal of Industrial Ergonomics, 28(3-4), 143-151. Hariandja, J., & Daams, B. (2005). Cultural Differences in Product Use and User Needs: Cross-cultural Usability Testing of a Food Processor in Indonesia and The Netherlands. Paper presented at the IWIPS Conference 2005, Amsterdam. Hofstede, G. (2003). Culture's Consequences: Comparing Values, Behaviors, Institutions and Organizations Across Nations (2 ed.). London: Sage Publications, Inc. Honold, P. (2000). Culture and Context: An Empirical Study for the Development of a Framework for the Elicitation of Cultural Influence in Product Usage. Journal of Human-Computer Interaction, 12(3&4), 327-345. Kim, C. J., Chrisitaans, H. H. C. M., & Diehl, J. C. (2006). Exploring the influence of culture in consumer electronic products. Paper presented at the 16th World Congress on Ergonomics IEA 2006, Maastricht, the Netherlands. Lau, G. T., & Ng, S. (2001). Individual and situational factors influencing negative word-of-mouth behaviour. Canadian Journal of Administrative Sciences-Revue Canadienne Des Sciences De L Administration, 18(3), 163-178. Laufer, D. (2002). Are antecedents of consumer dissatisfaction and consumer attributions for product failures universal? In Advances in Consumer Research, Volume Xxix (Vol. 29, pp. 312-317). Provo: Assoc Consumer Research. Liu, R. R., & McClure, P. (2001). Recognizing cross-cultural differences in consumer complaint behavior and intentions: An empirical examination. Journal of Consumer Marketing, 18(1), 54-74.
Manrai, L. A., & Manrai, A. K. (1993). Complaints and Compliments About Service Encounters - a Comparison of American and Bulgarian Consumers. Advances in Consumer Research, 20, 97-101. Ono, M. (2006). Design and Culture: essentially interlinked, plural, variable, and beyond the predictable. Journal of Design Research, 5(1), 3-15. Oster, S. (1980). The Determinants of Consumer Complaints. The Review of Economics and Statistics, 62(4), 603. Schneider, B., & Bowen, D. E. (1999). Understanding Customer Delight and Outrage. Sloan Management Review, 41(1), 35-46. Shin, D., & Elliott, K. M. (2001). Measuring customers' overall satisfaction: A multi-attributes assessment. Services Marketing Quarterly, 22(1), 3. Spreng, R. A., & Thomas J. Page, J. (2001). The impact of confidence in expectations on consumer satisfaction. Psychology and Marketing, 18(11), 1187-1204. Tractinsky, N., Katz, A. S., & Ikar, D. (2000). What is beautiful is usable. Interacting with Computers, 13(2), 127-145. Yuksel, A., Kilinc, U. K., & Yuksel, F. (2006). Cross-national analysis of hotel customers' attitudes toward complaining and their complaining behaviours. Tourism Management, 27(1), 11-24.