Bulletin of Faculty of Pharmacy, Cairo University 55 (2017) 203–210
Contents lists available at ScienceDirect
Bulletin of Faculty of Pharmacy, Cairo University journal homepage: www.elsevier.com/locate/bfopcu
Software based approaches for drug designing and development: A systematic review on commonly used software and its applications
T
⁎
Prasad G. Jamkhandea, , Mahavir H. Ghantea, Balaji R. Ajgundeb a b
Sharda Bhavan Education Society's Nanded Pharmacy College, Nanded 431605, Maharashtra, India School of Pharmacy, Swami Ramanand Teerth Marathwada University, Nanded 431606, Maharashtra, India
A R T I C L E I N F O
A B S T R A C T
Keywords: Drug discovery Docking Structural activity relationship Molecular modeling Computational methods
Drug discovery include drug designing and development, is a multifarious and expensive endeavor, where least number of drugs that pass the clinical trials makes it to market. Software based drug discovery and development methods have major role in the development of bioactive compounds for over last three decades. Novel software based methods such as molecular modeling, structure-based drug design, structure-based virtual screening, ligand interaction and molecular dynamics are considered to be powerful tool for investigation of pharmacokinetic and pharmacodynamic properties of drug, and structural activity relationship between ligand and its target. Computational approaches such as docking confer interaction of small molecules with structural macromolecules and thereby hit identification and lead optimization. These methods are faster, and accurately provide valuable insights of experimental findings and mechanisms of action. In addition, appropriate implementation of these techniques could lead to a reduction in cost of drug designing and development. Currently in biomedicine sciences these software are exhibiting imperative role in the different phases of drug discovery. The review discusses working principle and successful applications of most commonly used software for drug designing and development.
1. Introduction Exploration of software and model based tools have become a key component of the drug discovery and development in pharmaceutical industry, playing a crucial role in expanding new bio-active drugs across a range of therapeutic areas. Proper use of software and computer based modern methods has reduced several hindrances in the process of drug discovery and hasten new drug development. Modern medicinal chemistry methods like molecular modeling, structure-based drug design, structure-based virtual screening, ligand based modeling and molecular dynamics are used as a powerful tool to know pharmacokinetic and pharmacodynamic properties, and structural activity relationship of ligands with its target (Table 1) [1,2]. Combine application of modeling such as ligand based computer aided drug designing (CADD) and simulations provide a powerful paradigm for modernizing clinical study design and analysis [3,4]. Implementation of these techniques can reduce the numbers of animals needed in the research and preclinical stages of drug discovery, help for trouble-free to handle huge data, and improve the accuracy of study results [5,6]. Successful drug discovery, development and launch of single new
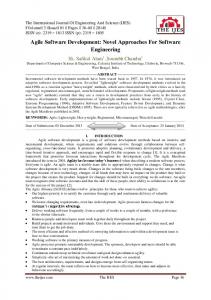
drug into the market costs about one billion dollar and it requires nearly 12 years for accomplishing. High cost, insufficient and lengthy time duration, high level of risk, uncertainty in the results, and highly complex procedures are the main challenges in the development of new drug. To overcome these problems, it is needed to employ new and more cost effective drug discovery and designing methods (Fig. 1) such as software and computer aided drug design and molecular docking [5,7]. The present review highlights commonly used software used for new drug development along with their potential uses. 2. Software for drug designing, discovery and development The software are further categorized on the basis of task performing by the software and their working principle like software assessing pharmacokinetic parameters, ligand interactions and molecular dynamic, molecular modeling and structural activity relationship, image analysis and visualizers, data analyzer and behavior analysis software.
Peer review under responsibility of Faculty of Pharmacy, Cairo University. ⁎ Corresponding author at: Sharda Bhavan Education Society's Nanded Pharmacy College, Nanded 431606, Maharashtra, India. E-mail address:
[email protected] (P.G. Jamkhande). http://dx.doi.org/10.1016/j.bfopcu.2017.10.001 Received 8 June 2017; Received in revised form 12 September 2017; Accepted 15 October 2017 Available online 31 October 2017 1110-0931/ copyright 2017 Publishing services provided by Elsevier B.V. on behalf of Faculty of Pharmacy, Cairo University. This is an open access article under the CC BY-NC-ND license (http://creativecommons.org/licenses/BY-NC-ND/4.0/).
Bulletin of Faculty of Pharmacy, Cairo University 55 (2017) 203–210
P.G. Jamkhande et al.
Table 1 Software and computer based programs used during new drug discovery and development. Sr. No.
Software name
Major use
References
1. Pharmacokinetic parameters 1 DDDPlus 2 GastroPlus 3 MapCheck
Dissolution and disintegration study In-vitro and in vivo correlation for various formulations Compare dose or fluency measurement
8,9 10,11 12,13
2. Ligand interactions and molecular dynamic 4 AutoDock 5 Schrodinger 6 GOLD 7 BioSuite
Evaluate the ligand-protein interaction Ligand-receptor docking Protein-ligand docking Genome analyzing and sequence analyzing
14,15 16,17 18,19 20,21
3. Molecular modeling and structural activity relationship 8 Maestro 9 ArgusLab 10 GRAMM 11 SYBYL-X Suite 12 Sanjeevini 13 PASS
Molecular modeling analysis Molecular docking calculations and molecular modeling package Protein-protein docking and protein-ligand docking Molecular modeling and ligand based design Predict protein-ligand binding affinity Create and analysis of SAR models
22,23 24,25,26 27,28,29 30,31,32 33,34 35,36,37
4. Image analysis and Visualizers 14 AMIDE (A Medical Image Data Examiner) 15 Discovery Studio® Visualizer 16 Imaging Software Scge-Pro 17 Xenogen Living Image Software
Medical image analysis in molecular imaging Viewing and analyzing protein data Cytogenetic and DNA damage analysis In vivo imaging display and analysis
38,39 40,41 42,43 44,45
5. Data analysis 18 19 20
Identify variation across set of sample and for correction method in samples Protein-protein interaction study Analysis of gene expression data
46 47,48 49,50
Behavior analysis Animal activity tracking, enzyme activity, nanoparticle tracking and delivery study
51 52
GeneSpring QSARPro REST 2009 Software
6. Behavioral study 21 Ethowatcher 22 MARS (Multimodal Animal Rotation System)
Designing
Computational / Software based Approaches
Development
Ethowatcher
AMIDE
MapCheckQ
Schrodinger
ArgusLab
SYBYL-X Suite
PASS
DDDPlus
AutoDock
SARPro
MARS
GOLDGRAMM
BioSuite
Discovery
GastroPlus
GeneSpring
REST 2009
Maestro
Sanjeevini
Studio® Visualizer
Fig. 1. Software based approaches for drug designing and development.
disintegration and dissolution pattern of dosage form and active ingredients. It is an advanced computer program employed by formulation scientists to simulate in vitro disintegration and dissolution of active pharmaceutical ingredients (API) and excipients under different
2.1. Pharmacokinetic parameters 2.1.1. DDDPlus (Dose Dissolution and Disintegration software) DDDPlus (Dose Disintegration and Dissolution Plus) is used to study 204
Bulletin of Faculty of Pharmacy, Cairo University 55 (2017) 203–210
P.G. Jamkhande et al.
The MapCheck system create verification plan for each field, export calculated dose map (Frontal) to MapCheck for each field, calibrated diode array prior to collecting data. Standard deviation increases with plan complexity. The average measured dose is independent of plan complexity. It is user friendly software for data analysis, easier commissioning process and generates comprehensive report [12,13].
experimental conditions. In the formulation of new API, a single calibration experiment is generally required, after which DDDPlus predicts how changes in formulation or experimental parameters will affect the dissolution rate. This software provides precise information of dissolution and disintegration rate so it is not necessary to rely on conventional ‘cut and try’ methods to finalize a formulation design [8,9]. DDDPlus allow selecting from one of 5 mathematical models and 5 dosage forms employed to illustrate dissolution of a single ingredient. The mathematical models used for the in vitro dissolution simulation describes the effect of following parameters on dissolution:
2.1.3.1. Use. - MapCheck used for IMRT verification. - Small detectors identify MLC. - Dose based EPID IMRT QA done by using MapCheck.
• Physicochemical properties of the formulation ingredients under study: pKa’s, solubility, diffusion coefficient, and density. • Manufacturing properties for immediate release dosage forms. • Particle size distribution for each of the formulation ingredients. • Different flow patterns and fluid velocities for each experimental apparatus. • Interactions between the active ingredient and formulation excipients. • Microclimate pH-dependence of solubility and dissolution/precipitation. • Micelle-facilitated dissolution through the incorporation of surfac-
2.2. Ligand interactions and molecular dynamic 2.2.1. AutoDock AutoDock is an automated program employed to predict ligand and protein (bio-macromolecular targets) interactions. Continuous advancement in bimolecular X-ray crystallography helps to provide structural information of complex biomolecules such as protein and nucleic acids. These structures could be employed as targets for new drug molecules in controlling human, animal and plant diseases and disorders, and understanding of fundamental aspects of biology. Multiple steps are employed for AutoDock calculations:
tants in the media.
2.1.1.1. Uses.
• Preparation of coordinate files using AutoDock tools. • Precalculation of atomic affinities using AutoGrid. • Docking of ligands using AutoDock. • Analysis of results using AutoDock Tools.
- Calculates the fluid velocity automatically based on the instrument speed and apparatus type. - DDDPlus has an optimization module that calibrates a drug’s dissolution rate using a single experimental data set.
2.2.1.1. Coordinate file preparation. AutoDock4.2 is optimized to use a model containing protein and ligand that includes polar hydrogen atoms, but not hydrogen atoms bonded to carbon atoms. An extended PDB format, termed PDBQT, is used for coordinate files, which includes atomic partial charges and atom types. The current AutoDock force field uses several atom types for the most common atoms, including separate types for aliphatic and aromatic carbon atoms, and separate types for polar atoms that form hydrogen bonds and those that do not. PDBQT files also include information on the torsional degrees of freedom. In cases where specific side chains in the protein are treated as flexible, a separate PDBQT file is also created for the side chain coordinates. AutoDock Tools, the Graphical User Interface for AutoDock, may be used for creating PDBQT files from traditional PDB files.
2.1.2. GastroPlus (simulation software for drug discovery and development) GastroPlus is a mechanistically based simulation software package that simulates intravenous, oral, oral cavity, ocular, intranasal and pulmonary absorption, pharmacokinetics, and pharmacodynamics in human and animals. Model parameters can be fitted to data for a single record, or across multiple records simultaneously. The program will run one simulation for each record each time and it changes the values of one or more model parameters. Typically, hundreds of iterations will be performed, each with N simulations, where N is the number of records whose observations are being used to compare predicted and observed values. Objective function weighting is user-defined, and includes the most common weighting schemes [10,11]. 2.1.2.1. Uses.
2.2.1.2. AutoGrid calculation. Rapid energy evaluation is estimated by precalculating atomic affinity potentials for each atom type in the ligand molecule being docked. In this protein is embedded in a threedimensional grid and a probe atom is placed at each grid point. The AutoGrid affinity grids for every type of atom in the ligand are calculated which mainly include carbon, oxygen, nitrogen and hydrogen, as well as grids of electrostatic and desolvation potentials. In AutoDock calculation, the values of grids are used to evaluate energetics of a particular ligand configuration.
- Transporter-based drug-drug interactions. - Metabolic and/or transporter induction. - Linked with the industry's 1-ranked dissolution/absorption (ACAT) model. - Use with either compartmental or physiologically based pharmacokinetics (PBPKPlus). - Apply competitive and/or time-dependent inhibition kinetics by parent and/or metabolite. - Simulate DDIs for any species (human, beagle, rat, mouse, rhesus monkey, cynomolgous monkey, rabbit, or cat). - Account for enzyme expression level differences in various populations. - Built-in tool to easily calculate the fraction metabolized from in vitro assays.
2.2.1.3. Docking using AutoDock. Several methods are available for docking. Lamarckian genetic algorithm (LGA), is one of the most efficient method among these methods. Genetic algorithms and simulated annealing are traditional methods of docking. For typical systems, AutoDock is run several times to give several docked conformations, and analysis of the predicted energy and the consistency of results is combined to identify the best solution.
2.1.3. MapCheck The MapCheck compare absolute dose measurements of both systems with ion chamber results. It compares IMRT QA process of Sunnuclear’s MapCheck and Varian’s Portal Dosimetry.
2.2.1.4. Analysis using AutoDock tools. AutoDock Tools encompass of different techniques for analyzing the results of docking simulations, comprising tools for clustering results by conformational similarity, 205
Bulletin of Faculty of Pharmacy, Cairo University 55 (2017) 203–210
P.G. Jamkhande et al.
- It is used for Protein-Ligand Docking by using Genetic Algorithm. - Forbinding mode predictions.
visualizing confirmations, ligand protein interactions, and affinity potentials created by AutoGrid [14,15].
2.2.4. BioSuite BioSuite together utilize the functions of macromolecular sequence and structural analysis, chemo informatics and algorithms for aiding drug discovery. It is organized into four major modules containing 79 different programs making it one of the few comprehensive suites that cater to a major part of the spectrum of bioinformatics applications. The four major modules Genome and Proteome Sequence Analysis, 3D Modeling and Structural Analysis, Molecular Dynamics Simulations and Drug design, are made available through a convenient graphics-user interface along with adequate documentation and tutorials. The Genome and Proteome Sequence Analysis module of BioSuite deals with the applications relating to the analysis of the nucleic acid and protein sequences, not only of individual molecules, but also of complete genome and proteome sequences. This module would enable to annotate genomes, predict protein secondary structures, derive a phylogenetic relationship among organisms and compare two genomes for similarities at the gene or protein level. The 3D modeling and analysis module has capabilities to build, analyze and predict three dimensional structures of macromolecules and macromolecular complexes. The ‘Simulations’ module essentially simulates the behavior of a molecule, in terms of its three dimensional structure [20,21]. The Drug Design module provides the following functionalities:
2.2.1.5. Uses. - Identification of aromatic rings. - Used to explore the conformational states of a flexible ligand, using the maps generated by AutoGrid to evaluate the ligand-protein interaction at each point in the docking simulation. 2.2.2. Schrodinger Schrodinger software has wide range of applications that can solve most of the challenges these bio-molecules will bring. It highlights particular advances in molecular modeling, molecular dynamics, ligand-receptor docking, and biologics that were designed to handle these challenges. Structure based properties of molecule such as understanding of conformational changes and hydrophobicity of structures can be analyzed by this software. Confirmation of macrocycles is performed by utilizing a high-performance molecular dynamics simulation engine for bimolecular systems that combines speed and accuracy. This intern provides information atomic movements of macrocycles that further used to understand shape, stability, and energetics. Schrodinger provides powerful and intuitive graphical interfaces for system setup, running simulations, and analyzing trajectories. The molecular dynamics simulations software is employed to study a series of stabilized stapled α-helical peptides at different temperatures. The predicted α-helical propensities derived from the simulations were in good agreement with the experimentally observed circular dichroism melting curves. The local flexibility of key residues could be related to differences in affinity of the stapled peptides binding to MDM2. These simulations explore new approaches for the α-helical stapled peptides designing and development of potent inhibitors of αhelical protein–protein interfaces [16,17].
(1) Prediction of biological activities of unknown chemical entities using QSAR. (2) Identification of pharmacophores in biologically active molecules. (3) Superimposition of a set of molecules in 3D space by alignment. (4) Identification of the ligand poses in 3D space when it binds to a target using Docking. 2.2.4.1. Uses.
2.2.2.1. Use.
- Genome analyzing and sequence analyzing. - 3D modeling, simulation, structural changes, drug design, pathway modeling, SNP analysis and comparative genomics.
- Molecular dynamics simulation studies - Quantum mechanics - Prediction of binding affinity
2.3. Molecular modeling and structural activity relationship
2.2.3. GOLD (Genetic Optimization for Ligand Docking) GOLD (Genetic Optimization for Ligand Docking) is a genetic algorithm to provide docking of flexible ligand and a protein with flexible hydroxyl groups. This software uses a scoring function which is based on favorable conformations found in Cambridge Structural Database and on empirical results on weak chemical interactions. Different values of the genetic algorithm parameters are used to control the balance between the speed of GOLD and the reliability of its predictions. It gives reliable results and correct atom typing for both protein and ligand. GOLD is a part of GOLD Suite software that also includes two additional software components, Hermes and GoldMine. GOLD provides all the functionality required for docking ligands into protein binding sites from prepared input files. The Hermes visualize is used for the preparation of input files for docking with GOLD, visualization of docking results and calculation of descriptors. The input files like the addition of hydrogen atoms, including those necessary for defining the correct ionization and tautomeric states of protein residues are obtained from Hermes. The Hermes visualizer is also employed for interactive docking setup such as for defining the binding site and the setting of constraints. Gold Mine is a tool for the analysis and post-processing of docking results. GOLD will likely be used in conjunction with a modeling program to create and edit starting models [18,19].
2.3.1. Maestro Maestro is freely available, full-featured molecular visualization software. Maestro is a powerful tool for interpreting, managing, and sharing the results of computational experiments. It helps for building, visualizing, and sharing 3-dimensional chemical models. Maestro is the linchpin of Schrodinger's computational technology. It is powerful and versatile tool for the molecular modeling in the field of computational chemistry. It manages organization and analysis of obtained data. Maestro's intuitive interface makes setting up calculations easy and straightforward. The computed results are automatically returned and incorporated into projects for further study. Maestro's vast array of visualization options makes it possible to glean insight into molecular properties as well as detailed intermolecular interactions [22,23]. 2.3.1.1. Use. - Quantitative structural analysis. - Visualization of vibrational modes, molecular orbital, or electron density and molecular Properties. 2.3.2. ArgusLab ArgusLab is a molecular modeling, graphics, and drug design program for Windows operating systems. Conformational analysis such as
2.2.3.1. Use. 206
Bulletin of Faculty of Pharmacy, Cairo University 55 (2017) 203–210
P.G. Jamkhande et al.
• Identify promising lead candidates using Surflex Dock for virtual
geometry optimization study was performed on a window based computer using ArgusLab. This software works on the principle of quantum mechanics and helps to predict potential energies, molecular structures, geometry optimization of structure, vibration frequencies of coordinates of atoms, bond length, bond angle and reactions pathway. ArgusLab calculate minimum potential energy using geometry convergence function [24–26].
screening of databases of in-house or commercially available compounds.
2.3.4.1. Uses. -
2.3.2.1. Use. -
Molecular docking calculations. It is used to build molecules. Building of molecules using template structure. For molecular modeling Package.
Molecular modeling from sequence through lead optimization. Ligand Based Design. Structural Based Design. SYBYL-X Suite is also used for to build a Protein Model.
2.3.5. Sanjeevini This software is developed to provide a computational pathway for automating lead design. It utilizes bimolecular (protein) target and a candidate drug. Software is perform identification of potential active sites, docking and scores the candidate drug and returns four structures of the candidate drug bound to protein target together with binding free energies. In this software the drug molecule is uploaded with target protein. On uploading, software pops-up a window which displays the results of some essential pre-tests done based on the parameters needed for the acceptable format of the drug and protein files. The software contains following modules such as Drug Preparation, Protein Preparation, Docking and Scoring, and Protein Ligand Complex [33,34].
2.3.3. GRAMM (global range molecular matching) GRAMM software is used for protein docking. It predicts structure using atomic coordinates of the two molecules. It produces list of highscore (low-energy) ligand positions which further used as it is or refined by other techniques. This software does not use a statistical sampling, but rather performs an exhaustive search to get all configurations of the complex with the high-score steric fit. This software performs an exhaustive 6-dimensional search through the relative translations and rotations of the molecules. The molecular pairs may be two proteins, a protein and a smaller compound and two trans membrane helices etc. It is used for high-resolution of molecules for inaccurate structures in cases of large conformational changes. It is an empirical approach to smoothing the intermolecular energy function by changing the range of the atom-atom potentials. The technique locates the area of the global minimum of intermolecular energy for structures of different accuracy. Accuracy of structure decides quality of predication. Thus, the docking of high-resolution structures with small conformational changes yields an accurate prediction, while the docking of ultralow resolution structures will produce only the gross features of the complex [27–29].
2.3.5.1. Uses. - It is used for drug designing. - It predicts binding affinity. - Prediction of protein-ligand binding affinity. 2.3.6. PASS (prediction of activity spectra of substances) This software predicts possible biological activities of new pharmaceutical substance of lead molecule based on comparison of library of existing structures. PASS predicts 4366 kinds of biological activity with an average prediction accuracy of about 95%. The prediction of biological activities in PASS is described qualitatively interns of ‘yes/no’ or ‘active/inactive’. To know possible biological activities, the structure of new chemical compound is converted in 2D structural formulae. The molecular structure is represented in PASS by the set of unique MNA descriptors. The substances are considered to be equivalent in PASS if they have the same set of MNA descriptors. The PASS algorithm of biological activity spectrum prediction is based on Bayesian estimates of probabilities of molecules belonging to the classes of active and inactive compounds, respectively. The structural formula of a molecule, for which PASS prediction should be carried out, is presented as a MOL file [35–37].
2.3.3.1. Uses. - It is used for protein-protein docking and protein-ligand docking. 2.3.4. SYBYL–X Suite SYBYL-X gives information to understand and balance the competing SAR’s for each of the multiple criteria which successful drug candidate must meet. It visualizes and explores relationships between multiple properties with the analysis tools in the new Molecular Data Explorer (MDE) in SYBYL-X, and obtains insights into data in least time. It provides new ways to approach life science molecular discovery projects, while extending the unrivaled. SYBYL-X explore different insights of drug interaction mechanism with its receptor to identify potential new binding interactions that will provide ‘step jumps’ in potency, or to identify options for improving ADME or physical properties without disrupting key receptor interactions [30–32]. By using SYBYL-X, anyone can:
2.3.6.1. Uses. - Reveal new effects and mechanisms of action for known substances in corporate and personal databases. - Find new leads with given biological activity profiles among the compounds from in-house and commercial databases. - Select the most promising compounds from available samples for high throughput screening.
• Build a 3D structural model or homology model for the receptor of interest. • Identify and visualize the cavities present on target protein and the properties of protein/ligand interaction surface. • Predict and rationalize potential drug interactions with its receptor using Surflex-Dock, docking software. • Design fragment collections used for screening to perform virtual
2.4. Image analysis and visualizers 2.4.1. AMIDE (A Medical Image Data Examiner) AMIDE is developed in such a way that, it should provide multimodality volumetric medical image analysis. Data sets (e.g. PET, CT, and MRI) and regions of interest (ROI’s) are logically organized within a tree structure so that an unlimited number of these items can be displayed, modified, and analyzed simultaneously. The data hierarchy within AMIDE is built around a tree abstraction
screening of fragment libraries, and once interesting fragments are identified, to elaborate the fragment into structures or design a library of structures that will fit to a receptor cavity.
207
Bulletin of Faculty of Pharmacy, Cairo University 55 (2017) 203–210
P.G. Jamkhande et al.
- Capture and share scenes with ‘Storyboard’. - Access 2D and 3D charts, heat maps and more.
composed of a succession of objects such as data sets and ROI’s each object in AMIDE is assigned its own Euclidean space, and the location of this local coordinate frame is defined with respect to the global coordinate frame [38,39]. The following object types have been implemented in AMIDE:
2.4.3. Imaging software Scge-Pro SCGE-Pro is widely used for single cell gel electrophoresis or Comet assay. It is a collaborative project with Computer Division on development of imaging software for cytogenetic and DNA damage analysis. Genotoxicity of environmental factors such as low and high LET radiations, drugs, chemical mutagens and carcinogens is investigated by employing Comet assay. In this imaging method fluorescence in-situ hybridization (FISH) technique is used to measure gene specific repair in relation to total DNA or loss of heterozygosity (LOH) for single gene. An intracellular DNA damage in different cell as well as repair kinetics of eukaryotic cell is investigated through these assays. Studies such as effect of 3.3 MeV proton beams on DNA damage of mouse peripheral blood leukocytes is carried out using Neutral Comet assay [42,43].
• Study the root object in AMIDE, this object is used for grouping a set • • •
of related medical images and ROI’s into a logical unit, and keeps track of parameters that affect the whole study. Data set used for encapsulating volumetric medical images, this object contains the raw image data along with information needed for interpreting that data (voxel sizes, color table, thresholds, patient weight, injected dose, calibration factors, etc.). ROI region of interest objects specify a volume of space over which statistics are to be calculated. Currently implemented ROI’s are ellipsoids, boxes, cylinders, and is contours (2D or 3D). Fiducial Marker Fiducial reference markers encode only a location in space and are used forrigid body registration of data sets.
2.4.3.1. Uses. 2.4.1.1. Uses. - Clinical application such as prenatal diagnosis, DNA repair deficiency syndrome, diabetes, cancer susceptibility, genomic instability. - Human bio-monitoring: Aging and nutrition. - Environmental bio-monitoring: Aquatic or terrestrial conditions. - Genotoxicity evaluation of radiation and chemicals in human and animal models. - Clinical and molecular epidemiology, agricultural sciences, radiation biology.
- Provides multi-modality medical image analysis to the molecular imaging research community. - Gives interactive “wizard” interfaces for making advanced medical imaging algorithms (e.g. factor analysis and cardiac polar maps). 2.4.2. Discovery Studio Visualizer Discovery Studio Visualizer (DS Visualizer) is used for viewing, sharing and analyzing protein and small molecule data. It is a free and employed for both small molecule and macromolecule applications. It allows data to be transferred and analyze data in several formats like graphics, 3D structures, SMILES and sequences. The required structures and sequence can be downloaded from PDB or NCBI. Molecular properties can be explored by editing structures and performing calculations [40,41].
2.4.4. Xenogen living image software Wave Metrics IGOR Pro1, a powerful data analysis and programming tool is used for Xenogen Living Image Software. The software forms custom environment which is employed for acquisition and analysis of data. Macintosh® and Windows® both supports the software functioning. The working of software include an image acquisition control panel, image display and analysis window, system status and dialog window, and a lab book window. Software tools are present at the top of menu bar for both IGOR Pro and Living Image software. During Igor Pro software running remaining menu items that support Living Image software remains inactive to avoid interface clutter and confusion. Software shows a unique image window display that appears when a Living Image data set is opened or acquired. The working part of window shows pseudo color image referred to as the luminescent or fluorescent image overlaid on a photographic image. The software works similarly for luminescent image and fluorescent images unless otherwise specified. The analysis tool is present at the top of image that control image display and its measurements. The color bar is present on right side of image and shows relationship between the pseudo colors in the image and the numerical values of the image data. The window display shows labeling information generated by both the user and the imaging system at the bottom side that explains use of the individual controls found in the image window [44,45].
2.4.2.1. Uses. Visualization: - Advanced molecular visualizations. - Publication quality graphics. Macromolecule design: - Multi-domain protein sequences (e.g. Antibodies) editing. - Prediction of secondary structures. - Superimpose and edit protein structures. Ligand-based design: - Sketching and fragment building tools. - Generation of pharmacophores. - Flexibly overlay ligands. Structure-based design: - Define, display and edit ligand binding sites. - Create 2D ligand-receptor interaction diagrams. - Monitor non-bond interactions including favorable, unfavorable and unsatisfied interactions.
2.4.4.1. Use. - In vivo imaging application. - Low light-level imaging such as sensitivity and binning, measurements and calibrations, background sources of light, and dark charge management.
Display a range of molecular surface properties including: - H-bonds, charge, ionizability, lipophilicity, aromaticity and solvent accessibility. - Visualize 3D molecules in Microsoft Office© and web pages (ActiveX Control).
2.5. Data analysis 2.5.1. GeneSpring GeneSpring gives information related to terminology used to refer to 208
Bulletin of Faculty of Pharmacy, Cairo University 55 (2017) 203–210
P.G. Jamkhande et al.
gene and using multiple reference genes for normalization [49,50].
various organizational elements in the user interface and supplies a high-level overview of the data and analysis paradigms available in the application. This software represents a collection of samples for which arrays have been run in order to answer a specific scientific question. In this, a new experiment is created from selected project. New experiment by loading samples of a particular technology and performing a set of customary pre-processing steps like, normalization, summarization, and baseline transform etc. which will convert the raw data to a state where it is ready for analysis. Multiple samples are involved in the experiment with which it was created, multiple interpretations, which group these samples by user-defined experimental parameters, and all other objects created as a result of various analysis steps in the experiment. The software consists of three parts, a UI layer, a database and a file system. The file system is where all objects are stored physically. These are stored in the app/data subfolder in the installation folder. A SQL database carries all annotations associated with the various objects in the file system (properties like notes, names etc. which can be searched on); a database is used to drive fast search. Finally, the UI layer displays relevant objects organized into projects, experiments and analysis etc [46].
2.5.3.1. Use. - Determine whether a significant difference exists between samples and controls. 2.6. Behavioral study 2.6.1. Ethowatcher Behavioral change is considered to be major parameter to diagnose range of disorders. Complex behaviors of experimental animal are associated with morphological and physiological changes. These changes are often recorded in laboratory or free-ranging animals for many purposes relevant to biological or biomedical research such as ecology, physiology, neurosciences, psychology, genetics, pharmacology and pathology. Advanced automated techniques selectively record behaviors indirectly by detecting their consequences through the activation of pressure or infrared sensors or by image processing techniques such as those derived from video-tracking analysis. Wide range of information can be easily obtained using video-tracking analysis which includes locomotor activity changes such as the frequency and the time spent in ambulation, velocity of movement, and horizontal position. Ethowatcher is based on C++ language and under C++ builder 5.0 environments. This software is integrated tool to build and save behavioral changes, used for ‘real-time’ behavioral scoring (like directly from the ongoing events in the environment or from analog video files) or ‘off-line’ behavioral recordings (from digital video files). The obtained digital video file may be processed for automated extraction of activity-related parameters (distance traveled, angle, velocity, approximate object area, track graph) and object (animal) tracking using digital image processing techniques. The software provides time-segmented reports on sequence, duration, frequency and latency of the scored behaviors, and on the activity related-indices and further these reports are synchronized by the same time source [51].
2.5.1.1. Use. - Batch effect correction. - Circular binary Segmentation. - Filters to identify copy-neutral LOH events and regions of allelic imbalance. - Identify common variations across a set of samples. 2.5.2. QSARPro This software identify of relationship of a molecular activity or property with the structural parameters, analysis of such relationships and rapid predictions using reliable statistical modeling. It is employed to evaluate more than 1000 molecular descriptors including physicochemical, topological and electro-topological, information theory based, quantum mechanical, electrostatic and hydrophobic, alignment independent, MMFF atom types and so on. QSAR modeling typically involve activities such as descriptor choice and calculation, statistical evaluation of the calculated descriptors, training and test set assignment, regression and results analysis. It evaluate multiple options for classes of descriptors, test set, choice of linear or nonlinear regression and choice of regression technique to determine the option that is most suitable to a particular project [47,48].
2.6.1.1. Uses. - Validation of a tool for behavior analysis in laboratory animal. - Video-tracking analysis in laboratory animals. 2.6.2. MARS (Multimodal Animal Rotation System) MARS is a Multimodal Animal Rotation System which captures 360° movement of an experimental animal. The software is designed in such a way that it automatically rotates a mouse to the required positions or angels to track all the relevant molecular and anatomical information of experimental animal. It also captures optical signals generated due to orientation of experimental. Using this software automatic co-registration and capturing of multimodal and multispectral data sets from all acquired angles is possible. The software amplifies obtained signal sensitivity by quantifying the perfect image or exporting complete rotation movements or video. This software includes animal rotation device, controlling software, and multimodal visualization and co-registration software [52].
2.5.2.1. Use. - Explore and exercise various combinations of variable selection methods and regression methods. - Aligning given set of molecules in the protein active site with respect to the co-crystal ligand to develop a basis for the placement of ligand. - Protein-protein interaction studies.
2.6.2.1. Use.
2.5.3. REST 2009 Software REST 2009 Software is a single tool for analysis of gene expression data from quantitative and real-time PCR experiments. The analysis or quantitation of relative gene expression uses expression of reference genes to normalize expression levels of genes of interest (GOI) in different samples. This method allows quantitative PCR data to be adjusted, for example to compensate for variations due to sample loading differences. This software uses a mathematic model which takes into account the different PCR efficiencies of the gene of interest and reference genes. The reliability of results is enhanced by comparing single reference
-
Cell tracking. Enzyme activity. Bone disease. Inflammatory disease. Nanoparticle tracking and delivery.
3. Conclusion In this review, we have discussed different software based 209
Bulletin of Faculty of Pharmacy, Cairo University 55 (2017) 203–210
P.G. Jamkhande et al.
[18] http://www.ccdc.cam.ac.uk/Solutions/GoldSuite/Pages/GOLD.aspx (accessed 20. 12.16). [19] E. Yurieva, M. Agostinoa, P.A. Ramsland, Challenges and advances in computational docking: 2009 in review, J. Mol. Recogn. 24 (2011) 149–164. [20] http://www.serc.iisc.ernet.in/facilities/ComputingFacilities/software/biosuite. html (accessed 25.12.16). [21] The NMITLI-BioSuite Team, BioSuite: a comprehensive bioinformatics software package (A unique industry–academia collaboration), Curr. Sci. 92 (2007) 29–38. [22] https://www.schrodinger.com/Maestro (accessed 10.12.16). [23] K. Sabitha, S.K.M. Habeeb, Molecular modeling and drug discovery of potential inhibitor for anticancer target gene melk (Maternal Embryonic Leucine Zipper Knase), Int. Res. J. Pharmacy 2 (2011) 141–145. [24] http://www.arguslab.com/arguslab.com/ArgusLab.html (accessed 12.12.16). [25] A. Naz, K. Bano, F. Bano, N.A. Ghafoor, N. Akhtar, Conformational analysis (geometry optimization) of nucleosidic antitumor antibiotic showdomycin by Arguslab 4 Software, Pak. J. Pharm. 22 (2009) 78–82. [26] G.E. Mathew, S. George, M. Shamnas, V.B.A. Raj, Isolation, in silico design and antiinflammatory activity of spirosolenol from the roots of Solanumanguvi, Chem.Sci. J. (2012) CSJ 83. [27] http://vakser.bioinformatics.ku.edu/main/resources_gramm1.03.php (accessed 15. 12.16). [28] P.J. Kundrotas, I.A. Vakser, Accuracy of protein-protein binding sites in high throughput template-based modeling, PLoS Comput. Biol. 6 (2010) 1–10. [29] N.L. Devi, S.P. Mikilli, Homology modelling, molecular dynamics simulation and docking studies of HSP 105 of cystic fibrosis with the target protein HSP 70, Biomirror Open Access J. 4 (2013) 102–108. [30] http://www.certara.com/products/molmod/sybyl-x (accessed 12.12.16). [31] A. Dubey, S.S. Kalra, Computational comparative modeling and visualization for HIV1 and HIV2 proteins via the software SYBYL-X, Int. J. Sci. Res. Publ. 3 (2013) 2250–3153. [32] G. Xu, Y. Chen, K. Shen, X. Wang, F. Li, Y. He, The discovery of potentially selective human neuronal nitric oxide synthase (nNOS) inhibitors: a combination of pharmacophore modelling, CoMFA, virtual screening and molecular docking studies, Int. J. Mol. Sci. 15 (2014) 8553–8569. [33] http://www.scfbio-iitd.res.in/sanjeevini/sanjeevini.jsp (accessed 12.12.16). [34] B. Jayaram, T. Singh, G. Mukherjee, A. Mathur, S. Shekhar, V. Shekhar, Sanjeevini: a freely accessible web-server for target directed lead molecule discovery, BMC Bioinformatics 13 (2012). [35] http://www.genexplain.com/pass (accessed 10.12.16). [36] R. Pramely, L.S. Raj, Prediction of biological activity spectra of a few phytoconstituents of Azadirachta indicia A. Juss. J. Biochem. Tech. 3 (2012) 375–379. [37] R. Azhaguraj, M.C.J. Milton, J. Ganesh, J.G.Z. Kumar, M. Ramakrishnan, S. Antony, Prediction of biological spectra for secondary metabolites from marine macroalgae CaulerpaSpp (Chlorophyta Caulerpals), Int.Res. J. Pharmacy 5 (2012) 320–323. [38] A.M. Loening, S.S. Gambhir, Amide: a free software tool for multimodality medical image analysis, Mol. Imaging 2 (2012) 131–137. [39] http://www.scripps.edu/olson/forli/autodock_flex_rings.html (accessed 12.12.16). [40] S.M.D. Rizvi, S. Shakil, M. Haneef, A simple click by click protocol to perform docking: Autodock 4.2 made easy for non- Bioinformaticians, Excli. J. 12 (2013) 831–857. [41] http://accelrys.com/products/discovery-studio/visualization-download.php (accessed 20.12.16). [42] http://Www.Researchgate.Net/Publication/228896381_Use_Of_In- House Developed Imaging Software Scge Pro. (accessed 25.12.16). [43] R.C. Chaubeya, H.N. Bhilwadea, R. Rajagopalanb, S.V. Bannurc, Gamma ray induced DNA damage in human and mouse leucocytes measured by SCGE-Pro: a software developed for automated image analysis and data processing for Comet assay, Mutat. Res./Genet. Toxicol. Environ. Mutagenesis 490 (2001) 187–197. [44] www.xenogen.com (accessed 15.12.16). [45] X. Xie, W. Xia, Z. Li, H. Kuo, Y. Liu, Z. Li, Targeted expression of BikDD eradicates pancreatic tumors in noninvasive imaging models, Cancer Cell. 12 (2007) 52–65. [46] http://www.genomics.agilent.com/en/Microarray-Data-Analysis-Software/ GeneSpring GX/?cid=AG-PT-130 & tabId=AG-PR-1061 (accessed 20.12.16). [47] http://www.vlifesciences.com/products/QSARPro/Product_QSARpro.php (accessed 12.12.16). [48] T. Hung, W. Lee, K. Chen, Y. Chan, C. Lee, C.U. Chen, In silico investigation of traditional Chinese medicine compounds to inhibit human histone deacetylase 2 for patients with Alzheimer’s disease, BioMed. Resear. Int. 1–15 (2014). [49] www.qiagen.com (accessed 25.12.16). [50] Y. Ismail, S. McCormick, M. Hijri, A fungal symbiont of plant-roots modulates mycotoxin gene expression in the pathogen Fusariumsam bucinum, PLoS One 6 (2011). [51] C.F.C. Junior, C.N. Pederiva, R.C. Bose, ETHOWATCHER: validation of a tool for behavioral and video-tracking analysis in laboratory animals, Comput. Biol. Med. 42 (2012) 257–264. [52] www.bruker.com (accessed 15.12.16).
approaches that are playing major role in the drug designing and drug discovery now days. Successful implementation of software based techniques provided an opportunity for the in vitro identification of biologically active agents, without bias towards known hits or leads. New methods such as docking also help to unravel multifarious mechanisms underlying complex target ligands interaction. Significant advances and application of new softwares continue to be made in the field of pharmacokinetic and pharmacodynamic are benefitting the process of drug discovery. This intern enhances drug discovery and cost woes of the several biochemical industries. Several previous examples of drugs like indinavir, the HIV protease inhibitor that are output of software based drug discovery will serve as the ultimate proof that the software and software based approaches can indeed be used to assist the costly, complex and highly challenging drug designing and discovery process. Conflict of interest The authors declare no conflict of interest. Acknowledgement The authors gratefully acknowledge facilities from School of Pharmacy, Swami Ramanand Teerth Marathwada University Nanded, Maharashtra, India. This research did not receive any specific grant from funding agencies in the public, commercial, or not-for-profit sectors. References [1] L.G. Ferreira, R.N. Santos, G. Oliva, A.D. Andricopulo, Molecular docking and structure-based drug design strategies, Molecules 20 (2015) 13384–13421. [2] G. Sliwoski, S. Kothiwale, J. Meiler, E.W. Lowe, Computational methods in drug discovery, Pharmacol. Review 66 (2014) 334–395. [3] H. Kimko, J. Pinheiro, Model-based clinical drug development in the past, present and future: a commentary, Br. J. Clin. Pharmacol. 79 (2014) 108–116. [4] S.K. Gill, A.F. Christopher, V. Gupta, P. Bansal, Emerging role of bioinformatics tools and software in evolution of clinical research, Perspect. Clin. Res. 7 (2016) 115–122. [5] R.A. Hodos, B.A. Kidd, K. Shameer, B.P. Readhead, J.T. Dudley, In silico methods for drug repurposing and pharmacology, computational approaches to drug repurposing and pharmacology, WIREs Syst. Biol. Med. 186 (2016). [6] T. Liu, D. Lu, H. Zhang, M. Zheng, H. Yang, Applying high-performance computing in drug discovery and molecular simulation, Natl. Sci. Rev. 3 (2016) 49–63. [7] M.J. Wasko, K.A. Pellegrene, J.D. Madura, C.K. Surratt, A role for fragment-based drug design in developing novel lead compounds for central nervous system targets, Front. Neurol. 6 (2015) 1–11. [8] http://www.simulations-plus.com/Products. aspx?DDDPlus & grpID=2 & cID=14 & pID=14. (accessed 10.12.16). [9] M. Almukainzi, A. Okumu, H. Wei, R. Lobenberg, Simulation of in vitro dissolution behavior using DDDPlus™, AAPS Pharmascitech. (2014) 1–2. [10] http://www.simulationsus.com/Products. aspx?GastroPlus & grpID=3 & cID=16 & pID=11. (accessed 12.12.16). [11] T.S. Honorio, E.C. Pinto, H.V.A. Rocha, V.A.D. Esteves, T.C. Santos, H.C.R. Castro, In vitro–in vivo correlation of efavirenz tablets using GastroPlus®, AAPS PharmSciTech. 14 (2013) 1244–1254. [12] www.sunnuclear.com (accessed 25.12.16). [13] P.A. Jursinic, R. Sharma, J. Reuter, MapCHECK used for rotational IMRT measurements: step-and-shoot, tomotherapy, rapid arc, Int. J. Med. Phys. Res. Pract. (2010) 37. [14] http://www.scripps.edu/olson/forli/autodock_flex_rings.html (accessed 12.12.16). [15] S.M.D. Rizvi, S. Shakil, M. Haneef, A simple click by click protocol to perform docking: Autodock 4.2 made easy for non- Bioinformaticians, Excli. J. 12 (2013) 831–857. [16] http://www.schrodinger.com (accessed 10.12.16). [17] B. Dineshkumar, P.V. Kumar, S.P. Bhuvaneshwaran, A. Mitra, Advanced drug designing softwares and their applications in medical research, Int. J. Pharmacy Pharm. Sci. 2 (2010) 16–18.
210