annotation for the values, which can then be exploited by rules that define valid and invalid ..... [2] Y. Ahmad, T. Antoniu, S. Goldwater, and S. Krishnamurthi.
Software Engineering for Spreadsheets Martin Erwig Oregon State University
Abstract Spreadsheets are widely used end-user programming tools. Since many critical decisions are made based on values computed by spreadsheets, the correctness of spreadsheets is crucial. The application of tried and tested software engineering principles to spreadsheets seems to promise help with the construction and maintenance of dependable spreadsheets. However, can we really make this practical for end users? In this article we demonstrate with two examples, type checking and debugging, that we can exploit the idiosyncratic structure of spreadsheets to successfully translate these concepts to an end-user programming domain. We argue that the simplified computational model and the rich context information provided by the spatial embedding of formulas allow, in particular, the simplification of these concepts, which ultimately leads to effective tools for end users.
1
Introduction
Software engineering provides principles and tools that can help with the creation and maintenance of sotfware, which is generally a difficult and error-prone undertaking. The adoption of software engineering in the domain of end-user programming is complicated by the observation that end users, who often do not have formal training in computer science or programming, do not not take an interest in software development in itself, but rather resort to programming to to get their job done. Can we expect under these circumstances end users to employ elements of software engineering in their work? Or isn’t software engineering for end users rather a distraction that only takes away precious end-user time? This critical viewpoint focuses only on the costs of software engineering and ignores the potential benefits, such as, increased reliability and maintainability and overall improved quality of the developed software, which can then be expected to deliver much better results. Moreover, the skepticism implicitly assumes that employing software engineering principles must always be complicated and time consuming. In this article, we want to illustrate that this does not have to be the case. In particular, we demonstrate how we can integrate in the context of spreadsheets simple and easy-to-use, but effective tools to make powerful software engineering methods accessible to end users.
1
We will show that the spreadsheet domain does not only pose challenges for the integration of software engineering ideas, but also presents unique opportunities due to its idiosyncratic programming model. As an example, we will demonstrate how the often daunting tasks of type checking and debugging can be turned into simple and effective tools that can support end users in their work with spreadsheets. We have picked type checking since it is widely considered as a very technical and hard-to-understand process. Anyone who has seen a Haskell type error message for the first time knows how frustrating type error messages can be even to professional programmers. If we can get type checking to work for end users, this would certainly be a case in point for the viability of end-user software engineering. Similarly, debugging is usually long and tedious process that typically involves single-stepping through code, setting breakpoints, and monitoring the evolution of values for a collection of variables. If we can turn debugging into a simple activity that consists only of a few steps to reliably remove errors from spreadsheets, this would also demonstrate the feasibility of end-user software engineering.
2
Label-Based Type Checking
The purpose of a type checker is to find incorrect applications of operations, such as the multiplication of a number and a string. Applying operations to wrong arguments is a serious programming error. Most insidious are cases that do actually not lead to runtime errors, but produce incorrect results that may become the basis of wrong decisions. This aspect of unnoticed type errors is of particular relevance in spreadsheet systems like Excel. These systems often do distinguish between basic types, such as numbers and string, and also perform some minimal form of type checking for these types. However, features to define and manage more refined and more application-oriented notions of types are missing, and thus the support for end users in finding or avoiding errors in formulas is rather primitive. In fact, many spreadsheets contain large amounts of numbers, which the spreadsheet system allows to be combined in formulas in arbitrary, unrestricted ways, even though the numbers represent quantities that shouldn’t be combined at all or only in specific ways. An application-specific notion of types and a corresponding method of checking them could potentially be very useful in finding errors.
2.1
Reasoning about Labeled Values
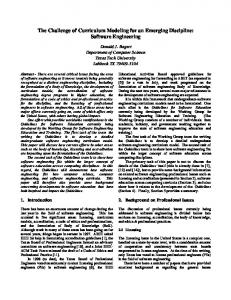
Consider the spreadsheet in Figure 1 that shows a simple table with harvesting data for different kinds of fruits in different months. The total in cell B5 is computed by the formula B3+B4, which seems correct in the context of this spreadsheet since it is adding numbers that represent the harvested apples in two months. In contrast, consider the two alternative formulas B3+C4 and B3+D4. From a traditional typing perspective there is nothing wrong with these formulas since they are both adding numbers. However, we would not consider 2
Figure 1: A spreadsheet containing harvest data
either one of them to be correct, because the formula for the total of apples should not include oranges (C4) or a total of all fruits for a particular month (D4). The basis for this line of reasoning is provided by the use of labels (“Apple”, “Orange”, etc.) in particular cells. These labels indicate a particular meaning of the numbers in cells, such as B3 (“Apples harvested in May”) or C4 (“Oranges harvested in June”) and thus constrain what is considered to be a reasonable formula for, say the total number of apples. The labels in the spreadsheet define an application context into which the numbers are embedded, and the spatial relationship between labels and numbers can be interpreted as an application-specific type annotation for the values, which can then be exploited by rules that define valid and invalid combinations of annotated values to find errors in formulas. We have introduced such a typing concept based on labeled data in [1], and we have identified rules that formalize the reasoning about the correctness of formulas that involve labeled values. Several observations about label structures that typically occur in spreadsheets make the definition of a labeled-value reasoning system a non-trivial endeavor. • Values can have more than one label. For example, B3 is labeled by “Month” and “Apple”. • The labeling relationship exhibits, in general, a hierarchical structure. For example, B3 is labeled by “Apple”, and B2 and C2 are both labeled by “Fruit”, which leads to nested or hierarchical labels, such as “Fruit.Apple” or “Fruit.Orange”. • Some combinations of labels are considered to be invalid. For example, while it is reasonable for a value to be labeled by both, “Month” and “Apple”, it does not make sense for a value to be labeled by “Apple” and “Orange” at the same time. The last observation provides the basis for a method of identifying errors in formulas, which works as follows. Each operation has associated with it a well-defined behavior for transforming the labels of its arguments. These label transformations produce a result label for each formula in the spreadsheet. The 3
resulting label will then be simplified and brought into a normal form. This normalization step includes validity checks, and if the normalization fails, the formula is not label correct, that is, an error has been found. For example, when two values are added, their labels are combined into a union label that says that the resulting value is characterized to some degree by both of the argument labels. In the example spreadsheet from Figure 1, the formula B3+B4 would be labeled as “May or June”, which says that the resulting number (here: 25) is a quantity that represents apples harvested in either May or June. Similarly, the total for cell D3 expressed by the formula B3+C3 would be labeled as “Apple or Orange”, which says that the resulting number (here: 26) is a quantity that represents either apples or oranges harvested in May. But doesn’t that contradict what we said earlier, namely we that it is not valid to label a value by “Apple” and “Orange” at the same time? The key aspect here is how labels are combined. The formula B3+C3 generalizes the labeling, that is, it computes a number of fruits, which is formally captured by a rule that expresses relationships that exploit hierarchical labels, such as Fruit.Apple + Fruit.Orange = Fruit. Since Apple and Orange are labels that characterize one specific aspect of the value labeled, it makes sense to add values of different labels of that category and form a union of the labels, which amounts to placing the values in one bag. In contrast, it would not make sense to add a value labeled May and a value labeled Apple since the labels are not part of the same category. In the example spreadsheet, values are labeled along two independent dimensions, Fruit and Month. The month in which the harvesting took place represents a different, independent aspect of the value, which has a number of implications. First, labels from that category (“May” and “June”) can be generalized similarly to fruits (as was indicated above by the formula B3+B4). Second, labels from different categories cannot be combined in a generalization step. This is why a label, such as “May or Apple” is considered an error. Third, it follows that the labels attached to a value or formula are related to one another in two principal different ways that affect their transformation: They can be part of the same category or they can be orthogonal. Therefore, it would not make sense to label a value “Apple and Orange” since this would correspond to attaching the Fruit dimension twice to the value and label it Apple in one instance and Orange in the other, which would be a contradiction and is therefore considered to be an error. Using these principles for reasoning about labeled values and formulas, we can identify errors in spreadsheet formulas, in particular, wrong references and illegal or omitted components in aggregation formulas. Before we show how errors can be identified, we would like to mention that other researchers have adopted and extended the rules to account for reasoning about that distinguishes between different kinds of relationships that can be expressed by labels (“is-a” vs. “has-a”) [2], or have integrated [3] reasoning about the labels of values with reasoning about their units of measurements [4, 5].
4
2.2
Finding and Reporting Errors
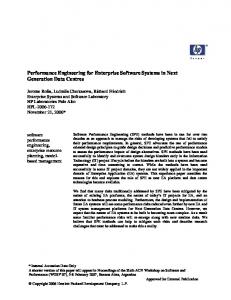
We have implemented a tool as an add-in to Excel that implements the described reasoning rules. After inferring the labels for cells based on the spatial arrangement in the spreadsheet, the tool applies the reasoning and label normalization rules and colors cells in the spreadsheet that might contain errors [6]. Primary error cells are colored in orange. These error cells are those that violate any of the labeling rules and that do not reference other error cells. Such secondary, or dependent, error cells are colored in yellow. The reason for making this distinction is that after fixing primary error cells, secondary errors often disappear automatically because their errors can result from the troublesome label they refer to in their formula. Two examples of error feedback are shown in Figure 2.
Figure 2: Summation and reference errors identified with the help of labels
The first error results when the summation formula in B5 includes not only B3 and B4, but also B2. This can easily happen when during the construction of a formula the user extends the range of a SUM operation a little to far. In this case the label of B2, which is simply “Fruit”, cannot be combined with the labels of the other two arguments into a normal form. The total in D5 refers to cell B5 an thus inherits the 5
unresolvable label. Since this error is dependent on the one in B5, it is shown with a yellow background. The second error results because the user has placed a direct reference to C3 into cell B4, which leads to a label error because by way of its position the number in cell B4 represents apples harvested in June, whereas by way of the referenced value it also should represent oranges harvested in May. Since, as discussed before, a value cannot represent apples and oranges at the same time, the formula is considered to be an error. The errors that result in the three dependent total cells are again shown with a yellow cell background. As can also be seen in this example, additional information about potential sources of errors are, when available, produced as comments for cells.
2.3
Usability
When contemplating about end-user programming it is important to realize that end users do not view programming in an end in itself, but rather as a means to an end. Any tool for an end-user programming environment has to acknowledge that the primary objective of end users is to get their jobs done. Therefore, one cannot expect end users to invest much, or even any, additional effort on their programs to obtain some feedback whose value they might not even be sure about. In the context of the described label-based type checking approach this means that we cannot expect end users to explicitly label cells in addition to the data they have filled in already in the spreadsheet. If we want to exploit label information for reasoning about formulas, we rather have to infer the label information automatically from the spreadsheet. As we have shown in [7] this can actually be done quite effectively by exploiting the spatial relationships among cells that carry numerical data and labels. Through a variety of heuristics that are based on relative positions and distances of labels to one another and to the data intended to be labeled a quite accurate data labeling can be derived. This spatial analysis can be integrated with the reasoning rules for labeled formulas into a system that can automatically, with one mouse click, perform a label-based type checking of spreadsheets [6]. Another question is whether end users can work successfully with a system that implements a labelbased type checker for spreadsheets, that is, can end users employ the feedback from the type checker to improve their spreadsheets, in particular, can they effectively remove errors from formulas? As we have shown in a user study, this is indeed the case [8]. In that study most users were guided in their debugging efforts by the orange-colored cells. They fixed the erroneous cell(s) and reran the type checker to potentially uncover additional faults in other formulas. But not only could users of the type checker effectively remove errors, they also talked and reasoned about faults in formulas in terms of labels in the spreadsheet, the same labels that the type checker uses to identify errors. In the end, this fact is not too surprising since the labels used by the type checker are the ones put in by users, the creators of the spreadsheet, in the first place. Nevertheless, this is still an interesting observation, because it indicates a successful strategy to bringing software engineering methods 6
to spreadsheets, namely through leveraging redundant information volunteered by users.
3
Semi-Automatic Debugging
The debugging of programs, the process of finding and removing faults, is a tedious and time-consuming procedure. For example, one study found that it takes on average 17.4 hours to find and fix a software bug [9]. One reason why debugging takes so much time is the nature of the debugging process. Typically, programmers have to set break points, observe how values of variables evolve, and step on a fine-grained level through a program to locate the source of a fault. In many cases, this process has to be repeated many times when the break points have not been placed at the right positions or when not all the relevant variables have been monitored. On top of that, once a fault has been located, it is not always obvious how to fix it, and there is the danger of introducing new faults while trying to fix an existing one. We can address both of these challenges and devise a fast and effective debugging approach by employing the following two ideas. First, invert the search direction for faults, that is, search backwards from failures to faults, and second, propagate expected values alongside, and thus automatically derive suggestions for program changes that will eliminate the failure. From a spreadsheet user’s perspective this process looks as follows. A user observes an unexpected value in a particular cell. A key aspect at this point is that in order to judge the value that is computed in a cell to be incorrect, a user must know what the correct value should be. This is the value that he or she expects to see in the cell. Now instead of just marking the cell as incorrect, the user can provide the information about the expected value to the debugging system. The system then propagates the expected change from the old, incorrect value to the new, expected value backwards over the formula to its arguments and referenced cells to derive formula changes. How does this propagation and the derivation of changes work? Consider a cell that contains a constant, say 5. If the expectation for that cell is 10, we can immediately derive the change of constant 5 to constant 10 from this information, and the reasoning stops. Now suppose the cell contains the formula A2+2, which still evaluates to 5, and the expected value is again 10. There are several potential changes that can be derived in this situation. One possibility is to replace the whole formula by the constant 10, but this change is considered to be unlikely the correct change since it eliminates a computation. Another change would be to replace 2 by 7, which would lead to the formula A2+7. In this example we can propagate the numerical difference (5) between the expected and the actual value to one of the arguments because the employed operation in the formula is +. For other operations, different propagations must be used. For example, if the formula were A2*2, the factor 2 would have to be replaced by 4 to yield 10. Coming back to the original formula A2+2, we could also change the other argument of the + operation. In fact, there are at least three possibilities to do this. First, we could directly change the reference to A2 by the constant 8. Again, that change would not be considered a likely candidate since it changes 7
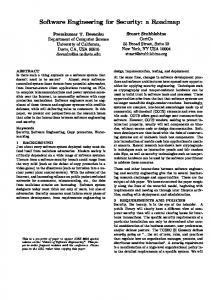
the model represented by the spreadsheet. Second, we could propagate the expected change for the value computed in A2 (which is 3), to the formula in A2. The expected change for A2 is again derived from the expected value and the fact that A2 is an argument of a + formula, that is, A2 needs to be 8 for the formula A2+2 to yield 10. So if A2 contains a constant (which must be 3 then), the propagation would result in changing 3 to 8, or if A2 contains another formula, we recursively perform the propagation and change inference with the expected value 8. A third possibility is to change the reference to A2 into one to another cell. Suppose, that cell A3 evaluates to 8. In this case, we can generate the suggestion to change A2 to A3 in the formula. As a concrete example consider again the spreadsheet in Figure 1. Suppose the formula in cell D4 was incorrectly entered as B3+C4 (instead of the correct B3+C3), which would produce a total value of 30 (instead of 26). Using the spreadsheet debugger presented in [10] that implements the described approach, the user would mark cell D4 as incorrect and supply 26 as the expected value for that cell. The system would then contemplate potential changes to the formula that would cause it to evaluate to 26. Changes can generally be suggested for different cells, because the fault does not necessarily have to be in the cell in which the failure was observed. In this example, changes are reported in three cells: In C4 it is suggested to change 13 to 9, and in B3 it is suggested to change 17 to 13. Both of these suggestions are, however, ranked lower than the ones for cell D3 (and are therefore, shaded yellow). The cell with the most highly ranked suggestions is shaded orange, and that is where users should start looking. In the bug report for D3 shown in Figure 3 two changes are suggested, of which the second one is the correct one. The user can select the change, which will then be automatically applied to the formula in the cell.
Cell D3 In formula: =B3+C4 change B3 to C4 change C4 to C3 Ignore
More ...
Figure 3: Change suggestions generated from value expectation
In this very simple spreadsheet only 4 change suggestions are generated. However, in general, the number of possible changes that can change the outcome of a particular cell is enormous, even in spreadsheets of moderate complexity. It is therefore very important to find ranking heuristics that will place the correct 8
change suggestion as high up as possible. In [11] we have described several heuristics that can improve the accuracy of the suggested changes. Using a systematic mutation-testing approach [12] we found that in 80% of the cases the correct change will be reported among the top five suggestions.
4
Conclusions
The two presented examples illustrate that it is indeed possible to successfully apply software engineering principles and tools in an end-user domain. (We have also demonstrated how to apply methods of program generation and software design in the area of spreadsheets [13, 14, 15], but for lack of space we cannot elaborate on these ideas here.) Two aspects of spreadsheets, in particular, have supported the successful adaptation, namely, (1) the limited expressiveness of the formula language and (2) the spatial embedding of computation through the placement of formulas in a two-dimensional grid. The lack of recursion limits the number of formula changes to be considered in the change inference needed for goal-directed debugging. The spatial embedding provides a basis for heuristics that can be exploited for the automatic derivation of labeling information and for dramatically improving the ranking accuracy of change suggestions in the goal-directed debugging process. What lessons can be learned from the spreadsheet examples that could help to apply software engineering principles to other domains of end-user programming? First, a restricted model of computation can simplify the reasoning mechanisms on which software engineering tools are based. The results of such reasoning can often be presented and explained more easily to end users. Second, redundant information and context information, that is, information that is not strictly needed for computations, can often be exploited to derive constraints on computations. These constraints can the be employed to identify errors. The growing number of end users performing more and more programming tasks in a diverse set of areas poses the challenge for computer science to support them. Adapting proven software engineering methods to end-user domains is one imortant way of providing such support.
References [1] M. Erwig and M. M. Burnett. Adding Apples and Oranges. In 4th Int. Symp. on Practical Aspects of Declarative Languages, LNCS 2257, pages 173–191, 2002. [2] Y. Ahmad, T. Antoniu, S. Goldwater, and S. Krishnamurthi. A Type System for Statically Detecting Spreadsheet Errors. In 18th IEEE Int. Conf. on Automated Software Engineering, pages 174–183, 2003. [3] Michael J. Coblenz, Andrew J. Ko, and Brad A. Myers. Using Objects of Measurement to Detect Spreadsheet Errors. In IEEE Symp. on Visual Languages and Human-Centric Computing, pages 314– 316, 2005. 9
[4] T. Antoniu, P. A. Steckler, S. Krishnamurthi, E. Neuwirth, and M. Felleisen. Validating the Unit Correctness of Spreadsheet Programs. In 26th IEEE Int. Conf. on Software Engineering, pages 439– 448, 2004. [5] C. Chambers and M. Erwig. A Rule System for Dimension-Correct Spreadsheets. Journal of Visual Languages and Computing, 20(3), 2009. To appear. [6] R. Abraham and M. Erwig. UCheck: A Spreadsheet Unit Checker for End Users. Journal of Visual Languages and Computing, 18(1):71–95, 2007. [7] R. Abraham and M. Erwig. Header and Unit Inference for Spreadsheets Through Spatial Analyses. In IEEE Int. Symp. on Visual Languages and Human-Centric Computing, pages 165–172, 2004. [8] R. Abraham, M. Erwig, and S. Andrew. A Type System Based on End-User Vocabulary. In IEEE Int. Symp. on Visual Languages and Human-Centric Computing, pages 215–222, 2007. [9] G. Tassey. The Economic Impacts of Inadequate Infrastructure for Software Testing. National Institute of Standards and Technology, RTI Project Number 7007.011, 2002. [10] R. Abraham and M. Erwig. Goal-Directed Debugging of Spreadsheets. In IEEE Int. Symp. on Visual Languages and Human-Centric Computing, pages 37–44, 2005. [11] R. Abraham and M. Erwig. GoalDebug: A Spreadsheet Debugger for End Users. In 29th IEEE Int. Conf. on Software Engineering, pages 251–260, 2007. [12] R. Abraham and M. Erwig. Mutation Operators for Spreadsheets. IEEE Transactions on Software Engineering, 2009. To appear. [13] M. Erwig, R. Abraham, I. Cooperstein, and S. Kollmansberger. Automatic Generation and Maintenance of Correct Spreadsheets. In 27th IEEE Int. Conf. on Software Engineering, pages 136–145, 2005. [14] G. Engels and M. Erwig. ClassSheets: Automatic Generation of Spreadsheet Applications from Object-Oriented Specifications. In 20th IEEE/ACM Int. Conf. on Automated Software Engineering, pages 124–133, 2005. [15] R. Abraham and M. Erwig. Inferring Templates from Spreadsheets. In 28th IEEE Int. Conf. on Software Engineering, pages 182–191, 2006.
10