database. 1 Introduction. The aging of software is a problem that is often neglected in ... prone modules using statistical techniques based on design metrics [17] ...
in Proceedings of the International Conference on Software Maintenance 1997 (ICSM ’97)
Software Evolution Observations Based on Product Release History Harald Gall, Mehdi Jazayeri, René R. Klösch, Georg Trausmuth Distributed Systems Group Technical University of Vienna Argentinierstrasse 8/184-1, A-1040 Wien, Austria, Europe {gall,jazayeri,kloesch,trausmuth}@infosys.tuwien.ac.at
Abstract Large software systems evolve slowly but constantly. In this paper we examine the structure of several releases of a telecommunication switching system (TSS) based on information stored in a database of product releases. We tracked the historical evolution of the TSS structure and related the adaptations made (e.g. addition of new features, etc.) to the structure of the system. Such a systematic examination can uncover potential shortcomings in the structure of the system and identify modules or subsystems that should be subject to restructuring or reengineering. Further, we have identified additional information that would be useful for such investigations but is currently lacking in the database.
1 Introduction The aging of software is a problem that is often neglected in software development. But the effects and the costs of aging software have become much clearer and subject to many discussions during the past years: Lehman and Belady discuss the laws of software evolution and the life cycles of programs [14,15]. Parnas [18], for example, lists preventive techniques to delay the decay and limit the effects of software aging: design for change, documentation, and reviews. This paper deals with a typical problem of software evolution: Software systems must evolve to satisfy new demands. After many enhancements a critical point is reached when each new release decreases the evolvability and increases the complexity of the system. The system becomes so complex and difficult to evolve that new releases require exorbitant costs. To avoid or remedy such a situation, it is important to identify modules that are in need of restructuring. In this paper, we show one way of identifying modules that exhibit a potential for restructuring based on historical data about the system. We describe the evolution of a large Telecommunication Switching System (TSS) based on information about its structure stored in a database. The investigation involves twenty system releases that were delivered over a
period of about two years. These releases were triggered by product improvement and new customer demands. The data on which our analysis is based is the number of modules and programs rather than the number of lines of code. In accordance to [15,23] we also believe that system size is measured by the number of modules and changes of the system functionality are reflected in added, removed or changed modules. The investigated system has been under development for many years: it was adapted to changing requirements and many new features were added. The continuous development increased both the size and the complexity of the system dramatically. The goal of our work is to identify potential shortcomings of the TSS structure by tracking its historical development. For that we use a database containing structural information about several releases of the TSS. Our second goal is to evaluate the adequacy of the database. After structural shortcomings have been identified these parts of the system can be subject to program restructuring or reengineering. Techniques and tools presented in [4] or [10] especially address the restructuring of large software systems. Methods for reengineering can be found in, for example, [1]. Related approaches differ from our work in that they mainly focus on a micro-level to analyse the evolution of a software system: the source code is analysed and source code metrics are used as indicators of the system’s quality and complexity [19]. Other approaches identify faultprone modules using statistical techniques based on design metrics [17] and discriminant analysis [12,13]. In [6] fault and defect metrics are used for in-process project control and for process improvement over time. Other related work analyses the structure and the architecture of software systems. Methods for architectural reasoning and assessment as described in [20] or [22] could be used for restructuring the architecture. Visualization approaches such as SAAM [11], SeeSys [2], SeeSoft [8], or [3,5,7] deal with the visualization of software in different ways by comparing architectures or architectural styles, visualizing statistics associated with the code, or visualizing source code information.
-1-
in Proceedings of the International Conference on Software Maintenance 1997 (ICSM ’97) We focus on a macro-level of software evolution by tracking the release history of a system. We thereby only investigate structural information about each release (such as version numbers of system modules indicating major or minor releases) but no source code metrics at all. The paper is organized as follows: In Section 2 we describe the case study to the extent needed to understand the evolution observations. We have changed the names of the modules and subsystems to avoid the identification of the system. Section 3 describes our software evolution observations that were made on the basis of the whole system and modules of a particular subsystem. We report on our results in Section 4. In Section 5 we draw some conclusions and point to areas of future work.
2 The Case Study The software examined in this case study is a Telecommunication Switching System (TSS). Telecommunication Switches are used to connect lines and usually consist of a hardware part and a software part. Our evaluation only concerns the software. The TSS covers a wide range of utilization: for example, it can be used as a switch in a fixed network, as a large international switch and as a switch for mobile telephones. The source code of TSS consists of over 10 million lines of code and several thousand files. The TSS was first shipped in the early 1980s. The implementation of the software of the initial release was done in a machine-specific low-level language. After a few years this language was gradually replaced. So far, many different languages, such as Assembler, C and Basic, have been used to code new parts of the system. Presently, the system is being developed using SDL [21]. The SDL programs are translated into C and then compiled with a standard C-compiler.
2.1 The structure of the case study The software structure of the TSS is a tree hierarchy with four levels: the system, subsystem, module, and program level. Each level consists of one or more elements. Each element of a certain level is connected to one element of the higher level. The system level contains only one element representing the root of the tree. The elements in each level are named corresponding to the names of the levels: the elements in the subsystem level are called subsystems, the elements in the module level modules and the elements in the program level programs.
Diagram 1: The software structure of the TSS Diagram 1 shows the software structure of the TSS. The tree hierarchy limits the visibility of the algorithms contained in the program level. For instance, an algorithm of a specific program can only be seen by another program of the same module. The tree hierarchy, however, does not restrict the use of the algorithms at the implementation level. Note that this logical structure has been defined after the implementation of many releases of the system and that it represents the organizational structure rather than the structure of the actual implementation of the software. Telecommunication Switches are products that require extensive customization for different markets and applications. Currently, this customization affects large parts of the system, mainly because the customization is performed by making unstructured changes directly to the code. Each customer receives a specially adapted program. This kind of customization makes the system expensive to develop, test, and maintain.
2.2 The Product Releases Database (PRDB) A system of 10 MLOC is difficult to manage. To help simplify the management and to enable the study of the structure, a database stores structural information of the whole system. The information required to populate the product releases database (PRDB) is derived directly from the source code: during compile time preprocessors extract the required information and store it. The PRDB contains 20 different releases (representing releases over 21 months). Eight of these releases are major releases (release 1 through 8) and twelve are minor releases for release 6 (6.01 through 6.12). Major releases represent substantial changes in the functionality of the system. Minor releases contain mainly bug fixes. The time intervals between major releases (1-3 months) are normally larger than between minor releases (15-30 days). Note that “Release 1” is not the first release of the
-2-
in Proceedings of the International Conference on Software Maintenance 1997 (ICSM ’97) system, it is just the first release that is stored in the PRDB. For each release stored, the database contains entries for elements at the system, subsystem, module, and program level. Systems and programs are characterized by a version number. Each system has the version number of the specific release. Program version numbers are independent from the version number of the system to which they are connected. Programs which have been changed from one release to the following are identified by an incremented version number in the newer release. Furthermore, relations between various elements of the system are stored in the PRDB (e.g. Module C consists of Programs A, B, and C). Properties are used to attach additional information to elements or relations, such as textual descriptions of an element or the name of the developer. Each system release stored in the database consists of eight subsystems, 47 to 49 modules, and about 1500 to 2300 programs.
3 Software Evolution Observations Based on the structural information stored in the PRDB we tracked the historical development of the structure of TSS. This concerned, for example, the evolution of the size of the system and its subsystems and the programs of a particular module which changed from one release to the next. With the information gathered this way, we tried to identify potential shortcomings in the current structure. The PRDB contains a large amount of information and a key problem is to extract useful information in order to reason about the evolution of the TSS. We started the software evolution observation by setting up a list of queries. The answers to these queries should support reasoning about the evolution and help in identifying structural problems. The queries are formulated in such a way that outliers (i.e. components which have significantly different evolving characteristics compared to the rest of the system) can be isolated. To access the PRDB a C++ library, which grants easy access to the information stored in the database, is used. Based on this library and on the list of queries several programs were developed to collect the information required. In the following descriptions, we focus on a subset of system properties: • The size of each system, subsystem or module is defined as the number of programs it contains. According to [9] the study of large systems should be
based on the number of “modules” rather than source code size. We use programs as the module unit. • The changing rate is the percentage of programs of a particular system, subsystem or module, which changed from one release to the next. Changed programs are identified by a different version number. To compute the changing rate, two releases are required for comparison. The relative number of the changed programs represents the changing rate. • The growing rate is defined as the percentage of programs of a particular system, subsystem or module, which have been added (or deleted) from one release to the next. To compute the growing rate, two releases are compared and the numbers of the added and deleted programs are computed. The relative number of the new programs represents the growing rate. Using the information extracted from the database, several statistics and diagrams are computed. In the following we will describe the evolution observations on: 1) the whole system; and 2) the modules of a particular subsystem we chose for further study. Then we will interpret our observations from the viewpoint of system evolution.
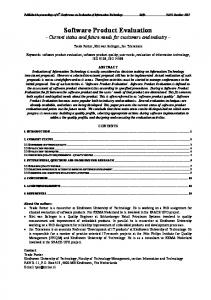
3.1 System Oberservations Diagram 2 shows the historical development of the size of the examined system using the release numbers in the x-axis. The system has a high growing rate: it consisted of 1499 programs initally and of 2303 at the end. This means that the total size of the TSS increased by over 53 percent in less than two years (21 months). Size of the system 2500 2000 1500 1000 500 0
releases
Diagram 2: Evolution of the size of the system over several releases
-3-
in Proceedings of the International Conference on Software Maintenance 1997 (ICSM ’97) Changing and growing rate
changed
"8.00"
"7.00"
"6.12"
"6.11"
"6.10"
"6.09"
"6.08"
"6.07"
"6.06"
"6.05"
"6.04"
"6.03"
"6.02"
"6.01"
"6.00"
"5.00"
"4.00"
"3.00"
new
releases
Number of added programs 200 180 160 140 120 100 80 60 40 20 0 -20 "8.00"
"7.00"
"6.12"
"6.11"
"6.10"
"6.09"
"6.08"
"6.07"
"6.06"
"6.05"
"6.04"
"6.03"
"6.02"
"6.01"
"6.00"
"5.00"
"4.00"
"3.00"
Diagram 4: Comparison of the changing and growing rates
"2.00"
# of programs
45 40 35 30 25 20 15 10 5 0 "2.00"
percentage
The first six releases that are stored in the database are major releases. Between release 6.00 and 7.00 several minor releases are stored. The time intervals between the major releases are long compared to that of the minor releases. This causes a larger growth in the first half of the diagram. If this effect is neglected, the graph almost could be viewed as a straight line. Hence, it can be concluded from the diagram that the size of the system is growing linearly.
releases
Diagram 3: Number of added programs in each release Diagram 3 shows the number of programs that were added in each release. So, for example, it shows that at release 2.00 more than 150 new programs were added to the system. At the beginning (between release 2.00 and 5.00) the number of programs added is large. After release 5.00 it significantly decreases and becomes relatively constant. In releases 6.07, 6.09 and 7.00 the number increases again for exactly one release.
Diagram 4 compares the changing and growing rates for each release. In some releases the changing and growing rate increase together (e.g. in releases 5.00 and 7.00), in other releases the changing rate decreases when many new programs are added (e.g. in releases 3.00 or 6.03), but in general no significant correlations between changing and growing rates can be derived. Diagram 4 shows a noticeable stabilization of the whole system over time. The number of added, deleted and changed programs is high between releases 2.00 and 5.00 which indicates some major changes in the functionality or to the system hardware. At the beginning (from releases 1.00 to 2.00) over 40 percent of the programs were changed which is rather high. At the end (from release 7.00 through 8.00) only 7 percent of the programs were changed. This means that the number of changed programs significantly decreased over the observed releases. We briefly summarize our findings from the above facts: • The size of the system is increasing linearly. • Between releases 2.00 and 5.00 and in release 7.00 some major activities can be observed. • In general the changing rate of the whole system decreases. • In the last examined releases only a few new programs were added. • The structure of the whole system has become stable. The observations on the system level indicate that the system supports evolution in a satisfactory way, because the growing and changing rates decrease over time. The validity of our observations on the whole system does not
-4-
in Proceedings of the International Conference on Software Maintenance 1997 (ICSM ’97) necessarily hold for the subsystems. On the contrary, we need to verify the behavior of the subsystems in detail. In this paper, we focus on the analysis of the evolution of a particular subsystem that exhibits interesting characteristics.
3.2 The Evolution of Subsystem C So far the examination was based on the whole system and gave an impression of how the overall system has evolved over time. In this section, we will examine Subsystem C in more detail, show how its modules evolve and if it evolves the same way as the whole system. Subsystem C is taken as an example because it exhibits the highest growing and one of the highest changing rates among all subsystems (see Table 1). These characteristics make Subsystem C the most likely candidate for restructuring or even reengineering activities.
-5-
in Proceedings of the International Conference on Software Maintenance 1997 (ICSM ’97)
Subsystem
changing rate (%)
growing rate (%)
A
11
18
B
16
18
C
25
193
D
5
78
E
8
8
F
33
-25
G
29
157
H
20
3
Table 1 Changing and growing rates of subsystems
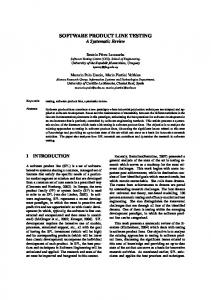
Diagram 6 shows the growing rates of the three modules. At first glance it can be seen that Module A has the highest growing rate. Initially it consisted of 129 programs, and at the end of 406 programs. This means that its size increased by about 220 percent which represents the highest growing rate in the whole system. In this diagram it seems that Modules B and C have a low growing rate. This impression is misleading since the large size of Module A distorts the view. With 110 and 70 percent, respectively, the growing rates of Modules B and C are among the highest of all modules.
Subsystem C consists of three modules called Module A, Module B and Module C (see Diagram 1).
250 Changing rates (%)
200 Sizes of the modules in Subsystem C
150
Module C 4%
Module B 13%
Growing rates (%)
100 50 Module A 83%
0 A
B
C
Diagram 7 Changing and growing rates of Subsystem C's modules Diagram 5: Module sizes in Subsystem C Diagram 5 shows the relative sizes of the modules of Subsystem C in the latest release examined. It shows that Module A covers about 80 percent of Subsystem C. Compared to this module, the sizes of the two other modules are relatively small. In release 8.00, Module A consists of 406 programs representing one sixth of the number of programs in the whole system. This module is even larger than some subsystems.
Diagram 7 shows the changing and growing rates of the three modules of Subsystem C from release 2.00 to release 8.00. Modules B and C have a changing rate of 84 and 92 percent, respectively. These are the two highest changing rates of the system. In contrast to them, Module A has a relatively low changing rate of 11 percent. Changing rates of modules in SubsystemC 120 100 percentage
Module A
80
Module A
60
Module B
40
Module C
20 0
Module B
"8.00"
"7.00"
"6.12"
"6.11"
"6.10"
"6.09"
"6.08"
"6.07"
"6.06"
"6.05"
"6.04"
"6.03"
"6.02"
"6.01"
"6.00"
"5.00"
"2.00"
releases
"8.00"
"7.00"
"6.12"
"6.11"
"6.10"
"6.09"
"6.08"
"6.07"
"6.06"
"6.05"
"6.04"
"6.03"
"6.02"
"6.01"
"6.00"
"5.00"
"4.00"
"3.00"
"2.00"
"4.00"
-20
Module C
"3.00"
450 400 350 300 250 200 150 100 50 0 "1.00"
# of programs
sizes of modules in Subsystem C
releases
Diagram 8: Changing rates in Subsystem C Diagram 6: Sizes of the modules for all releases in Subsystem C
Diagram 8 shows the detailed changing rates of the three modules of Subsystem C over all releases. Whereas
-6-
in Proceedings of the International Conference on Software Maintenance 1997 (ICSM ’97) the changing rate decreases over time in Module A, it is always high in Modules B and C.
changes will affect Subsystem C and—as a consequence—Modules B and C is high. Modules B and C are, therefore, also candidates for redesign.
4 Interpretation of the data 5 Conclusions and Future Work In this section we summarize the characteristics of the TSS system that we have observed on the system and subsystem levels. The development of the whole system becomes stable over the twenty releases examined. The changing and growing rates decrease as do the number of added programs per release. From a system point of view the structure seems fine. By examining the subsystems, the picture of the system changes significantly. There are subsystems that exhibit a completely different behavior than the whole system and, therefore, offer a high potential for restructuring or even reengineering. In this paper we focused on a discussion of Subsystem C because its behavior is different from the other subsystems. Subsystem C is characterized by a high growing rate and a high changing rate. Its modules continuously grow from one release to the next. For a detailed interpretation of Subsystem C we take a closer look at its modules. Module A is growing fast and has become the largest module of the system; it is even larger than some subsystems which obviously makes it a candidate for redesign. Compared to the other modules, Module A has a remarkably low changing rate (only 11 percent). The number of the existing programs that have been changed is small, whereas many new programs have been added. Furthermore, many programs in Module A have similar names that only differ in their endings. This indicates that newly added programs are often the result of copying and slightly modifying already existing programs and, therefore, they probably provide similar functionality. By asking the developers we discovered that Module A contains system configuration information and that new configurations are often developed by copying existing programs and then making the required changes. This fact explains the high growing and the low changing rate. Since this module is extensively customized, a different concept to handle various configurations of the system is required. Module A is therefore a candidate for redesign. Modules B and C both have a high growing and changing rate which are among the highest in the system. The changing rates are high for all releases meaning that almost every change affects these modules. Because of the size of Subsystem C and the characteristics of the changing rates of its modules, the likelihood that future
We examined the structure of several releases of a Telecommunications Switching Software (TSS) that has been stored in a database of product releases. We tracked this historical information of the TSS in order to identify potential shortcomings of its structure. For this we examined the TSS on different levels: the system and the subsystem level. A major result of our investigations is the difference in the behavior of the whole system versus its subsystems: Although a stable development of the whole system could be observed over time (reduced changing and growing rates), the evolution of Subsystem C showed completely different characteristics. It exhibits high changing and growing rates over almost all releases. We discovered that such a development is masked by viewing the whole system. One particular module of the system was identified to represent one sixth of the whole system. This module turned out to be the most interesting for redesign because of its continuous growth and its changing characteristics. We identified other modules that are often subject to changes and therefore offer a high potential for restructuring or reengineering. A database of product releases that contains structural information about the system is valuable for every software engineering group. It allows informed management decisions, for example, assessment of maintenance costs, personnel planning, release scheduling, etc. Additional information that would be valuable to be included in the database is the kind of change performed in a release (corrective, adaptive, perfective, or preventive maintenance as described in [16]). It would be useful to correlate the behavior of the evolution to the kinds of changes. We believe that software evolution observations based on release history information opens up a whole area of research. Such structural information about a system is obtained relatively easily (during compile time preprocessors extract the required information from the source code and store it in the PRDB) and valuable for the software engineers to identify potential shortcomings of their system. Future work will concentrate on the extension of the PRDB in order to include more detailed information. Our
-7-
in Proceedings of the International Conference on Software Maintenance 1997 (ICSM ’97) focus is not on source code analysis per se, but primarily on the derivation of software quality attributes and their assessment. Several of our observations are to be verified by using additional information such as defect repair requests or enhancement requests. Scientific visualization techniques may also be useful in uncovering patterns in the system evolution.
[10]
[11]
[12]
6 Acknowledgements This work was supported by the European Commission within the ESPRIT Framework IV project ARES (Architectural Reasoning for Embedded Systems). We would like to thank Alexander Gurschler for his data gathering and analysis and Wolfgang Lugmayr for his support in setting up the database at our department. We also thank the anonymous referees for their helpful comments and suggestions.
[13]
[14]
[15] [16]
7 References [1] [2] [3]
[4]
[5]
[6]
[7]
[8]
[9]
Arnold R. S., “Software Reengineering,” Proceedings, IEEE Computer Society Press, Los Alamitos, CA, 1993. Baker M.J. and Eick S.G., “Visualizing Software Systems,” AT&T Bell Laboratories, 1994. Ball T. and Eick S.G., “Software Visualization in the Large,” IEEE Computer, Vol. 29, No. 4, pp. 33-43, April 1996. Choi S.C. and Scacchi W., “Extracting and Restructuring the Design of Large Systems,” IEEE Software, pp. 66-71, January 1990. Chuah M.C. and Eick S.G., “Glyphs for Software Visualization,” International Workshop on Program Comprehension, pp. 183-191, May 1997. Daskalantonakis M.K., “A Practical View of Software Measurement and Implementation Experiences Within IEEE Transactions on Software Motorola,” Engineering, Vol. 18, No. 11, pp. 998-1010, November 1992. Ebert C., “Correspondence Visualization Technique for Analyzing and Evaluating Software Measures,” IEEE Transactions of Software Engineering, Vol. 18, No. 11, pp. 1029-1034, November 1992. Eick S. G., Steffen J. L., and Summer E. E. Jr., “Seesoft-A Tool For Visualizing Line Oriented Software Statistics,” IEEE Transaction on Software Engineering, Vol. 18, No. 11, November 1992. Gefen D. and Schneberger S.L. “The NonHomogeneous Maintenance Periods: A Case Study of Software Modifications,” International Conference on Software Maintenance, pp. 134-141, November 1996.
[17]
[18] [19]
[20]
[21]
[22]
[23]
-8-
Griswold W.G. and Notkin D., “Automated Assistance for Program Restructuring,” ACM Transactions on Software Engineering and Methodology, Vol. 2, No. 3, pp. 228-269, July 1993. Kazman R., Bass L., Abowd G., and Webb M., “SAAM: A Method for Analyzing the Properties of Software Architectures,” Proceedings of ICSE 16, Sorento, Italy, pp. 81-90, May 1994. Khoshgoftaar T., Allen E.B., Kalaichelvan K.S., and Goel N., “Early Quality Prediction: A Case Study in Telecommunications,” IEEE Software, Vol. 13, No. 1, pp. 65-71, January 1996. Khoshgoftaar T.M. and Halstead R., “Detection of Fault-Prone Software Modules During a Spiral LifeCycle,” International Conference on Software Maintenance, pp. 69-76, November 1996. Lehman M.M., “Programs, life cycles and laws of software evolution,” Proceedings of the IEEE, pp. 10601076, September 1980. Lehman M.M. and Belady L. A., Program evolution, Academic Press, London and New York, 1985. Lientz B.P. and Swanson E.B., Software Maintenance Management, Addison-Wesley, 1980. Ohlsson N. and Alberg H., “Predicting Fault-Prone Software Modules in Telephone Switches,” IEEE Transactions on Software Engineering, Vol. 22, No. 12, pp. 886-894, December 1996. Parnas D.L., “Software Aging,” Proceedings of ICSE 16, Sorento, Italy, pp. 279-287, May 1994. Pearse T. and Oman P., “Maintainability Measurements on Industrial Source Code Maintenance Activities,” International Conference on Software Maintenance, pp. 295-313, October 1995. Perry A. E., and Wolf A. L., “Foundations for the Study of Software Architecture,” Software Engineering Notes, ACM SIGSOFT, Vol. 17, No. 4, pp. 40-52, October 1992. Sarma A., “Introduction to SDL-92,” Computer Networks and ISDN Systems, Elsevier Science Publishers, Vol. 28, No. 12, pp. 1603-1615, June 1996. Shaw M., and Garlan D., Software Architecture: Perspectives on an Emerging Discipline, Prentice-Hall, 1996. Turski W.M., “Reference Model for Smooth Growth of Software Systems,” IEEE Transactions on Software Engineering, Vol. 22, No. 8, pp. 599-600, August 1996.