FOUNDATIONS Vol. 39
OF
COMPUTING AND (2014)
DECISION
DOI: 10.2478/fcds-2014-0014
SCIENCES No. 4
ISSN 0867-6356 e-ISSN 2300-3405
Software Measurement and Defect Prediction with DePress Extensible Framework Lech MADEYSKI ∗, Marek MAJCHRZAK
†
Abstract. Context. Software data collection precedes analysis which, in turn, requires data science related skills. Software defect prediction is hardly used in industrial projects as a quality assurance and cost reduction mean. Objectives. There are many studies and several tools which help in various data analysis tasks but there is still neither an open source tool nor standardized approach. Results. We developed Defect Prediction for software systems (DePress), which is an extensible software measurement, and data integration framework which can be used for prediction purposes (e.g. defect prediction, effort prediction) and software changes analysis (e.g. release notes, bug statistics, commits quality). DePress is based on the KNIME project and allows building workflows in a graphic, end-user friendly manner. Conclusions. We present main concepts, as well as the development state of the DePress framework. The results show that DePress can be used in Open Source, as well as in industrial project analysis. Keywords: prediction.
1
mining in software repositories, software metrics, KNIME, defect
Introduction
A free, open and extensible framework which allows collecting and integrating software development data across different projects, releases, as well as repositories, development or measurement tools and development environments would be of great interest and practical importance to software process improvement (SPI) or quality assurance (QA) practitioners and researchers. It would be great if the framework would support, e.g. versioning repositories like SVN, GIT or CVS, bug and issue trackers like JIRA or Redmine, and JDepend, Eclipse Metric or AopMetrics measurement tools. If the aforementioned framework would support also a wide range of predictive modelling techniques offered by the most widely used platforms, such as R, Weka or KNIME, ∗ Lech Madeyski is with the Faculty of Computer Science and Management, Wroclaw University of Technology, Poland. E-mail:
[email protected] WWW: http://madeyski.e-informatyka. pl/ † Marek Majchrzak is with the Faculty of Computer Science and Management, Wroclaw University of Technology and Capgemini Poland. E-mail:
[email protected]
Unauthenticated Download Date | 8/28/15 9:41 PM
250
L. Madeyski, M. Majchrzak
then the practical importance would be even higher. Hence, we decided to search for (existing tools are described in Section 2) and, as a result, to build such a framework in an open source and extensible (i.e. plugin-oriented) manner. Both the idea and developement of the DePress framework have been initiated at Wroclaw University of Technology by the authors of this paper, but we collaborate closely with software development companies (notably Capgemini Poland). In our opinion a standardized, intuitive and extensible framework would make it possible to include predictive modelling in general, and defect prediction analyses in particular, as one of the common QA or SPI tasks, such as code review or software testing. We believe that thanks to the DePress platform, which steadily increases its support for various data sources in software engineering environments, the QA and SPI engineers, or even trained project managers, would be able to introduce data science methods to a wider range of software projects. We have analysed the needs of commercial and open source software projects, as well as existing solutions and as a consequence defined the following requirements for our framework: • Workflow visualization and usability. The existing tools do not offer workflow visualisation for the purpose of software engineering data collection, integration and predictive modelling. The existing solutions are based on scripting languages, require high customizing efforts and are mainly understandable only to their creators [1]. New analytic frameworks, platforms or tools should be based on commonly known standards and reuse the existing solutions. • Support for collaboration. Since software development is based on collaboration [2], [1], collaboration could and should be made possible in quality assurance and software process improvement activities. • Extensibility. The manner of introducing new data sources or metrics should be easy, not demanding significant effort (e.g. the need for rebuilding existing implementation). New extensions should be independent so that they could be built by different organizations (e.g. software development companies) or research groups. Additionally, the system has to ensure an effortless integration with the existing solutions, such as WEKA [3], R [4] or Matlab [5]. Reusability is another important factor. The framework should make it possible to reuse machine learning and software measurement solutions to support core data collection, integration and mining tasks within a software engineering domain. • Standalone. There are obvious advantages of a client-server web-based architecture. However, that means that data analysis and data storage are managed centrally by the application provider which, according to our best knowledge, would discourage software development companies from using the tool. Such a tool could also be installed within an organisation, which is a much safer solution. However, in order to introduce and use such a tool, one needs to have specific knowledge and administrative rights in an organization. That often requires additional effort, especially in large companies. Hence, we suppose that a standalone tool (which offers full data analysis and data acquisition capacity)
Unauthenticated Download Date | 8/28/15 9:41 PM
Software measurement and defect prediction ...
251
would be more convenient to start with and it would provide a richer interaction experience for the SPI, QA and project managers. However, at the same time, we would like to be able to offer an upgrade to a web based solution. • Export/import support. The frameworks should support, by default, all popular data formats such as: CSV, XLS, ARFF or XML, in order to enable an easy data exchange. • Ready for commercial use. One of the obstacles which hinder the wider use of software measurement and predictive modelling tools by software development companies is the licensing issue. Tools are often hosted by research centres. Remote access will not be accepted by a company, especially in the case of business or personal data. For an effective collaboration between a software development company and researchers, a clear licensing aspect and data anonymization are required. • Open Source. We argue that the new framework should be developed as an open source project. The framework should be open for other research groups and software development companies to support collaboration. It could have a positive impact on the development speed and quality. • Language and Technology Independent. We should not focus on one language or technology. Instead, we should be able to collect and integrate data from different environments. A tool which fulfills the aforementioned requirements is DePress Extensible Framework. We have used the KNIME Framework [6], which is open source, as an architectural basis. KNIME Framework is an integration backbone which allows one to use various external statistical and machine learning tools. KNIME allows exchanging data using various data formats, including the exchange of statistical models [7] using the PMML [8] format. Additionally, we can leverage reporting and KNIME Server Extension for distributed collaboration and centralized data storage. Extending and reusing the KNIME environment is not a new idea. Many publicly available extensions have been donated by industrial partners and research centres. However, they focus mainly on chemistry [9], [10] biotechnology and pharmacy [11], but not software measurement and analysis. On the basis of the KNIME plugin concept, we propose an extension set which allows data collection, integration and predictive modelling. With the use of the developed KNIME plugins and integration possibilities, we are able to perform and visualise the complete defect prediction process, to start with data acquisition and end in prediction model validation. In the first version of the DePress framework we focus on Java and related technologies. Support for other environments will be provided in the future.
Unauthenticated Download Date | 8/28/15 9:41 PM
252
2
L. Madeyski, M. Majchrzak
Related Work
There are several tools and frameworks that move beyond simple dedicated scripting, created by researchers for their own studies. They offer more sophisticated and complementary solutions, together with flexibility and real integration opportunities. But still most of the tools are not available publicly and are used rather internally by researchers and creators. Many tools only address some data acquisition tasks and do not have a built-in support for predictive modelling (e.g. defect prediction). Jureczko and Magot propose the QualitySpy framework [12]. The main motivation behind that work was to provide a tool designed to collect raw data and allow the user to define metrics. It consists of two groups of features: data acquisition and reporting. Currently QualitySpy offers metric calculation from Java classes, reading JIRA Issues and data retrieval from SVN. QualitySpy source and beta release are available [13] under the Apache 2.0 [14] licence. Fenton et al. [15, 16] used AgenaRisk [17] as a tool for defect prediction. The tool is used in general in modelling, analysing and predicting risk. It does not provide support for data acquisition from software repositories and tools. Churrasco [1] is a web based application which allows one to retrieve and combine data from Bugzilla and SVN. Churrasco allows collaborative software evolution analysis based on FAMIX [18] language independent meta-model. Churrasco is publicly available. The project could be used in software analysis whose repositories are publicly available. Despite the fact that the software sources are provided we didn’t find any information about the licence, which is required by industrial partners. Additionally the system has been written in Smalltalk programming language, which is not as popular as Java [19, 20]. Evolizer [21] and Change Distiller [22] are Eclipse [23] plugins for software evolution analysis. Eclipse is a software development environment built upon extensible plugin architecture. Current implementation allows one to collect data from version control systems (CVS and SVN) and from the issue tracking system (Bugzilla). ChangeDistiller stores fine grained class changes based on the Eclipse abstract syntax tree (AST) and FAMIX meta-model. The main advantage of the tool is the possibility of querying FAMIX data using Hibernate Query Language (HQL). This feature lets researchers easily build their own metrics. Evolizer and Change Distiller1 plugins are publicly available under the Apache 2.0 licence. SOFAS [24] is a service oriented platform which integrates a number of services related to software data acquisition and analysis. The platform allows retrieving data from a number of external sources. It is one of the few enabling the analysis of data from the SVN, CVS, GIT and Mercurial version control systems. It also provides access to Bugzilla, Google Code, Trac and SourceForge. Apart from data collection, the platform offers services based on the FAMIX meta-model, such as software metric services, change coupling analysis, and change type distilling service. One of the authors’ aims was to facilitate collaborative software analysis via the web interface. Users are able to define their own workflows using SPARQL [25] query language. 1 ChangeDistiller is currently actively developed https://bitbucket.org/sealuzh/tools-changedistiller
as
a
Unauthenticated Download Date | 8/28/15 9:41 PM
standalone
Java
library
at
Software measurement and defect prediction ...
253
Platform services are available upon request. The complete SOFAS platform and the sources are not available publicly and thus could not be installed and used in industrial research projects. Common security policies allow one to access software repositories only from a company intranet; moreover, companies are not interested in providing access to the source code to third parties. The tools described in this section do not fulfill all of the requirements discussed in Section 1. Hence, we decided to implement a new framework which satisfies the aforementioned requirements.
3
DePress Implementation
DePress is based purely on KNIME Plugin Architecture. We did not add any architectural or technology abstraction. On the basis of KNIME API solely, we are able to integrate with existing plugins and additionally we can reuse existing coding guidelines and keep implementation as simple as possible. Every plugin has to consist of at least 4 elements (see Figure 1 presenting sample plugin for JIRA).
Jira Plugin «create»
«node model» JiraAdapterNodeModel
«node factory» JiraAdapterNodeFactory «uses» «create»
«node dialog» JiraAdapterNodeDialog
JiraAdapterNodeFactory.xml
Figure 1: JIRA Plugin Design Figure 2: Jira adapter (offline) node description
Unauthenticated Download Date | 8/28/15 9:41 PM
254
L. Madeyski, M. Majchrzak
Node factory is responsible for the instantiation of node dialog and node model objects. The Node dialog class is responsible for providing the GUI representation of the plugin. Developers do not need to know the PDE2 specific widgets (at least if they want to use basic GUI elements). We can reuse, in a very simple way, controls from the extensive KNIME widget collection and focus on plugin logic, which should be implemented in the node model. The last important artifact is the node description. This element is responsible for the description of the input and output ports, plugin help, icon and type. We decided to include in every plugin a detailed description and instruction on how the plugin should be utilized, see Figure 2. We deliver usage examples with every plugin. In order to keep plugins as independent as possible, we propose to develop every plugin in a separate PDE project. It creates a small overhead in the implementation process but allows one to release updated versions separately and, most importantly, allows one to develop them undisturbed by different teams.
3.1
Plugins
The origin and the main task of the DePress Framework was software defect prediction. In order to perform defect prediction we have to define plugins, which allow us to collect, transform and analyse data. One of our assumptions was that plugins are independent. Most of the existing systems impose predefined configuration. For example CVS and Bugzilla [26], in many research projects, is a standard configuration for post-release defects querying. If we want to use GIT instead of CVS (for instance, because a project has been migrated to a new version control system, which happens often nowadays) we probably have to change significantly the implementation of the tool, not only because of a new data source, but because of a totally different versioning approach between CVS and GIT. We propose to allow simple plugin exchange, without further workflow adjustments. For instance, GIT and CVS should return the same data structure. Currently, in version 1.0.0, we define (see Figure 3) the following 3 main groups of plugins: 1. Adapter Plugins. Allow to retrieve data from external systems and tools. Retrieved data is transformed to a tabular representation. 2. Metric Generators Plugins. Compute metrics on a basis of delivered data. 3. Other. Support plugins for additional data transformations.
3.1.1
Adapter Plugins
Adapter plugins allow one to retrieve data from external tools and systems. Currently, we address three integration types: software configuration management sys2 The Plug-in Development Environment (PDE) provides tools to create, develop, test, debug, build and deploy Eclipse plug-ins.
Unauthenticated Download Date | 8/28/15 9:41 PM
Software measurement and defect prediction ...
255
DePress Adapter
ITS
SCM
JIRA Bugzilla Mantis GitHub GoogleCode Redmine HP QC ...
SVN GIT CVS ClearCase TFS ...
Metric Readers Judy JaCoCo PI Test Checkstyle PMD FindBug EclipseMetrics CKJM Metrics ...
Metric Generators
Other
Process & Organisation Anonymization Issues ... ...
Figure 3: The plugin concept tems (SCM), issue tracking systems (ITS) and metric readers (MR). In the first DePress version we are supporting ITS such as JIRA and Bugzilla. In future releases we want to provide access to GoogleCode, GitHub, HP Quality Center, MantisBT and RedMine. As in the case of issue tracking systems, we focus on popular SCM systems. In the first release we developed SVN and GIT. Afterwards we plan (with the help of a number of open source committers also from our industrial partners) to develop CVS, ClearCase, TFS and Mercurial. Based on the DePress principle that each plugin can be easily exchanged with another within a given group, every ITS plugin has to return (at least) the following columns: issue id, creation date, resolution date, status, type, resolution, version(s), fix version(s), summary. Similar SCM plugins should at least return the following data: resource name, issue marker(s) (extracted from commit message using regular expression [26]), author. The MR plugins support data retrieval from various external tools. The MR plugins do not compute metrics themselves. They simply acquire and transform data to a common tabular format. In the first release we implemented plugins for Judy mutation tester for Java [27, 28, 29, 30, 31], JaCoCo [32], EclipseMetrics [33], CheckStyle [34] and PMD [35]. In feature relases we plan to add PITest [36], Findbug [37], CKJM Metrics [38] and others in response to needs of our industrial partners and open source community.
Unauthenticated Download Date | 8/28/15 9:41 PM
256 3.1.2
L. Madeyski, M. Majchrzak Metric Generators Plugins
DePress, besides pure data acquisition, allows one to compute metrics as well. As a proof of concept we implemented two metric generator (MG) plugins Issues Per Artefact [26] and People and Organization [39]. Issues Per Artefact links issue reports with source code modification reports. The modification report, in the SCM system, contains list of changed files and comment written by developer at a commit time. It often includes a marker which points to issue report (e.g.”’fixed bug HHH-1231 ”’ ). Such marker (e.g. HHH-1231 ) allows to link issue report with changed files. Additionally, we compute a number of issues and number of unique issues for each file. The plugin itself is simple but using KNIME we are easily able to extend its functionality. For instance (Figure 4) using built-in KNIME row filter plugin we can include only defect issues and thus we can compute a defect post-release metric.
1a. Jira Plugin (ITS)
2. Row filter 3. Row filter (Type:BUG) (Resolution:FIXED)
4. Issue Metric Plugin 1b. GIT Plugin (SCM)
Figure 4: Issue Metric usage In the first step (1a and 1b) raw data is extracted from external systems. In the second and third steps the row filter is executed: the first time in order to include issues which have type set as “defect” or “bug” and the second time in order to include those which have the resolution set as “fixed”. In the fourth step filtered data and raw data from SCM are used as the input sources in the Issues Metric plugin. 3.1.3
Other
We have developed some plugins which do not focus on data acquisition or analytic tasks but are indeed required. Many industrial partners allow one to mine and analyse their repositories with the assumption that no business-related data will be available outside the company. We propose to encrypt (secure) sensitive data using the Anonymization plugin and allow external data analysis. The basic steps are shown in Figure 5. Retrieved data (1) consist of sensitive class and author data columns. We choose which columns have to be encrypted (2). In the next step, secured data are
Unauthenticated Download Date | 8/28/15 9:41 PM
Software measurement and defect prediction ...
1. GIT Plugin
2. Anonimization
3. XLS Writer
257
4. Data Analysis
Anonymization Plugin Raw data UID Comment
Anonymized data Add Remove
OK
Class Author
Apply
Cancel
Figure 5: Anonymization Plugin saved as an Excel (xls) file (3). Further analysis can be conducted outside the company, e.g. by external researcher with data science skills (4). The analysed data are passed to the company. After decryption, the results could be used back in the company. Through those steps we can establish collaboration between industrial partners and our research team. 3.1.4
Online and offline work mode
One of the first decisions we had to make was the mode of collecting data, especially in the case of adapter plugins. We found two options. The first was direct (online) access to the software repository. For instance, in the case of JIRA we could extract data directly using JIRA REST API [40] and JIRA Query Language (JQL) or read directly the JIRA RSS feed. The second option was to export issues manually, e.g. as XML using a web interface. We have also two options with regard to the way of collecting data from SVN. We can use either native access using the SVNKit [41] library (online mode) or export a history log using the svn log command (offline mode). We decided to start with the offline mode support in the first DePress release and then add the online mode support. The reason for the decision we made was quite simple. Often in case of collaboration with business partners we get only exported data and we do not get full access to all required repositories. Manual preparation of plugin input in this case should not cause additional effort. QA engineers and
Unauthenticated Download Date | 8/28/15 9:41 PM
258
L. Madeyski, M. Majchrzak
developers are familiar with SCM, ITS and measurement tools (e.g. JaCoCo) and use them in their daily work. At the moment we are focused on the online plugins. SVN, JIRA, Bugzilla, and GIT online plugins are ready.
3.2
Data exchange
Instead of using a new metadata format or new type of protocol, we decided to use tabular data. The plugin checks only whether incoming data consists of the required columns or not. For instance, we can use the People and Organization Metric Plugin. It requires two types of input data: change history data and author details. Change history data could be retrieved from one of the SCM plugins. Before processing, the plugin validates the incoming data and checks whether it contains the required columns (column name and column type are taken into account). In our case we check if the data table consists of at least two columns: resource name and author. If the input does not provide the required data structure, the transformation process is interrupted and a detailed warning message is shown. This kind of data exchange, without a high level of formalization, allows quick and independent plugin development. Additionally, we are still using mature KNIME support and thus we can benefit from native data management. This helps us especially in the case of large data sets – data are visualized, properly buffered and automatically persisted.
3.3
Integration with other tools
Designing DePress we focus on high reusability and integration possibilities. We wanted to reuse existing tools and focus on core tasks related to QA and SPI data integration to allow predictive modelling in software engineering. We do not want to develop any statistical or input-output (IO) support, but to focus on collecting or computing software metrics and software data sources integration. This was the main reason we decided to use KNIME as the integration backbone. As shown in Figure 6, we can benefit from the existing KNIME ecosystem and rapidly growing new plugin implementations and tools integration. Most importantly, KNIME offers, out of the box, integration with R [42], WEKA [43] and using extra plugins with Matlab [5]. Additionally, KNIME natively provides a wide range of analytic and mining algorithms. Besides statistical and analytical support, KNIME offers a number of data export/import plugins. For instance, analysed and transformed results could be exported as xls or arff files or could be persisted in an external database. One of the DePress usage scenarios assumes that data will be gathered inside a given company and then preparation of, for example, a defect prediction model will be outsourced to an external partner. Assuming that the data will be trained, e.g. using R, we may take advantage of model import/export support using the PMML [7], [44]
Unauthenticated Download Date | 8/28/15 9:41 PM
Software measurement and defect prediction ...
Metric Plugins
259
Statistics (R, Matlab, KNIME)
Adapter Plugins
Integration Backbone (KNIME)
Other
Data Mining (KNIME, Weka, RapidMiner)
Import/Export (XML, CSV, DB, ARFF, PMML, XLS, ...)
Scripting (Java, Python, Perl..)
DePress
Figure 6: DePress integration with 3rd parties standard.
3.4
Reporting
The DePress Framework, like any other plugin, could take advantage of KNIME reporting capabilities. The KNIME Report Designer is based on BIRT (Business Intelligence Reporting Tool) [45]. Apart from BIRT, we are able to export data as pdf, html reports or images depending on our needs.
4
Workflows
On the basis of a general defect prediction model building approach [46] we propose 2 types of workflows: learner workflow(Figure 7) and predictor workflow (Figure 8). Each workflow, in general, consists of the following steps: • Data Access. Data are retrieved from external systems or resources. • Data Transformation. Additional filtering, data cleaning and general data preparation, as well as the metrics computations. • Data Analysis and Mining. Use or development of defect prediction models. • Data Exploitation. Prediction results, trained models or reports are saved. In addition to data manipulation and transformation, depending on our needs, we can show or visualize data in every workflow step. As an example, we describe learner workflow shown in Figure 7. Let’s assume that we analyse version 1.1 of a hypothetical software unit, which was released six months
Unauthenticated Download Date | 8/28/15 9:41 PM
260
L. Madeyski, M. Majchrzak
Data Access
Data Transformation
GIT Plugin (pre release changes)
People & Organization Metric
Data Analysis & Mining
GIT Plugin (post release changes)
Jira Plugin
R To PMML
Row filter (Type:BUG)
Data Exploitation
Issue Metric
Joiner
PMML File Writer
R Learner
DB Writer EclipseMetric
Figure 7: Learner Workflow ago. In order to prepare the defect prediction model we have to make the following steps. First, we collect data from external sources. Software metrics for V 1.1 are retrieved using the Eclipse Metric plugin. Post release defects are computed using the Issues Per Artefact plugin, which, in turn, reads defect data (retrieved with JIRA plugin) and post-release source changes (retrieved with the GIT plugin). As an additional metric we compute People and Organization metrics using pre-release changes. We merge the data using the KNIME Joiner plugin. In the next step we use the KNIME R Learner plugin which is responsible for preparing a statistical model. The trained and tested model is saved using the KNIME PMML File Writer Plugin. Additionally, we save the merged data in an external database using the KNIME Data Base Writer extension. The trained PMML model can be used during hypothetical development of the next version (in our example V 1.2) of given software unit. As shown in the exemplary predictor workflow (Figure 8), we read the model using the KNIME PMML File Reader and we proceed to the defect prediction based on current software metrics. Results can be stored in an Excel (xls) file or we can generate a more advanced report using KNIME reporting capabilities.
Unauthenticated Download Date | 8/28/15 9:41 PM
Software measurement and defect prediction ...
Data Access GIT Plugin (post)
Data Transformation
Data Analysis & Mining
Data Exploitation Table To HTML
People & Organization Metric
EclipseMetric
261
Joiner
R Predictor
PMML File Reader
XLS Writer
Figure 8: Predictor Workflow
4.1
Evaluating DePress
DePress has been tested on a set of commercial (we have focused mainly on middle sized JEE projects with more than a four-year history), as well as open source projects. For instance, we have analysed commons-math version 2.1, which is a math Java library provided by the Apache Software Foundation. An example with a detailed description can be found on the DePress homepage (see Section 5). We found that after a short introduction inexperienced project members were able to retrieve data from project repositories and perform basic data analysis tasks. We performed also extensive load and reliability tests of DePress plugins using large software repositories from industrial projects. Our test data set consists of the SCM repository with approximately 18 000 modification reports (about 150 000 individual file changes) and the ITS repository with approximately 3000 issue reports. In future releases we plan to develop a set of examples which will be available on the DePress homepage [47]. They will cover data gathering from software repositories and predictive modelling. Similar to data sharing (see, e.g. PROMISE repository [48, 49], or other approaches towards more reproducible research [50]), which we think is incredibly important, and experiment sharing (see, e.g. Social Experiment Sharing initiative [51]), we will try to involve other researcher groups to share their work using DePress framework and workflows.
5
Open Source and Collaborative Development Model
Public and fully accessible source code is one of the success key factors and is often required by industrial partners, mainly for security reasons. Since we want to collab-
Unauthenticated Download Date | 8/28/15 9:41 PM
262
L. Madeyski, M. Majchrzak
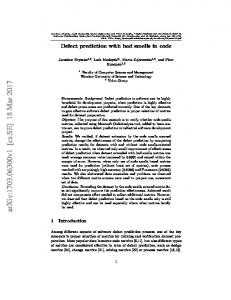
orate with industrial partners we have to guarantee system transparency. The next aspect is clear licensing rules. The collaboration between different organizations and researchers requires a transparent licence. After an analysis as well as discussions with one of our prospective industrial partners we have decided to use the GPL v.3 [52] licence in order to ensure that the collaborators’ work would make a contribution in both research and industrial communities. DePress is developed on the GitHub platform [53] as part of the ImpressiveCode Organization [47]. GitHub is a web based Git hosting service (Figure 9).
Figure 9: GitHub repository
dev
1. clone
Developer repository
3. merge
dev
master
2. pull request
DePress main repository
Figure 10: DePress collaboration model One of the reasons we decided to use GitHub was the social coding support [54]. Figure 10 shows the collaboration model. There are two code branches in the main repository. The master branch for finally approved work and the dev branch for current development. Each developer works in his/her own repository (1). After the work is completed he/she sends a pull request
Unauthenticated Download Date | 8/28/15 9:41 PM
Software measurement and defect prediction ...
263
(2) to the dev branch. After that, code changes are reviewed, and the feature owner or the project coordinator approves or rejects them. New features are merged (3) with a master branch after successful integration tests. For feature requests, project management and bugs reporting we currently use JIRA [55]. In early project phase we used GitHub Issues [56]. DePress is being actively developed by a group of PhD and MSc graduate students lead by the first author.
6
Case study
In this study we have described predictive modeling of post-release defects in Commons Math v2.1 library. The whole process has been performed with DePress and KNIME Framework only. The Commons Math is a library of lightweight, self-contained mathematics and statistics components, addressing the most common problems not available in the Java programming language. The library is build on top the Java SDK without any external dependencies. Its design base fully on well known OO design principles. The library has been released for the first time in July 2007, and the latest released version has been officially available since April 2013. The Commons Math project is developed by group of volunteers and Apache developers. Apache Foundation provides unrestricted access to version archives and to all project-related software repositories. Table 1 shows the basic characteristics of the 2.1 version. Despite the fact that the code basis is relatively small, the project has a high coverage of JUnit tests. We will analyse its history in the first year after the release. Release Time period Transactions Files changed Classes No. of active dev. Post-rel. defects reported No. of new features reported
2.1 31.03.2010 - 31.03.2011 318 2191 298 4 40 34
Table 1: System in benchmark In order to simplify the analysis we divided the workflow into 4 main steps: data collection, data preprocessing, predictive modelling and archiving. Each step was collapsed into KNIME meta node. Meta nodes are nodes that contain subworkflows, i.e. in the workflow they look like a single node, although they can contain many nodes. Figure 11 shows the main workflow view in KNIME. Each meta node contains additional text description.
Unauthenticated Download Date | 8/28/15 9:41 PM
264
6.1
L. Madeyski, M. Majchrzak
Data collection
The Commons Math sources are located originally in the SVN repository. Nevertheless, the Apache Foundation decided to create mirror on GitHub platform. In view of the fact that the Git is much faster than the SVN, we decided to use the mirror repository and Git Offline DePress node. Post-release defects. To analyze the SCM transaction history we retrieved all transactions from MATH 2 X branch. In order to make transaction report readable for the Git Offline node we used dedicated git log command, described in plugin help. Default Git transaction does not contain information required in further processing. In the next step we extracted (Extract Time Window node) all rows where the time value of the selected column lies within a given time window from the input. The time window is specified in Table 1. After loading and extracting proper logs, data was transferred to Marker Parser node for issue marker extraction from comments stored in the SCM transaction. In the next step, we retrieved issues from the Jira repository. Selected items met all the criteria listed below: 1. Type: Bug 2. Status: Closed, Resolved, Reopened 3. Resolution: Fixed, Duplicated 4. Priority: Blocker, Critical, Major, Minor 5. Affects Version: 2.1 The exported XML has been directly passed to JIRA Offline node. In the next step, using Issues per Artifact node, changes from the Git and issues from Jira were linked via, extracted in previous step, defect marker. The obtained results will be used, in the next phase, as a post-release defect metric. Source code metrics. Many approaches in the literature use the CK Java Metrics [38]. The complex components are harder to change. As a result of their complexity, software engineers are not able to perform proper tests, and hence defects. Additionally, we computed the code coverage metrics using JaCoCo [32]. Both software metrics were computed outside KNIME, using DePress plugins (Eclipse Metric and JaCoCo Adapter node) we converted the data and imported into KNIME workflow.
Figure 11: Data preprocessing and predictive modelling workflow.
Unauthenticated Download Date | 8/28/15 9:41 PM
Software measurement and defect prediction ...
265
The post-release defects, CJKM and code coverage metrics were joined via Joiner node. It is important to mention that, because the Eclipse Metrics and the Issues Per Artifact nodes may return an incomplete list of the project classes, we decided to use JaCoCo results as a baseline.
6.2
Preprocessing the data
We removed the columns which were unnecessary from the point of view of predictive modeling, and replaced missing values. By ”missing” we simply mean ”not present” in the joined data set. Incomplete values occurred, because the Eclipse Metric was not able to properly cope with some Java types. Secondly, not all the files (classes) were changed in the time period under consideration, hence the Issues per Artifact plugin didn’t compute the metric and, therefore, it didn’t include them in the output. In this case, we replaced missing values in HasIssues and NumberOfIssues columns with 0. The only missing value in the dataset, we accepted, was the column Branch Coverage. The missing value is correct and simply means that the underlying class does not have methods with conditional statements.
6.3
Predictive modelling
In the commons-math case study, we follow the methodology described below. Attribute selection. A large number of attributes might lead to an over-fitting a model. Also highly correlated attributes are problematic. To solve that problem, we employ an attribute selection technique called a future elimination. Feature Elimination is a predefined KNIME meta node. It is based on the backward elimination of the irrelevant variables. It uses explicitly the error rate during the selection process. Building regression model. We based our prediction on the classification decision tree. The dependent variable (the predicted attribute) is the boolean attribute HasIssues indicating whether or not in a given class post-release defect was found. The independent variables are the data set of metrics selected in feature elimination process. In order to train the model we use the KNIME Decision Tree Learner node. K-folds cross validation. We obtain an ”optimal” subset of variables but we know that this solution relies heavily on the learning set. Cross validation is a statistical method of evaluating and comparing results of a learning algorithm by dividing data into two segments: one used to learn a model and the other used to validate the model. KNIME offers a special type of meta node for this purpose. Cross Validation is a meta node which encapsulates an inner workflow which is executed several times, the results of each iteration are collected and returned as a result of the node. We decided to use 10-iterations and random sampling. To get the overall cross validation error rate, we used the KNIME Scorer node.
Unauthenticated Download Date | 8/28/15 9:41 PM
266
6.4
L. Madeyski, M. Majchrzak
Results and their archiving
To asses the model one may use a wide range of measures (e.g. the precision, recall, accuracy) and predictive modelling techniques supported by KNIME (including R packages like caret). To make our case study reproducible, we share our workflows and input datasets on the DePress Homepage. Archiving is essential. We decided to store joined datasets in two formats of xls and arff. Additionally, we saved the PMML model. The model could be used in the next project release, especially during the development or during the testing campaign to concentrate test budget and efforts on specific defect-prone components.
7
Summary and Future Work
In this paper we have proposed a visual and workflow-oriented approach, corresponding implementation and usage examples of a framework for data acquisition from software repositories and tools, as well as predictive modelling in software engineering environments. We have used KNIME as an integration backbone and we developed a set of useful plugins. The project’s infrastructure supports not only software defect prediction but also, to some extent, other areas of predictive modelling in software engineering where the collected metrics can serve as predictors. For example, collecting data related to time developers spent on assigned tasks (using our plugin to JIRA) can help us to build effort prediction models. Future work. Our future plans mainly focus on further plugin development to support new data sources, e.g. new software development and measurement tools. Additionally, we want to introduce support for code churn and burst change related metrics [57]. Apart from further development of DePress, we also plan to conduct a study to evaluate the effectiveness of DePress usage by QA Engineers in commercial software projects. We also plan to improve the DePress development environment itself in order to open it to a wider group of contributors and researchers. We want to introduce new features, such as continuous integration support, test automation, user manuals, tutorials and become KNIME trusted community contributor.
References [1] M. D’Ambros and M. Lanza, “Distributed and Collaborative Software Evolution Analysis with Churrasco,” Sci. Comput. Program., vol. 75, pp. 276–287, Apr. 2010. [2] G. Ghezzi and H. C. Gall, “Distributed and collaborative software analysis,” in Collaborative software engineering (I. Mistrik, J. Grundy, A. van der Hoek, and J. Whitehead, eds.), pp. 241–263, Heidelberg, Germany: Springer, January 2010.
Unauthenticated Download Date | 8/28/15 9:41 PM
Software measurement and defect prediction ...
267
[3] M. Hall, E. Frank, G. Holmes, B. Pfahringer, P. Reutemann, and I. H. Witten, “The WEKA data mining software: an update,” ACM SIGKDD Explorations Newsletter, vol. 11, no. 1, pp. 10–18, 2009. [4] R. Ihaka and R. Gentleman, “R: A language for data analysis and graphics,” Journal of computational and graphical statistics, vol. 5, no. 3, pp. 299–314, 1996. [5] M. U. Guide, “The mathworks,” Inc., Natick, MA, vol. 5, 1998. [6] M. R. Berthold, N. Cebron, F. Dill, T. R. Gabriel, T. K¨otter, T. Meinl, P. Ohl, C. Sieb, K. Thiel, and B. Wiswedel, “KNIME: The Konstanz Information Miner,” in Studies in Classification, Data Analysis, and Knowledge Organization (GfKL 2007), Springer, 2007. [7] D. Morent, K. Stathatos, W.-C. Lin, and M. R. Berthold, “Comprehensive PMML preprocessing in KNIME,” in Proceedings of the 2011 workshop on Predictive markup language modeling, PMML ’11, (New York, NY, USA), pp. 28–31, ACM, 2011. [8] Data Mining Group, “PMML Powered.” http://www.dmg.org/products.html, 2012. [9] T. Meinl and G. Landrum, “Get your chemistry right with knime,” Journal of Cheminformatics, vol. 5, no. Suppl 1, p. F1, 2013. [10] W. A. Warr, “Scientific workflow systems: Pipeline Pilot and KNIME,” Journal of computer-aided molecular design, pp. 1–4, 2012. [11] M. P. Mazanetz, R. J. Marmon, C. B. Reisser, and I. Morao, “Drug Discovery Applications for KNIME: An Open Source Data Mining Platform,” Current topics in medicinal chemistry, vol. 12, no. 18, pp. 1965–1979, 2012. [12] M. Jureczko and J. Magott, “QualitySpy: a framework for monitoring software development processes,” Journal of Theoretical and Applied Computer Science, vol. 6, no. 1, pp. 35–45, 2012. [13] Marian Jureczko and contributors, “Quality Spy.” http://java.net/projects/qualityspy. [14] The Apache Software Foundation, “Apache License, Version 2.0.” http://www.apache.org/licenses/LICENSE-2.0.html. [15] N. Fenton, P. Krause, M. Neil, and C. Lane, “A Probabilistic Model for Software Defect Prediction,” 2001. [16] N. E. Fenton and M. Neil, “Software metrics: success, failures and new directions,” J. Syst. Softw., vol. 47, pp. 149–157, July 1999. [17] Agena, “Agenarisk Desktop.” http://www.agenarisk.com.
Unauthenticated Download Date | 8/28/15 9:41 PM
268
L. Madeyski, M. Majchrzak
[18] S. Demeyer, S. Tichelaar, and S. Ducasse, “FAMIX 2.1 - The FAMOOS Information Exchange Model,” tech. rep., University of Berne, 2001. [19] TIOBE, “Programming Community Index.” http://www.tiobe.com/index.php/content/paperinfo/tpci/index.html, 10 2013. [20] Black Duck Software, “Ohloh Index.” https://www.ohloh.net/languages. [21] H. C. Gall, B. Fluri, and M. Pinzger, “Change Analysis with Evolizer and ChangeDistiller,” IEEE Software, vol. 26, no. 1, pp. 26–33, 2009. [22] B. Fluri, M. W¨ ursch, M. Pinzger, and H. Gall, “Change distilling: Tree differencing for fine-grained source code change extraction,” IEEE Transactions on Software Engineering, vol. 33, pp. 725–743, NOV 2007. [23] The Eclipse Foundation, “Eclipse.” http://www.eclipse.org/. [24] G. Ghezzi and H. C. Gall, “SOFAS: A Lightweight Architecture for Software Analysis as a Service,” in 2011 Ninth Working IEEE/IFIP Conference on Software Architecture, pp. 93–102, IEEE, June 2011. [25] W3C, “Sparql query language for rdf.” http://www.w3.org/TR/rdf-sparql-query/. [26] M. Fischer, M. Pinzger, and H. Gall, “Populating a release history database from version control and bug tracking systems,” in Software Maintenance, 2003. ICSM 2003. Proceedings. International Conference on, pp. 23–32, IEEE, 2003. [27] L. Madeyski and N. Radyk, “Judy-a mutation testing tool for Java,” Software, IET, vol. 4, no. 1, pp. 32–42, 2010. http://madeyski.e-informatyka.pl/download/Madeyski10b.pdf. [28] L. Madeyski, W. Orzeszyna, R. Torkar, and M. J´ozala, “Overcoming the equivalent mutant problem: A systematic literature review and a comparative experiment of second order mutation,” IEEE Transactions on Software Engineering, vol. 40, pp. 23–42, January 2014. http://dx.doi.org/10.1109/TSE.2013.44. [29] L. Madeyski, Test-Driven Development: An Empirical Evaluation of Agile Practice. (Heidelberg, London, New York): Springer, 2010. http://www.springer.com/978-3-642-04287-4. [30] L. Madeyski, “The impact of test-first programming on branch coverage and mutation score indicator of unit tests: An experiment,” Information and Software Technology, vol. 52, no. 2, pp. 169–184, 2010. Draft: http://madeyski.e-informatyka.pl/download/Madeyski10c.pdf. [31] L. Madeyski, “The impact of pair programming on thoroughness and fault detection effectiveness of unit tests suites,” Software Process: Improvement and Practice, vol. 13, no. 3, pp. 281–295, 2008. Draft: http://madeyski.e-informatyka.pl/download/Madeyski08.pdf.
Unauthenticated Download Date | 8/28/15 9:41 PM
Software measurement and defect prediction ...
269
[32] JaCoCo. http://www.eclemma.org/jacoco/. [33] F. Sauer, “Eclipse metrics plugin.” http://metrics.sourceforge.net/. [34] Checkstyle. http://checkstyle.sourceforge.net/, 2007. [35] PMD. http:/pmd.sourceforge.net/. [36] PIT. http:/pitest.org/. [37] FindBugs. http:/findbugs.sourceforge.net/. [38] S. R. Chidamber and C. F. Kemerer, “A metrics suite for object oriented design,” IEEE Transactions on Software Engineering, vol. 20, no. 6, pp. 476–493, 1994. [39] N. Nagappan, B. Murphy, and V. Basili, “The influence of organizational structure on software quality: an empirical case study,” in Proceedings of the 30th international conference on Software engineering, pp. 521–530, ACM, 2008. [40] Atlassian, “REST Plugin Module.” [41] TMate Software, “SVNKit.” http://svnkit.com/. [42] R Core Team, R: A Language and Environment for Statistical Computing. R Foundation for Statistical Computing, Vienna, Austria, 2014. [43] I. H. Witten, E. Frank, and M. A. Hall, Data Mining: Practical Machine Learning Tools and Techniques. San Francisco, CA, USA: Morgan Kaufmann Publishers Inc., 3rd ed., 2011. [44] G. Williams, M. Hahsler, H. Ishwaran, U. B. Kogalur, and R. Guha, pmml: Package ’pmml’, 2012. R package version 1.2.32. [45] BIRT. http://www.eclipse.org/birt/phoenix/. [46] N. Nagappan, T. Ball, and A. Zeller, “Mining metrics to predict component failures,” in Proceedings of the 28th international conference on Software engineering, pp. 452–461, ACM, 2006. [47] L. Madeyski and M. Majchrzak, “ImpressiveCode DePress (Defect Prediction for software systems) Extensible Framework,” 2012. Available as an open source project from GitHub: https://github.com/ImpressiveCode/ic-depress. [48] T. Menzies, B. Caglayan, Z. He, E. Kocaguneli, J. Krall, F. Peters, and B. Turhan, “The PROMISE Repository of empirical software engineering data,” June 2012. [49] M. Jureczko and L. Madeyski, “Towards identifying software project clusters with regard to defect prediction,” in Proceedings of the 6th International Conference on Predictive Models in Software Engineering, PROMISE ’10, (New York, NY, USA), pp. 9:1–9:10, ACM, 2010.
Unauthenticated Download Date | 8/28/15 9:41 PM
270
L. Madeyski, M. Majchrzak
[50] L. Madeyski and M. Jureczko, “Which Process Metrics Can Significantly Improve Defect Prediction Models? An Empirical Study,” Software Quality Journal, 2014. DOI: 10.1007/s11219-014-9241-7 (accepted), preprint: http://madeyski.e-informatyka.pl/download/Madeyski14SQJ.pdf. [51] D. De Roure, C. Goble, and R. Stevens, “The design and realisation of the myexperiment virtual research environment for social sharing of workflows,” Future Generation Computer Systems, vol. 25, pp. 561–567, 2009. [52] Free Software Foundation, Inc., “GNU General Public License.” http://www.gnu.org/licenses/gpl-3.0.en.html. [53] GitHub Inc. http://www.github.com. [54] L. Dabbish, C. Stuart, J. Tsay, and J. Herbsleb, “Social coding in GitHub: transparency and collaboration in an open software repository,” in Proceedings of the ACM 2012 conference on Computer Supported Cooperative Work, CSCW ’12, (New York, NY, USA), pp. 1277–1286, ACM, 2012. [55] M. Majchrzak and L. Madeyski, “DePress JIRA.” https://depress.atlassian.net/browse/DEP, 2013. [56] L. Madeyski and M. Majchrzak, “DePress GitHub Issues.” https://github.com/ImpressiveCode/ic-depress/issues, 2012. [57] N. Nagappan, A. Zeller, T. Zimmermann, K. Herzig, and B. Murphy, “Change Bursts as Defect Predictors,” in Software Reliability Engineering (ISSRE), 2010 IEEE 21st International Symposium on, pp. 309 –318, nov. 2010. Presented at the 16th KKIO Software Engineering Conference, 22-24 September 2014, Poznan, Poland
Unauthenticated Download Date | 8/28/15 9:41 PM