Software Process Measurements using Software Configuration Management Ivica Crnkovic1, Magnus Larsson2, Frank Lüders3 1
Mälardalen University, Department of Computer Engineering, 721 23 Västerås, Sweden,
[email protected] 2 ABB Automation Products AB, LAB, 721 59 Västerås, Sweden,
[email protected] 3 ABB Automation Products AB, LAB, 721 59 Västerås, Sweden,
[email protected]
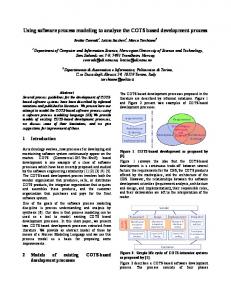
Abstract Software Configuration Management (SCM) is the controlled way to manage the development and modification of software. For an efficient SCM process different SCM tools can be used to collect information about items being changed in the development or maintenance process. Advanced SCM tools include also Change Management which collects information related to the change process in a project. There is a huge amount of information stored in SCM repository and this information can be used as input to Software Metrics for Size- and Process-Oriented Metrics. This paper describes how SCM data can be utilised for Process-Oriented Software Metrics. To identify the changes performed in a software system, SCM uses Change Requests (CR). By placing CRs under version control, it is possible to measure the nature of change process: The measurements taken on CRs give information not only about the number and type of changes but also about the development process behaviour. These measurements can be used during the development process and in the final analysis of the project. Main advantages of using data stored by SCM is the accuracy of the data, and that it is not necessary to put extra efforts to register the data (they are updated automatically when certain actions related to the SCM process are performed). As an implementation example, the paper presents a change-oriented SCM tool used at ABB Automation Product AB, and measurements showing certain cases of different lifecycle models.
1. Introduction There are numbers of different software metrics and they can be classified in relation to the relevant development process, products or resources [1]. Typical product metrics are size metrics (number of lines of code, number of documents, etc.), quality metrics, etc. Process metrics are on the other hand a result of measurements related to the different phases of the development process. Process measurements help us to understand the processes concerned, to control them, improve and predict them [2]. Size metrics are relative easy to obtain, especially if SCM is systematically used, and size metrics are easy to interpret, since they are often obtained by direct measurements. It is more difficult to provide the process metrics. The identification of data to measure is not trivial, even if there exist established approaches, such as the Goal-Question-Metric approach [3]. The interpretation is also difficult, and even the measurements are not straightforward. Can SCM tools provide information for process measurements? The answer is yes for tools which integrate process management with SCM, for example ClearGuide [4], Continuus [5],[6] or PVCS Tracker [7]. The basic idea of the change oriented CM tools is to control changes instead of files. Change management controls relations between logical changes and physical changes implemented in files within a system. The term Change Request (CR) is used to refer to a logical change. Change Requests give
information about the system changes and in this indirect way provides information for process metrics. Since a process is a set of related actions distributed in time, the time parameter must be considered in such measurements. Using SCM data to obtain different measurements related to the changes is widely recognised as an efficient method [8]. By placing Change Requests under version control we get a new dimension of the measurements. It is possible to trace the history of changes themselves. This function is available in a change-oriented SCM tool, designated Software Development Environment (SDE) [9], developed and used at ABB Automation Products. This paper describes the measurements performed on Change Requests. Different metrics showing the behaviour of the development process are presented and discussed.
2. Change Management Change Management is a significant part of the SDE support. Any change in SDE is under change-set [13] control. A basic item of SDE Change Management is a Change Request (CR), an entity which describes a logical change to be made in a software system. By a logical change we mean a change described on a functional, abstract level, rather than a physical, such as specification of which files should be changed. Change Requests describe changes of any kind: Introduction of a new function, improvement of existing functions, fixing an error, or any administrative change which can improve the development process, but do not change the system functionality. Depending of the nature of a Change Request we have different sources of them. CRs, describing new functions, are created from requirements or design specifications, while CRs, describing errors, from defect reports. They can also be created directly during the implementation or integration phase, pointing to activities which must be executed and which are not seen outside the development environment. During the development process CRs gather information about physical changes made in the system: When a developer checks in a file, he/she refers to a related CR. The names of the files, their versions and log message related to the file changes, are registered in the CR. The final version of a CR includes both a description of a functional change and information about all modified file versions. A Change Request passes through different states during the development process. When a CR is created it is in the state Initiated. During the work sessions it passes through other states, such as Experimental, Implemented, Tested and eventually reaches the Terminated state. The CRs integrated in a product release are in the state Released. Figure 1 shows different states of a CR in the development process. Initate project CR States
Modify files (check out/in)
Init
Figure 1.
Exp
Complete changes Impl
Test
Teste
Approve
Release
Term
Rel
Change Requests in a development process
Change Requests are automatically updated by different tools. For example, the original RCS [10] check-in command has been modified: When a programmer checks in a file he/she also specifies CRs to which the checked-in file version is related. The ci command first checks in files and then updates the specified CR. The new CR versions include the names, the versions and the log messages of the checked in files. Every update of a CR automatically creates a new CR version. CRs include information about the request itself, and other data that can be used for the measurements and the process management: who is responsible for the CR, who has done the modifications, when they have been done, etc. Figure 2 gives an example of a CR. CR-crls - CR does nor recognise the -s exp option State: Released Responsible: Modified: 1999-10-10 Created: Type: Error Priority: Function: crls Efforts (hours): File: File:
icc 1999-09-12 Medium 14
./work/cr-app/crls.cpp 1.4 ./work/cr-app/crls.h 1.2 1.3
Description: Crls does not work properly with -s Exp option. The command does not find CRs with this state. Change History: ./work/cr-app/crls.h 1.2 The default value of CR State is set to Exp ./work/cr-app/crls.cpp 1.4 Processing Exp in now properly processed ./work/cr-app/crls.h 1.3 Fixing the default value (Exp instead of exp)
Figure 2. An example of a Change Request Change Requests are under version control. Each time a CR is changed it is automatically checked out and after the modification, checked in. As a versioned file under RCS control, a CR includes not only the change description and list of changed file versions, but also each version has specified different attributes: a version state, a responsible user (author), date of change, etc. These attributes are used to obtain process measurements.
3. The Development Process One of the big challenges of a large software development process is to keep track of the current sate of the project. It is difficult to have an overview of a process involving hundreds of developers. Without having a good insight in the current project state, it is even more difficult to plan and estimate the efforts and time needed for the project completion. One way of minimising such uncertainty is to automatically register any change done in the system and follow up the data registered. It is, however, not enough to save information about the concrete changes made on entities such as source-code or documents. Number of lines changed or created in source code may give an indication how much work has been done, but not how much work has been left. Measurements on a higher level of abstraction can give a better insight. That is how the development process is controlled at ABB Automation Products: Measurements of changes performed on a both functional and on concrete level (which files and which lines in files have been changed). Figure 3 illustrates the development process where all are under control of change requests and different defect report tools.
System Problem Reports (SPR) Pre-release Problem Reports (PPR)
Change Requests
CRB
CRA
CRA1 CR A1 CR A1
Files Files
Files Files
CRA
CRP CR P
CRP CR P
SPR SPR
SPR SPR
CRR CR R
CRR CR R
CRA1 CR A1 CR A1
A-v2 A-v2
Baseline1
Baseline2
Development
BB
B-v1 B-v1
A-v1 A-v1
Figure 3.
PPR PPR
CRB
CRA
Functions implemented
PPR PPR
Files Files
Files Files AA
Beta
A/1 A/1
1.0 Tests
B/1 B/1
1.0-1
Product usage
The development process with change management
When the development project is in the start phase, Change Requests describe new functions that are supposed to be implemented. These Change Requests are generated from the system requirements and from the design specifications. When the developers start to implement the functions and start to create new files (source code or documents) the changes performed are automatically registered in the related Change Requests. During the development process, several snapshots of the system can be taken, i.e. the system can be baselined (designated A-v1 on Figure 3). The selected item versions and the related CRs are used for building a system pre-release. At that point the CRs, describing the functions completed, can be closed. The pre-release can be tested, or used as input to other projects, but the development of new functions can continue. Other CRs (CRB on the figure), not yet implemented, describe the functions that are planned to be developed in the next period. At the same time, the functions already implemented may include errors, need to be improved, or certain new features are supposed to be added. The changes required for these functions will be specified in new CRs (CRA1). The development process continues to the second baseline, third baseline and so on, until the project reaches the system test phase, and the product is released as a beta version. This version is now tested by a test-group which does not have access to the development environment, but performs tests in the pure run-time environment. All findings of product defects are registered in a defect database (pre-release product reportPPR). A Configuration Control Board (CCB) decides which defects should be eliminated, and for all activities, decided to be done in the project, CRs are automatically generated. During this phase, the information from the test-team and the developers is exchanged via CRs and PPRs. The test team reports the test results in PPRs which generate new CRS, and CRs update PPRs with the information of what has been changed. After the test completion and the product release, all the defects are recorded in a product defect database (System Problem Report - SPR). Again, when CCB decides to implement the changes required from the error reports, new CRs are generated from the SPR database, and the maintenance process is performed in a similar way as the development process.
4. CR Metrics The main purpose of using CRs is to obtain an overview of the current project status, and the have documented all changes done in a project and a product release. The second purpose is to increase the predictability of the behaviour of the project. To achieve these objectives we need answers to the following questions: -
How many changes have been made, how many changes should be made? What types of changes are in the process? What is the dynamic of the changes? What are our expectations on new changes and how does the project respond to them? How are changes distributed among developers? What is the current state of change per developer? How many changes must a developer implement? How did the change process look in a completed project?
CRs contain data that can be used for finding the answers. The number of changes, their states, classification according to priority, type or function, number of changed files, etc. is one type of possible metrics. These types of data give information about the project current state, i.e. they provide static information. Since CRs are under version control, the history of every change is also available. The states of all changes are available for the whole period of the development process. These data give us information about the dynamics of changes and in this way indicate the development process behaviour. Since CRs contain data about developers being involved in the change process, it is possible to obtain metrics for the entire development project and specifically for every member. The measurements can be used during the project execution, but they can be even acquired from old projects. CR-Metrics, an application integrated in SDE, collects data from CR libraries, by parsing CRs. Information about every CR version is taken and saved in a spreadsheet in a form suitable for presentation. The measurements are displayed as embedded Excel objects [11] in the form of different graphs. All data can be presented for the whole project, or for the entire product being developed in several projects. Specific types of changes can be analysed as well (for example, changes related to error-fixing, or changes related to the implementation of new functions). All the measurements can be extracted for individual developers as well. The following are some of the metrics obtained by The CR-Metrics application: - Current status - The CR states for each period (for example month or week). The measurements show the current project state and the dynamic of its change. - Accumulated CRs - Completed and incomplete CR are sorted according to date, i.e. the change completion dynamic is shown. - New CRs - The measurements show the number of new CRs being created in a time interval. The graph shows the stability of the product requirements. - Latest Changes - The CRs being moved to new states. Data show the dynamic of completion of the activities, for example how changes have been started investigated, how many have been opened, etc. - New and completed - The number of new and the number of completed (“input” and “output”) CRs per time interval are shown. The measurements show the ability of the project to fast response to the change requirements. - CR life length - A distribution of CR life lengths is shown. The time distribution of the change completion is presented.
5. Measurements This chapter discusses some measurements performed on certain development projects. The measurements have been used during the project development and in the analysis of the project process after their completion. The first project example, WinSDE, uses a development model which is a combination of the spiral model and the evolutionary prototyping model [12]. The development is performed as a number of iterations, each consisting of several phases: prototyping, evaluation of different alternatives, refining the prototype, developing and building the deliverables and a plan for the next iteration. An implication of this model is a monotonic growth of the number of CRs - new requirements are defined during each iteration (refinements) and at the beginning of the new iteration (new functions). In the last iteration the number of new CRs describing new functions declines, but new CRs related to the release activities are still being created. The test activities with CR termination become more intensive at the end of each iteration, but especially at the end of the project. The unsolved CRs are postponed to a succeeding release. The current status graph (Figure 4) shows the number of CRs created during the project. The total number of CRs, classified according to their states, is presented for each period in a form of accumulated CRs (left graph) and current states (right graph). The graphs show that the number of new CRs grows monotonically. The number of completed CRs increases with the same dynamic. The number of open CRs is approximately the same during the entire project except during the last phase. Some steps on the graph showing completed CRs can be recognised. These steps correspond to the deliveries of product pre-releases: When the time for a new delivery approaches, many CRs are terminated. During the same period not many new CRs are created. In the beginning of the next iteration, a number of new CRs grows, while very few or no CR is completed. The graphs show many resting CRs, which indicate to a potential week point of the project. Why the number of postponed CRs grow fast in the project start phase and keeps to grow until the latest phase in the project? The graph on the right shows clearly that the number of open CRs is constant during the implementation phase, and that the number of CRs completed increase uniformly. The reason for this was the nature of the product. WinSDE is an internal product, which makes it possible to deliver releases and pre-releases more often and continuously respond to the users requirements. The question of the project completion, and a product release, was the question of the quality requirements (where all form tests have been executed) and of synchronisation with other products being developed in the organisation. The questions related to the resting CRs require further measurements and analysis, to answer what type of change requirements it is about, etc. 100
80
WinSDE 1.2-0 - Current State
100
30
SDE 1.2-0 - Current CR States
CRs
25
80
20
60
60 15
40
40 10
20
0 98-01
20
5 0
0 98-03
98-05
Completed
98-07
Open
98-09
Resting
98-11
98-01
98-03
98-05
98-09
98-11
New Completed
Figure 4.
98-07 Open
Resting
Current states of CRs for a project using the Spiral model
New
CRs
C++ Complib 3.0 - Current status
C++ Complib 3.0 - Current status
25
20
20
15
15
CRs
25
10
10 5
5 0 98-04
98-06
98-08
98-10
0 98-04
98-12
Completed
Completed Open Resting New
Figure 5.
98-06
98-08
Open
98-10
Resting
98-12
New
Current states of CRs for a project using the Waterfall model
Measurements on a project following the Waterfall model (Figure 5) shows a different change process. In the project initiation phase, all the requirements have been defined and CRs have been created. The graph shows how the work has improved. The number of open CRs increases uniformly with predictable pause in the vacation period. The linearity of the decreasing curve of the not yet open CRs (the right graph), makes is possible to predict the completion of the implementation phase. Similarly the test phase, shows the linear progress in testing of CRs. The last period is characterised by few open CRs, which describe the integration process and the acceptance test. The left graph in Figure 6 shows “how much work has been done, how much is still to do” for each period. Since such a graph is available for all project members together, or for individual developers, planning and estimation for different groups can be done. These measurements are typically used during the implementation and test phase. The graph on the right side shows the dynamics of creation of new CRs. The smooth saturation of accumulated CRs curve shows less number of incoming CRs (for example less new requirements or less error reports). By the extrapolation of the curve it is possible to estimate the stability of the projects and make more accurate plans for the project completion. 100
WinSDE 1.2-0 - Accumulated CRs
30
100
25
80
CRs 80
20
60
WinSDE1.2-0 - NewCRs
60
15 40
40
10 20
0 98-01
98-03
98-05
98-07
Processing
98-09
Completed
Figure 6.
98-11
5
20
0
0 98-01
98-03
98-05
98-07
NewCRs
Completed CRs and remaining CRs
98-09
98-11
NewCRs - total
Figure 7 shows the distribution of CRs life lenghts i.e the distribution of time needed to implement the change requests. The time on the X-axis is the time interval between the reception of the CR and the completion of the change. The Y-axis shows the number of changes that are completed in the specified period. The graph shows that about 50% of CRs are implemented within six months and that more than 80% of CRs are completed within twelve months. The higher percentage is valid for the high-priority CRs. The measurements suggest that it would be meaningful to deliver the product within that period without waiting further eight months for making the remaining changes planned in the project. Another indication is that there is a tendency to “forget” CRs with lower priority and CRs that require more effort to implement. W inSDE 1.2-0 CRs Life length
12
100%
CRs 10
80%
8
60%
6 40%
4 2
20%
0
0% 1
3
5 7 High Priority
9
11 13 Low Priority
15 17 19 CRs com pleted %
21
Figure 7. Distribution of times for making changes
6. Conclusion Systematic measurements and their analysis have been done in several development and maintenance projects at ABB Automation Products. For example, the projects developing SDE have used the measurements on weekly basis and the measurements have been discussed on the project meetings. In average seven developers were involved in every project, managing 300 000 of code lines. Every project lasted from eight to eighteen months processing between 100 and 200 CRs. The project manager collected measurements for the entire project, while developers looked at the measurements they have been involved in. These measurements, together with other reports generated from the SCM system have been used for the analysis of the project current state and for the planning of the next period. The measurement analyses have led to an increased awareness for the requirements, timeliness, and quality issues. A great advantage in the process was the possibility to easily collect the measurements and present them in a suitable format. The second advantage was accuracy of the acquired information. Indeed, the only measurements, which the project members complained about, were those which were not generated automatically. When closing a CR the developers have reported working hours spent on it and many developers claimed that they could not do it accurately. Another uncertainty was related to different characteristics of CRs. For example, the scopes of CRs varied much, from a description of a banal defect correction up to requirement of implementation of new, large functions. The latter are typically generated from the requirements and design specifications. These CRs are often related to many CRs which are created later and which describe more specific changes. This experience suggests that there is a need for further analysis and metrics classifications: relations between CRs, the scopes of changes required, type of changes required, etc.
In some other projects it was recognised that the developers very easily create new CRs, and the process of implementation went according to the plans, but the CRs termination process had been unnecessary postponed. These findings have led to new demands on the change process, first of all for an automatic check for CRs termination when changes in all related files are completed. In general the case studies have shown very similar patterns of metrics: Three projects for the Spiral model have been measured, and the results from CR-metrics have shown many similarities. The total number of CRs was three times greater than the number of CRs at the outset. The number of postponed CRs was approximately 20% of the total number of CRs (which suggests a weakness in the project planning). The number of open CRs, i.e CRs being processed, was constantly about five per developer during the development process in all projects. The most interesting fact is that the shapes of the curves in all projects were similar. The idea is to use CR-metrics during execution of the project when both the project manager and project members can follow up the project status. The final measurements can be taken at the completion of the project. The metrics can be compared with those from other projects and related to other facts. One advantage of the tool is the possibility of collecting data from earlier projects, as all data concerned is under SCM control.
7. References [1] The Software Measurement Laboratory, University of Magdeburg, http://irb.cs.unimagdeburg.de/sw-eng/us/metclas/index.shtml [2] William A Florac, Robert E. Part, Anita D. Carleton – “Practical Software Measurement: Measuring for process management and Improvement”, Software Engineering Institute, Carnegie Mellon University, Technical report, CMU/SEI-976-HB-003, April 1997 [3] Norman E. Fenton, Shari Lawrence Pfleeger, “Software Metrics, A Rigorous & Practical Approach”, ISBN 0-534-95425-1, PWS Publishing Company [4] David B. Leblang, “Managing the Software Development Process with ClearGuide”, Software Configuration Management ICSE’97 Workshop, Boston, May 1997, proceedings, Springer Verlag, ISBN 3-540-63014-7, pages 66-80 [5] Continuus Software Corporation, http://www.continuus.com/homepage.html, 1998 [6] Continuus Software Corporation, Task-Based Configuration Management, Version 2.0, http://www.continuus.com/developers/developersACEA.html [7] MERANT, http://www.merant.com/pvcs/products/tracker/index.asp [8] Todd L. Graves, Audris Mocus, “Inferring Changes Effort from Configuration Management Databases”, Proceedings Fifth International Software Metrics Symposium 1998., pp 267-273 [9] Ivica Crnkovic, “Experience with Change-Oriented SCM Tools”, Software Configuration Management ICSE’97 Workshop, Boston, May 1997, proceedings, Springer Verlag, ISBN 3540-63014-7, pages 222-234 [10] Walter F. Tichy, RCS – “A System for Version Control”, Software and Practice Experience, 15(7):635-654, 1985 [11] Microsoft Visual Basic 5.0 ActiveX Controls Reference, 1997, ISBN 1-57231-508-3 [12] Steve McConnell, “Rapid Development: timing wild software schedules”, Microsoft Press, 1996, ISBN 1-55615-900-5 [13] Darcy Wiborg Weber, “Change Sets versus Change Packages”, Software Configuration Management, SCM-7, Springer Verlag, ISBN 3-54063014-7, 1997, pages 25-35