Behavior Research Methods, Instruments, & Computers 1997, 29 (3), 461-463
Software to calculate measures of sensitivity and response bias based on detection theory and threshold theory KOEN VAN DER GOTEN AND ANDRE VANDIERENDONCK
University of Ghent, Ghent, Belgium This paper describes software that calculates 11 measures ofsensitivity and 13 measures ofresponse bias. The functions defined in the program can be stored as independent routines in a program library and can thus be calledfrom other programs. The main program tests parameter limitations, and the calculations remain accurate below chance level. These measures are derivedfrom Gaussian, logistic, and rectangular distributions. The bias measures are based on criterion location, criterion location relative to sensitivity, or likelihood ratio. The user is ableto choosebetween different modes ofoutput and two alternative ways to deal with extreme proportions. A brief description of the use and tenability of each of the measures is included. Signal detection theory (SDT), originally proposed by Tanner and Swets (1954), has an important advantage over class~cal psychophysical theories. It allows for the segregation of a pure measure of sensitivity and a measure reflecting effects of cognitive factors-the response bias. Over the years, several variants have been proposed and used. Some indexes were originally thought to be nonparametric-for example, A', B~, and B". It is clear now, however, that all measures of bias and sensitivity make distributional assumptions, and that none of them is nonparametric in the sense ofbeing without distributional assumptions. Arguments for this position can be found in Swets (1986a, 1986b) and Macmillan and Creelman (1990, 1991, 1996). Swets (1986b) has evaluated several indexes of sensitivity,and Macmillan and Creelman (1990) did the same for the measures of response bias. Swets (1986b) proposed one single standard by which a sensitivity statistic can be evaluated: the form of the empirical receiver operating curve (ROC). By this standard, he proposed the index A z ' which is the proportion of the area of the ROC graph that lies beneath an ROC (on ordinary scales) that is assumed to be a straight line on a binormal graph. In order to be able to calculate A_, one has to obtain a sufficient number of data points to define an
This research was supported by Grant 33008793 of the Fund for Medical Scientific Research (Belgium) to A. Vandierendonck. The authors are indebted to Neil Macmillan, Michael J. Hautus, and two anonymous reviewers for their valuable comments on an earlier version of this paper. The authors are also indebted to Hans Vandierendonck for his invaluable help in translating the C programs in Pascal. Correspondence should be addressed to A. Vandierendonck, Department of Experimental Psychology, University of Ghent, Henri Dunantlaan 2, B-9000 Ghent, Belgium (e-mail:
[email protected]).
ROC. A computer program developed by Dorfman and Alf (1969) and revised by Dorfman (cited in Swets & Picket, 1982) is already available for the calculation of ~his index. This program requires a minimum on points m ROC space (four answer categories). However, to calculate Az ' only 2 points in ROC space are required. Therefore, we incorporated functions that calculate A_ and related measures (da , d;, 11m, and the slope of the ROC curve) for exactly three categories. Swets (1986b) argued that when insufficient data points are available, some of the measures based on Gaussian and logistic distributions are the best choice. This manuscript describes software for the calculation of these "simple" measures, which may be of use when the necessary conditions for the calculation of A z are impossible to obtain. Macmillan and Creelman (1990) have studied the characteristics of bias measures that assume Gaussian distributions (SDT), logistic distributions (choice theory), and rectangular distributions (single and double high-threshold theory). Six criteria were used to evaluate the measures: Indexes were judged superior if (1) their isobias curves were monotonic, (2) they measured bias sensibly at and below chance, (3) their range was independent of sensitivity, (4) they were not distorted by averaging across observers, (5) they lent themselves to statistical analysis, and (6) they were of theoretical importance. By these standards, indexes of criterion location were judged to be the best response bias statistics. Some programs are available for calculating some measures of sensitivity and bias. For example, Boice and Gardner (1988) described a Turbo Pascal program that calculates five measures, and Macmillan and Creelman (1991) mentioned other programs that calculate a number of measures. We developed a program that calculates 24 of the indexes ofsensitivity and bias that were evaluated by Swets (1986b) and by Macmillan and Creelman (1990). Table I lists the measures, their assumed distributions and the names ofthe routines that generate the indexes. These routines can be stored in a program library and thus can be called from other programs. The user can choose between two methods to deal with the problem of infinite scores (hit and false-alarm proportions of 0 or 1) in the calculation ofthe measures. Macmillan and Kaplan (1985), among others, suggested replacing a proportion of 0 by 1/(2N) and a proportion of 1 by 1-l/(2N), where N is the number ofnoise or noise + signal presentations. The second method, proposed by ~nodgrass and Corwin (1988) and frequently used in logImear analysis, requires the addition of 0.5 to each cell in a 2 X 2 contingency table that defines the performance ofthe observer. Rowand column totals are increased by 1. In this method, the contingency table is always transformed, irrespective of whether extreme proportions are present. Hautus (1995) has recently studied both methods by means of Monte Carlo simulations. He found that
461
Copyright 1997 Psychonomic Society, Inc.
462
VAN DER GOT EN AND VANDIERENDONCK
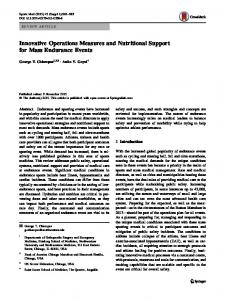
Table I Indexes of Sensitivity and Bias Calculated by the Routines, With Their Assumed Distributions and the Names ofthe Routines Distribution Gaussian
Measure"
d' c
c' f3(G)
log(f3(G)) Logistic
a
b log(a) log(b) b' f3(L) 10g(f3(L))
B'H B" Rectangular
q P(c)
"Nonparametric" Others proposed by Swets (I 986b ) Empirical ROC
k k' A' LOR Yule's Q slope !J.m
da d'e
Routine
sens g loc~
relloc g like~
loglike jg sens_alfa 10c_1 sens_l
loglocI relloc_1 like I loglike j hodosl grier sens_q sens_pc loc_k relloc_kp sens_np sens_lor
sensyule roc_slope delta_m
rocjda
roc_de roc_az A= "The reader is referred to Macmillan and Creelman (1990,1991,1996) and to Swets (I986a, 1986b) for additional information about the measures.
the log-linear rule results in less biased estimates of d' and always underestimates population d', The l/(2N) rule, apart from being more biased, either over- or underestimates population d', The main program requires a total of six or eight arguments, depending on the flags set. The first argument selects the desired calculation: G for the calculation of measures based on Gaussian assumptions; L for measures based on logistic assumptions; R for measures based on rectangular distributions; 0 for the measures suggested by Swets (1986b) and one "nonparametric" index of sensitivity. A prints all preceding measures. Finally, ROC selects the empirical ROC estimates. The second argument sets a flag to determine the way the program handles extreme proportions: 2N uses the 1/(2N) rule if an extreme case is present, and LL uses the log-linear rule for every proportion. When the first flag selects measures based on a single point in ROC space (G, L, R, 0, or A), in addition to the second flag, four arguments are required: the number of signal presentations, the number of noise presentations, the number of hits, and the number of false alarms. In case ROC is the first flag, the last four arguments are repeated for the second data point in ROC space. The output in the latter case consists ofthe slope ofthe ROC curve, 11m, da , d;, and A z . These measures are preceded by a header describing the input and whether there has been a correction for extreme proportions.
When the A flag is chosen, the output consists of the 8 measures of sensitivity and the 13 indexes of response bias for a single point in ROC space. These measures are printed with a header describing the input, the assumed distribution, and whether there has been a correction for extreme proportions. Bias measures based on relative criterion or likelihood ratio are undefined when the hit ratio equals the false-alarm ratio. The main program mentions this when appropriate. When accurately stored in a library, the 26 routines return the value of the sensitivity or bias estimate. The routines for a single point in ROC space are called with five arguments: the number of signal presentations, the number of noise presentations, the number of hits, the number offalse alarms, and the flag for the correction for extreme proportions (= 0 for the 2N rule, 1= 0 otherwise). The measures based on empirical ROC also require the number of signal presentations, the number of noise presentations, the number of hits, and the number of false alarms for the second point. When the measure is undefined (supra), the function returns an arbitrarily large value, HUGE, defined in math.h for C; the Pascal program uses the same value. Every subroutine that calculates a measure calls the function ratio. This function checks for invalid parameters and corrects for extreme proportions according to the flag set. The correction for extreme proportions, when called for (log linear) or when necessary [for l/(2N)], is carried out for every measure. This way, the programs will always be computationally correct, and it is up to the researcher to judge whether the results are scientifically meaningful. The routine approximating the inverse of the normal distribution function is the one proposed by Odeh and Evans (1974); for a discussion, see Brophy (1985).
Description and Tenability Measures based on empirical ROC. There is little doubt that the most appropriate measures for estimating sensitivity and bias are the measures based on ROC, assuming that the necessary conditions to calculate those measures can be met. Swets (1986b) and Swets and Picket (1982) concluded that the slopes of empirical ROCs varied between 0.5 and 2.0 and that the slope is not predictable from sensitivity. In combination with the fact that sensitivity estimates may be misleading if ROC slopes are not equal to I, this finding leads to the recommendation that ROCs should be collected whenever possible. When a single measure is desired to characterize an ROC, da is a good one, especially in forced-choice designs (see Macmillan & Creelman, 1991). Sometimes a measure expressed as a proportion instead of one expressed as a distance is preferred; A z is appropriate in those circumstances. Another commonly used distance measure is d;, based on the arithmetic average of the standard deviations. Measures of sensitivity for a single point in ROC space. Although d' and a have different roots, they are very similar as measures of sensitivity. Both are good measures of sensitivity (see, e.g., Macmillan & Creelman, 1991). The corrected hit probability q is based on single
SENSITIVITY AND RESPONSE BIAS high-threshold theory. Threshold models produce nonregular ROCs and are inconsistent with the available data, which show regular ROCs across a wide range of discrimination tasks. With proportion correct p(e), the user assumes that the hit rate and the correct rejection rate are equal. This measure is based on double highthreshold theory and should never be used when better measures are available. One use for this p(e), however, is in adaptive estimation procedures, as described in Macmillan and Creelman (1991). Swets (1986b) pointed out in a review of the literature that Yule's Q and LOR (log odds ratio) have been shown to be transformations of a. After ROC analysis, the author concluded that d', a, Yule's Q, and LOR would lead to the same conclusions under most conditions. Macmillan & Creelman (1996) have shown that A' depends on two different measures of sensitivity: a and p(e). At low levels of sensitivity, a dominates, whereas at higher levels p( e) prevails. In other words, A' is consistent with logistic distributions at low sensitivities and with rectangular distributions at higher levels. Therefore, A ' can hardly be said to be distribution free, as has been assumed by numerous authors. Measures of response bias for a single point in ROC space. The bias measures based on Gaussian and logistic distributions, like the sensitivity measures, are virtually equivalent. In this short evaluation, we highlight the SDT measures. We can divide measures of response bias into three categories: those based on criterion location (e), criterion location relative to sensitivity (e'), or likelihood ratio (f3(G»)' When sensitivity is constant, any of the three measures will do. As noted, a bias measure should minimally have an isobias curve that is supported empirically and that satisfies the monotonicity condition. The measure should also be independent of sensitivity. According to the two latter standards, criterion location e is the best one. Moreover, likelihood ratio and relative criterion are undefined when sensitivity equals zero, and their below-chance performance is nonoptimal. Two additional advantages of criterion location are that it is statistically independent of the sensitivity and that its range does not depend on the range of the sensitivity. From this enumeration it follows that for SDT, e is better than c' and f3(G)' and that for choice theory, b is better than b' and f3(L)' B" and B~ are monotonic transformations of the logistic likelihood ratio f3(L) and are therefore equivalent. B~ was computed by means of the formula proposed by Hodos (1970) and extended by Singh and Karney (1987). B" was calculated on the basis of a formula proposed by Aaronson and Watts (1987). Two other measures that have been thought to be distribution free, the yes-rate k and the error ratio k', are actually consistent with double high-threshold theory. Macmillan and Creelman (1990) reported that both measures satisfy the monotonicity condition and that they behave well when sensitivity is at chance. Moreover, k is independent of its associated sensitivity measure pee) and behaves well below chance. The error ratio k' behaves
463
less well. According to Macmillan and Creelman (1991), however, there is one good reason to prefer SDT's e: When both the sensitivity and the bias are reported, they should derive from the same model, and it has already been shown that d' is superior to p(e). Availability The source code (in C or Pascal) of the main program and/or the 26 routines can be obtained by sending an e-mail message to one ofthe authors (koen.vandergoten@ rug.ac.be or
[email protected]). Compiled versions for DOS and Solaris 2 are also available by public ftp (ftp.rug.ac.be/, directory pub/exppsy). REFERENCES AARONSON, D., & WATTS, B. (1987). Extensions of Grier's computational formulas for A' and B" to below-chance performance. Psychological Bulletin, 102,439-442. BOICE, R.. & GARDNER, R. M. (1988). A computer program to generate parametric and nonparametric signal-detection parameters. Bulletin ofthe Psychonomic Society, 26, 365-367. BROPHY, A. L. (1985). Approximation of the inverse normal distribution function. Behavior Research Methods, Instruments, & Comput-
ers,17,415-417. DORFMAN, D. D., & ALF, E., JR. (1969). Maximum likelihood estimation of parameters of signal detection theory and determination of confidence intervals rating-method data. Journal of Mathematical Psychology, 6, 487-496. HAUTUS, M. J. (1995). Corrections for extreme proportions and their biasing effects on estimated values of d', Behavior Research Methods, Instruments, & Computers, 27, 46-51. HODOS, W. (1970). Nonparametric index of response bias for use in detection and recognition experiments. Psychological Bulletin, 74, 351-354. MACMILLAN, N. A., & CREELMAN, C. D. (1990). Response bias: Characteristics of detection-theory, threshold-theory, and "nonparametric" indexes. Psychological Bulletin, 107,401-413. MACMILLAN, N. A., & CREELMAN, C. D. (1991). Detection theory: A user's guide. Cambridge: Cambridge University Press. MACMILLAN, N. A., & CREELMAN, C. D. (1996). Triangles in ROC space: History and theory of "nonparametric" measures of sensitivity and response bias. Psychonomic Bulletin & Review, 3, 164-170. MACMILLAN, N. A., & KAPLAN, H. L. (1985). Detection theory analysis of group data: Estimating sensitivity from average hit and falsealarm rates. Psychological Bulletin, 98, 185-199. ODEH, R. E., & EVANS, J. O. (1974). Algorithm AS 70: The percentage points of the normal distribution. Applied Statistics, 23, 96-97. SINGH, N. S., & KARNEY, D. F. (1987). A simple algorithm to obtain nonparametric response bias estimates using Hodos's method. Behavior Research Methods, Instruments, & Computers, 19, 460-461. SNODGRASS, J. G., & CORWIN, J. (1988). Pragmatics of measuring recognition memory: Applications to dementia and amnesia. Journal ofExperimental Psychology: General, 117, 34-50. SWETS, J. A. (1986a). Form of empirical ROCs in discrimination and diagnostic tasks: Implications for theory and measurement of performance. Psychological Bulletin, 99, 181-198. SWETS, J. A. (1986b). Indices of discrimination or diagnostic accuracy: Their ROCs and implied models. Psychological Bulletin, 99, 100-117. SWETS,1.A., & PiCKET, R. M. (1982). Evaluation ofdiagnostic systems: Methods from signal detection theory. New York: Academic Press. TANNER, W. P., JR., & SWETS, J. A. (1954). A decision-making theory of visual detection. Psychological Review, 61, 401-409. (Manuscript received September 9, 1994; revision accepted for publication July 31. 1996.)