Software & Web Process Improvement - Predicting SPI Success for Small and Medium Companies Muhammad Sulayman, Emilia Mendes Department of Computer Science, The University of Auckland, New Zealand
[email protected],
[email protected]
- Appendix -
Dyba’s Questionnaire [12] Business Orientation We have established unambiguous goals for the organization’s SPI activities. There is a broad understanding of SPI goals and policy within our organization. Our SPI activities are closely integrated with software development activities. Our SPI goals are closely aligned with the organization’s business goals. We have a fine balance between short-term and long-term SPI goals. Leadership Involvement 6 Management is actively supporting SPI activities. 7 Management accepts responsibility for SPI. 8 Management considers SPI as a way to increase competitive advantage. 9 Management is actively participating in SPI activities. 10 SPI issues are often discussed in top management meetings. Employee Participation 11 Software developers are involved to a great extent in decisions about the implementation of their own work. 12 Software developers are actively contributing with SPI proposals. 13 Software developers are actively involved in creating routines and procedures for software development. 14 We have an ongoing dialogue and discussion about software development. 15 Software developers have responsibility related to the organization’s SPI activities. 16 Software developers are actively involved in setting goals for our SPI activities. 17 We have an ongoing dialogue and discussion about SPI. Concern for Measurement 18 We consider it important to measure organizational performance. 19 We regularly collect quality data (e.g. defects, timeliness) from our projects. 20 Information on quality data is readily available to software developers. 21 Information on quality data is readily available to management. 22 We use quality data as a basis for SPI. 23 Our software projects get regular feedback on their performance. Exploitation of Existing Knowledge 24 We exploit the existing organizational knowledge to the utmost extent. 25 We are systematically learning from the experience of prior projects. 26 Our routines for software development are based on experience from prior projects. 27 We collect and classify experience from prior projects. 28 We put great emphasis on internal transfer of positive and negative experience. 29 To the extent we can avoid it, we do not take risks by experimenting with new ways of working. Exploration of New Knowledge 30 We are very capable at managing uncertainty in the organization’s environment. 31 In our organization, we encourage innovation and creativity. 32 We often carry out trials with new software engineering methods and tools. 33 We often conduct experiments with new ways of working with software development. 34 We have the ability to question “established” truths. 35 We are very flexible in the way we carry out our work. 36 We do not specify work processes more than what are absolutely necessary. 37 We make the most of the diversity in the developer’s skills and interests to manage the variety and complexity of the organization’s environment. Organizational Performance Overall SPI Success 1 Our SPI work has substantially increased our software engineering competence. 2 Our SPI work has substantially improved our overall performance. Perceived Level of SPI Success 3 Over the past three years, we have greatly reduced the cost of web software development. 4 Over the past three years, we have greatly reduced the cycle time of web software development. 5 Over the past three years, we have greatly increased our customers’ satisfaction. 1 2 3 4 5
1 2
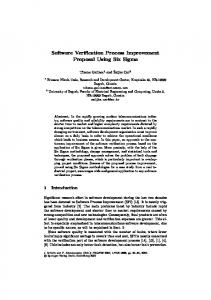
Environmental Conditions Stable (1=Highly Stable to 7=Highly Unstable) Predictable (1=Highly Predictable to 7=Highly Unpredictable)
Respondents and Companies’ Characteristics Respondents Characteristics Total Number of Respondents Work Experience Average Number of Years in Average Number of Years in Company Development Highest Education Achieved Bachelors Degree Masters Degree Job title Project manager Quality Assurance Professional Software Process Improvement Software/Web Developer Professional Companies Characteristics Total Number of Companies Age Less than 5 Years Between 5 and 10 Years Between 10 and 15 Years 15 Years and Above Project Duration Number of Weeks Number of Developers Less than 20 More than 20 and Less Than 100 Category of Applications Standard applications i.e., Web TailorSoftware made solutions for external Product customers – Web and Non-Web Tailor made solutions for internal company customers i.e., In-house Development - both Web and Non-Web
Web 41 Mean 2.50 3.79 Freque ncy23 18 Freque ncy14 12 1 14 Web 12 Freque ncy3 7 2 0 Mean 18.98 Freque ncy8 4 Freque ncy11 9 8
Std. 2.04 Deviation 2.89 Percentage 56.1 43.9 Percentage 34.1 29.3 2.4 34.1 Percentage 25 58.3 16.6 0 Std. 17.74 Deviation Percentage 66.6 33.3 Percentage 91.6 75 66.6
Web & Software 31 Mean Std. 3.01 2.01 Deviation 3.26 1.79 Frequency Percentage 11 35.5 20 64.5 Frequency Percentage 9 29.0 10 32.3 4 12.9 8 74.2 Web & Software 8 Frequency Percentage 1 12.5 2 25 2 25 1 12.5 26.37
18.75
4 4 Frequency 7 5
50 50 Percentage 87.5 62.5
4
50
Coefficient Alpha (α) for Each Independent Variable Variables Business Orient. Leadership Inv. Employee Part. Measurement Exploitation Exploration
Items 1-5 6-10 11-17 18-23 24-29 30-37
Total Items 5 5 7 6 6 8
α (Web) 0.73 0.87 0.71 0.87 0.73 0.79
α (Web & Software) 0.73 0.84 0.81 0.89 0.83 0.80
Eigenvalues, Scree Plots and Item Loading Ranges Web Development companies Independent Variables Business Orientation Leadership Involvement Employee Participation Measurement Exploitation Exploration
EigenValue
Web & Software Development Companies EigenValue Item # of Items, Loading Loadings Range >= 0.6 2.57 0.63 to 0.85 5 (Out of 5)
2.59
Item Loading Range 0.62 to 0.83
# of Items, Loadings >= 0.6 5 (Out of 5)
3.60
0.75 to 0.90
5 (Out of 5)
3.38
0.75 to 0.93
5 (Out of 5)
2.26
0.37 to 0.80
5 (Out of 6)
3.03
0.46 to 0.84
4 (Out of 5)
3.14 2.47 3.03
0.50 to 0.87 0.17 to 0.83 0.37 to 0.88
6 (Out of 6) 5 (Out of 5) 6 (Out of 6)
3.93 3.57 3.20
0.70 to 0.94 0.64 to 0.93 0.60 to 0.80
5 (Out of 6) 4 (Out of 6) 4 (Out of 6)
Variables’ Correlated Matrix
Comparison of Small and Medium Web & Software Development Companies SPI success Factors Business Orientation Leadership Involvement Employee Participation Measurement Exploitation Exploration Overall SPI Success
Small (n=13) Mean St. Dev 17.24 3.19 15.65 4.16 20.47 3.42 21.88 5.44 19.17 3.24 22.65 3.94 7.22 1.27
Medium (n=28) Mean St. Dev 16.36 3.54 18.14 4.44 19.64 4.70 19.64 4.52 17.50 4.27 22.65 3.97 6.75 0.76
t-value 0.73 -1.61 0.57 1.29 1.24 0.003 1.20
Significance (95%) 0.47 0.12 0.58 0.21 0.22 0.99 0.24
Comparison of Small and Medium Web Development Companies SPI success Factors Business Orientation Leadership Involvement Employee Participation Measurement Exploitation Exploration Overall SPI Success
Small (n=13) Mean St. Dev 18.30 1.84 19.46 3.33 16.08 2.78 23.92 4.15 19.46 3.64 22.15 3.02 7.41 0.97
Medium (n=28) Mean St. Dev 16.82 3.41 17.46 4.40 17.71 2.81 21.71 3.65 18.57 2.20 20.71 4.50 7.26 0.78
t-value 1.47 1.45 -1.74 1.72 1.82 0.97 0.48
Significance (95%) 0.15 0.15 0.09 0.09 0.07 0.34 0.63