SOIL ATTRIBUTES UNDER AND FOREST VEGETATION SoilAGROECOSYSTEMS attributes under agroecosystems... 649 IN THE COASTAL TABLELANDS OF NORTHESTERN BRAZIL Atributos de solo de agroecossistemas e coberturas florestais dos tabuleiros costeiros do nordeste do Brasil João Bosco Vasconcellos Gomes1, Marcelo Ferreira Fernandes2, Antonio Carlos Barreto2, José Coelho de Araújo Filho3, Nilton Curi4 ABSTRACT This study evaluated the changes occurred in a set of soil attributes, particularly those related to the dynamics of soil organic carbon (SOC), as a function of the replacement of native forest for agricultural ecosystems of regional importance in the coastal tablelands of Northeastern Brazil (orange, coconut, eucalyptus and sugarcane). Six commercial sites under these agroecosystems were compared to neighboring areas of native forest in five areas along this region (Coruripe, Umbaúba, Acajutiba, Cruz das Almas and Nova Viçosa). Soil samples were taken from 0-5 and 5-20 cm depth and analyzed for particle size distribution, bulk density, organic C (OC), particulate organic matter, C in soil solution, microbial biomass C, total cation exchange capacity and water stable aggregates. Linear correlation and multivariate techniques were used for data analysis. The values of base saturation and Al saturation for the 0-20 cm depth layer were also calculated. In all the studied areas, soils under native forest presented better status of physical and chemical attributes than their agroecosystem counterparts, especially in the 0-5 cm layer. For both layers, OC content was the attribute most strongly correlated with the overall changes in all attributes. Unexpectedly, the OC content showed no significant correlation with the sum of silt and clay contents. The set of variables investigated in this study is sensitive to differentiate the quality of soils under perennial and semi-perennial land uses from their counterparts under natural vegetation in the landscapes of the coastal tablelands of Northeastern Brazil. Index terms: Cohesive soils, organic C, coastal tablelands, kaolinitic soils. RESUMO Este trabalho avaliou as alterações de um conjunto de atributos de solos dos tabuleiros costeiros do Nordeste do Brasil, em especial os relacionados à dinâmica do C orgânico (CO), em função da substituição da vegetação florestal nativa por agroecossistemas de importância regional (laranja, coco, eucalipto e cana-de-açúcar). Seis sítios comerciais sob esses agroecossistemas foram comparados a áreas vizinhas de mata nativa, em cinco locais de amostragem ao longo dos tabuleiros costeiros (Coruripe, Umbaúba, Acajutiba, Cruz das Almas e Nova Viçosa) Foram coletadas amostras de solo de 0-5 e de 5-20 cm de profundidade para determinar granulometria, densidade do solo, C orgânico (CO), matéria orgânica particulada, C da solução do solo, C da biomassa microbiana, capacidade de troca catiônica e agregados estáveis em água. Para análise dos dados foram realizadas correlações lineares e análises multivariadas. Os valores de saturação por bases e por Al da camada de 0-20 cm também foram calculados. Em todos os locais, a vegetação com floresta nativa apresentou maior qualidade de atributos químicos e físicos do solo do que os respectivos sistemas agrícolas, principalmente na camada de 0-5 cm. Para as duas camadas, o atributo que explicou a maior parte da variação dos dados, em função do conjunto de atributos estudados, foi o CO. Este, inesperadamente, não apresentou correlação significativa com a soma dos teores de silte e argila. O conjunto das variáveis analisadas é sensível para diferenciar a qualidade dos solos sob uso com espécies perenes e semiperenes do solo de seus correlatos sob vegetação natural nas paisagens de solos dos tabuleiros costeiros do Nordeste do Brasil. Termos para indexação: Caráter coeso, C orgânico, tabuleiros costeiros, solos cauliníticos.
(Received in august 24, 2012 and approved in october 5, 2012) INTRODUCTION Coastal tablelands are plateaus of sedimentary origin from the Tertiary period, referred to as the Barreiras Group, that present a degree of scoring and variable climate and which accompany the Brazilian coast between the states of Rio de Janeiro and Maranhão. The lan dscapes of the coasta l tablelands occupy
approximately 111,000 km2 of the Brazilian states (SILVA et al., 1993; JACOMINE, 2001), being strategic for their proximity to large urban centers and for sustaining, in the range under domain of phytoecological forest units, industrial scale agricultural uses (sugarcane and reforestation with eucalyptus), pastures of quite varied quality and areas with irrigated and rainfed fruit
1
Empresa Brasileira de Pesquisa Agropecuária/Embrapa – Embrapa Florestas – Colombo – PR – Brasil Empresa Brasileira de Pesquisa Agropecuária/Embrapa – Embrapa Tabuleiros Costeiros – Aracaju – SE – Brasil 3 Empresa Brasileira de Pesquisa Agropecuária/Embrapa – Embrapa Solos – Recife – PE – Brasil 4 Universidade Federal de Lavras/UFLA – Departamento de Ciência do Solo/DCS – Cx.P. 3037 – 37200-000 – Lavras – MG – Brasil –
[email protected] 2
Ciênc. agrotec., Lavras, v. 36, n. 6, p. 649-664, nov./dez., 2012
650
GOMES, J. B. V. et al.
production (EMPRESA BRASILEIRA DE PESQUISA AGROPECUÁRIA-EMBRAPA, 2005; LANI, 2008). The predominance of soil uses with perennial and semi-perennial species is consistent with fragilities associated to the characteristics of the local soils, mainly when they avoid the constant soil tillage (GOMES et al., 2008). A part of that fragility can be explained by the kaolinitic mineralogy of the clay fraction, which translates into a low level of macrostructure (FERREIRA; FERNANDES; CURI, 1999; JUO; FRANZLUEBBERS, 2003; RESENDE et al., 2011). Kaolinitic soils occur on savannah landscapes (GOMES et al., 2004), but these associate coarse texture (medium sandy) with relatively higher Fe oxide content, or present relatively lower kaolinite/gibbsite ratios than the soils of the Brazilian coastal tablelands (DUARTE et al., 2000). This kaolinitic mineralogy should also be considered in the common presence of cohesive layers in the subsurface of the coastal tableland soils. The formation of those layers (cohesive horizons) occurs in a natural way and can be associated to several processes, such as: blockage of the pores with illuvial clay; presence of organic compounds little polymerized; presence and accumulation of secondary silica, Fe oxides and clay dispersed in the micropores; and densification by desiccation resulting from the alteration of the soil structure by the alternation of soil wetting and drying cycles (CORRÊA et al., 2008; GIAROLA et al., 2009; LIMA NETO et al., 2009). The cohesion is more intense in the driest periods (CINTRA et al., 2009) and in the more clayey soils. The combination of cohesive layers in subsurface, predominance of weak degree soil macro-structure and high laminate erosion rates provokes fast degradation of the superficial horizon when it is submitted to the constant tilling (annual), even in the presence of flat and gentle rolling reliefs (RESENDE et al., 2011). Chaer et al. (2009), working with soils of coastal tablelands of Sergipe found fast deterioration of various attributes of surface soil (organic matter, soil density, saturated hydraulic conductivity, cation exchange capacity, water stable aggregates etc.) in response to the increase of the number of soil preparation operations. Considering the fragilities described for the soils of coastal tablelands, the evaluation of various soil attributes the among areas under different agroecosystems (mainly perennial and the semi-perennial crops) and their respective natural systems make up an important strategy to diagnose the impact of these agricultural activities on the soil quality in the area. The types of attributes involved in those studies are varied, with a strong current tendency Ciênc. agrotec., Lavras, v. 36, n. 6, p. 649-664, nov./dez., 2012
for the integration of physical, chemical and biological attributes (CHAPMAN; CAMPBELL; PURI, 2003; ZORNOZA et al., 2007; CHAER et al., 2009), it being common to emphasize organic C (OC) and attributes that qualify or compartmentalize it as indicators in the concept of the quality of a soil (SHUKLA et al., 2006). In these studies, those variables that are useindependent should also be contextualized. Although very homogeneous in mineralogical terms (kaolinitic), the soils of coastal tablelands can present variations in the landscape dissection degree and position, in the local rains distribution and in the soil texture. The soil texture variations of the tablelands are erratic and very pronounced (ZANGRANDE; REZENDE, 1989). To reduce the effect of these factors, little to not alterable by the land use, on the interpretation of the impacts of the different agroecosystems on the soil quality, we can pair sites evaluated under agricultural use with sites under natural vegetation (primary or secondary forests), with the latter representing a local reference condition. The decrease of the coastal tableland soil quality after the substitution of the forest by agricultural use, considering quantifications of its superficial and subsuperficial horizons, has been reported in specific studies, with obvious effects on the organic matter pools and associated variables (cation exchange capacity, water stable aggregates and average aggregate diameter) (SILVA et al., 2006a; SILVA et al., 2006b; COSTA et al., 2009; SANT’ANNA et al., 2009; FERNANDES et al., 2011; PACHECO; CANTALICE, 2011), however there is a lack of studies including a wider geographical sampling. As such, the objective of this work was to evaluate the alterations of a group of chemical, physical and microbiological attributes, with emphasis for those related to OC dynamics, of the 0-5 and 5-20 cm superficial soil layers of the Northeastern Brazilian coastal tablelands derived from the substitution of the natural forest vegetation by agroecosystems of regional importance (sugarcane, eucalyptus, orange tree and coconut tree). MATERIAL AND METHODS Study areas and soil description Five areas of coastal tablelands were selected for the study (Figure 1). The study areas are in the states of Bahia (BA), Sergipe (SE) and Alagoas (AL), where the coastal tablelands comprise approximately 52,911 km2. The areas Nova Viçosa-BA (V) and Cruz das Almas-BA (R) present tropical climate with all of the months rainy (the driest month with more than 60 mm of rain). The areas Coruripe-AL (C),
Soil attributes under agroecosystems... Umbaúba-SE (U) and Acajutiba-BA (A) are under a rainy tropical climate with dry summer (SILVA et al., 1993). Table 1 presents the 12 area and land use combinations (groups), between agroecosystems and forests (primary or secondary with variable degrees of alteration). All of the sampling points (sites) of each group represent situations of wide summit to a very gentle slope of coastal tablelands, in flat relief. All of the soils present cohesive character, whose degree and expression depth vary in function of the clay content, the local climate and the A and B horizon transition depths. Sampling and analysis The soil samples were collected in the 0-5 and 520 cm deep layers, in the 12 groups defined in table 1. Each group was sampled in five sites (repetitions), totaling 60 sites for the soil attribute evaluations. For the agroecosystems the samples were collected between plants in the planting rows. Considering the two appraised layers, samples were collected regarding 120 points. Four groups of samples were obtained: disturbed, for particle size distribution, OC and cation exchange capacity (CEC); with aggregate preservation, for water stable aggregates (WSA); cooled, for microbial biomass C
(A)
651
(MBC), particulate organic matter (POM) and the soil solution; and of known volume, for bulk density (BD). The disturbed samples were seived in a 2 mm mesh and airdried. The samples for WSA were sieved in a 4 mm mesh. The samples of known volume were taken in the central part of the range of each layer. The particle size distribution, OC, CEC, BD and WSA analyses were determined according to Embrapa (1997). WSA was expressed by the ratio between the mass of dry aggregates retained in a 0.25 mm sieve after the wet sieving operation in a Yoder apparatus and the total mass of dry soil used in the analysis. CEC was calculated from the sum of the determinations of the exchangeable bases (Ca, Mg, K and Na) and potential acidity (H+Al) (data not shown). Base (V) and Al (m) saturation values of the exchange complex were calculated for the weighted average of the two layers sampled. POM was estimated from the C content in the sand fraction (AMELUNG; ZECH; FLACH, 1998). The MBC determination was conducted by the fumigation-extraction method (VANCE et al., 1987), C in fumigated and non-fumigated soil extracts being determined by the colorimeter method of Bartlett and Ross (1988). Soil:water extracts at a 1:0.5 proportion extracted according to Gomes et al. (2010), simulated the soil solution, where the dissolved organic C (DOC) was determined.
(B)
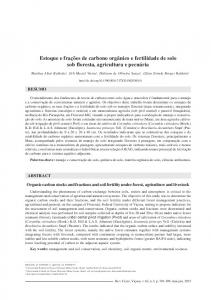
Figure 1 – (A) Map of Brazil showing the states of Alagoas (AL), Sergipe (SE) and Bahia (BA). (B) Map of the states of Alagoas, Sergipe and Bahia, showing the approximate location of the five areas of study: C – Coruripe; U - Umbaúba; A - Acajutiba; R - Cruz das Almas, and V - Nova Viçosa. Average UTM coordinates of each area (24 zone): C – 801.597 m E, 8.892.854 m N; U - 644.286 m E, 8.741.644 m N; A - 608.112 m E, 8.706.689 m N; R - 489.961 m E, 8.598.978 m N; and V - 401.947 m E, 8.032.788 m N. Ciênc. agrotec., Lavras, v. 36, n. 6, p. 649-664, nov./dez., 2012
652
GOMES, J. B. V. et al.
Table 1 – Location and soil characteristics of study areas in agroecosystems and natural forests. Groups
Location
Land use
Soil classification1
CF
Coruripe, AL
Primary forest with a good conservation degree, as narrow strips between sugarcane areas
PAdx fragipânico
C1
Coruripe, AL
Sugarcane, subsoiling, irrigation, 2nd cut after planting, 35 years cropping
C2
Coruripe, AL
Sugarcane, subsoiling, crotalaria, irrigation, 4nd cut after planting, 40 years cropping
UF
Umbaúba, SE
UO
Umbaúba, SE
Secondary forest with low conservation and regeneration level Orange, 14 years after planting, intermediate technological level, various cultural treatments (with and without subsoiling, green manure between the lines and harrowing) Secondary forest with intermediate conservation and regeneration level
AF AE AC RF RO VF VE
Acajutiba, BA Acajutiba, BA Acajutiba, BA Cruz das Almas, BA Cruz das Almas, BA Nova Viçosa, BA Nova Viçosa, BA
Eucalyptus 3 years after planting Coconut, 25 years after planting, intermediate technological level Primary forest with low conservation and regeneration level, neighbor to an urban area Orange, 5 to 25 years after ploanting (citrus plots for over 40 years), intermediate to high technological level Secondary forest, with intermediate to good conservation and regeneration level Eucalypt regrowth 1 year after harvest
PAdx abrúptico fragipânico PAdx abrúptico fragipânico PAex típico
Texture loamy sandy/sandy clay loam/sandy clay loamy sandy/sandy clay loam/sandy clay loamy sandy/sandy clay loam/sandy clay sandy loam/clay loam
PACex fragipânico
sandy loam/clay loam
PAdx latossólico PAex latossólico LAdx argissólico
sandy loam/sandy clay sandy loam/sandy clay sandy loam/sandy clay sandy clay loam/sandy clay sandy clay loam/sandy clay
LAdx típico LAdx típico PAdx abrúptico
sandy loam/clay
PAex típico
sandy loam/clay
1
Order and suborder of the Brazilian system of soil classification - BSSC (Embrapa, 2006): PA - Yellow Argisol, LA - Yellow Latosol. Great group of the BSSC: dx - Distrocoeso, ex – Eutrocoeso.
Statistical analysis Initially, the data of each variable were relativized dividing the values of the respective variable in each sample by the sum of the values obtained for all of the samples. This way, we sought to nullify the effect of different of the response variable expression unit magnitudes on the result of the analyses. The linear correlations among the studied variables were determined. The data were analyzed through multivariate analyses. The analyses were conducted separately for each of the layers. The sites were ordered by the use of non-metric multi-dimensional scaling (NMS), considering seven variables (OC, CEC, BD, WSA, POM, MBC and DOC). Ciênc. agrotec., Lavras, v. 36, n. 6, p. 649-664, nov./dez., 2012
That order allowed the comparison of the different groups (area combination and land use), representing, in the order, the average and the standard deviation regarding the five sites (repetitions) of each group. The sand, silt and clay content were not included at the data matrix used for the ordination analysis by NMS, considering that they are little influenced by land use changes. However, these variables were used to support the interpretation of the variations occurred among the five sampled. NMS was generated by the PC-ORD program version 4 (MCCUNE; MEFFORD, 1999). The analyses were conducted by “autopilot” using the “average” analysis intensity, which includes a maximum number of 200 interactions, instability
Soil attributes under agroecosystems... criterion of 0.0001; initial number of 4 axes, 15 runs with real data and 30 runs with randomized data. The choice of the number of dimensions of the ordination for optimum NMS to represent differences among the soil quality of the investigated sites was based on the criteria of stability and significance (p < 0.05) of the ordination stress according to the Montecarlo test. For each local (area) contrasts between land uses under forest and agroecosystems were conducted, through the multi-response permutation procedure (MRPP) technique (MIELKE; BERRY; JOHNSON, 1976), considering the same seven variables used by NMS.
653
significant difference of all the contrasts between forests of each local and their pairs under the agroecosystems, according to the MRPP technique (Table 4). The second axis represented, mainly, variations associated to the texture among the studied areas, in other words, those variables more influenced by it (WSA and DOC). Sand, silt and clay content were highly correlated to Axis 2 (r = -0.52, 0.38 and 0.41, respectively, p < 0.001 for all of the correlations) and non-correlated to Axis 1. The fact that OC and CEC do not correlate with the silt+clay sum is uncommon for soils with low activity clay (FELLER; BEARE, 1997). That aspect, in a certain way, facilitated the comparison among the soils, considering that the texture is an important environmental variable of the coastal tableland soils (ZANGRANDE; REZENDE, 1989) and since its variation did not influence at least part of the studied attributes, mainly OC and the variables with higher correlation to it. In reality, texture variations among situations of a same place occurred more perceptibly in Umbaúba and in Acajutiba (Table 5 and figure 3). WSA was the only attribute, and only in Umbaúba, to present an site averages under agroecosystems with perceptibly more advantageous values than the sites under forest. In fact, the WSA values are those mainly responsible for UF being the only group under forest to be positioned more to the left of some agroecosystem groups in the NMS technique (Figure 2). The POM and DOC content also contributed to this, but to a lesser degree. In other words, if WSA variations are sensitive to use and management (VASCONCELOS et al., 2010) and they present significant and positive correlation with OC (SILVA et al., 2006b), its extreme dependence on the texture hinders the comparison of data for coastal tableland soils, so varied in texture.
RESULTS AND DISCUSSION Samples from 0-5 cm of depth Of the 28 pairs of variables tested, non-significant correlations were only observed between the sum of the silt and clay content and the variables OC, CEC, BD, MBC and POM (Table 2). The highest correlation value occurred between OC and CEC (r = 0.83). Only BD presented negative correlations with other attributes. Approximately 94% of the variability of the analyzed attributes were represented in the two dimensional ordination obtained by the NMS technique, most of this variability being represented along Axis 1 (88%) and only 6%, for Axis 2 (Figure 2 and table 3). The distribution of the sites along Axis 1 was positively correlated (p < 0.001) with OC, CEC, WSA, MBC, POM and DOC, and negatively correlated with BD. Thus, it can be admitted a better soil quality of the different sites improving from the left to the right direction of Axis 1, in the 0-5 cm layer. In each local, the forest group samples were positioned to the right of the axis. The tendencies observed in NMS were confirmed by the
Table 2 – Correlation coefficient (r values) between the soil attributes for the 0-5 cm layer, considering local and land use combinations (n = 60). Attributes
Silt+Clay
OC
-0.11
CEC
-0.21
0.83**
BD
0.12
-0.74**
-0.54**
WSA
0.42**
0.42**
0.42**
-0.37**
MBC
0.14
0.60**
0.49**
-0.39**
0.43**
POM
-0.26
0.79**
0.79**
-0.62**
0.39**
0.43**
0.56**
0.36**
-0.53**
0.47**
0.50**
DOC
0.33**
OC
CEC
BD
WSA
MBC
POM
0.45**
1
OC = organic C, CEC = cation exchange capacity, BD = bulk density, WSA = water stable aggregates, MBC = microbial biomass C, POM = particulate organic matter, e DOC = dissolved organic C. Correlation values followed by **, significant to 1% (p