REPORT NO. UCD/CGMDR-05/02
CENTER FOR GEOTECHNICAL MODELING
Soil-Foundation-Structure Interaction: Shallow Foundations. Centrifuge Data Report for the SSG04 Test Series.
BY J. M. THOMAS S. GAJAN B. L. KUTTER
DEPARTMENT OF CIVIL & ENVIRONMENTAL ENGINEERING COLLEGE OF ENGINEERING UNIVERSITY OF CALIFORNIA AT DAVIS
SEPTEMBER 2005
Soil-Foundation-Structure Interaction: Shallow Foundations. Centrifuge Data Report for the SSG04 Test Series. J.M Thomas, S. Gajan, and B. L. Kutter Center for Geotechnical Modeling Data Report UCD/CGMDR-03/02 Date:
October 2004
Date of Testing:
May/June 2004
Project:
Soil-Foundation-Structure Interaction: Shallow Foundations.
Contract Number:
NSF Contract Number 2142000 PEER Contract Number 2061999
Sponsor:
Pacific Earthquake Engineering Research Center
Related Reports:
Soil-Foundation-Structure Interaction: Shallow Foundations. Centrifuge Data Reports for the KRR01, KRR02, KRR03, SSG02, SSG03 and SSG04 Test Series.
ACKNOWLEDGMENTS This work was supported primarily by the Earthquake Engineering Research Center’s Program of the National Science Foundation under Award Number EEC – 9701568 and PEER project number 2262001. The contents of this report are not necessarily endorsed by the sponsors. The authors would like to acknowledge the suggestions and assistance of Geoff Martin (USC), Mark Moore (Rutherford and Chekene), Dan Wilson, Tom Kohnke, Lars Pedersen, Penny Walgenbach, Tom Coker, and Chad Justice. Development of the large centrifuge at UC Davis was supported primarily by the National Science Foundation, NASA, and the University of California. Additional support was obtained from the Tyndall Air Force Base, the Naval Civil Engineering Laboratory, and the Los Alamos National Laboratories. The large shaker was funded by the California Department of Transportation, the Obayashi Corporation, the National Science Foundation, and the University of California. CONDITIONS AND LIMITATIONS Permission is granted for the use of these data for publications in the open literature, provided that the authors and sponsors are properly acknowledged. It is essential that the authors be consulted prior to publication to discuss errors or limitations in the data not known at the time of
1
release of this report. In particular, these may be later releases of this report. Questions about this report may be directed by e-mail to
[email protected].
2
TABLE OF CONTENTS ACKNOWLEDGMENTS ............................................................................................................ 1 CONDITIONS AND LIMITATIONS......................................................................................... 1 PURPOSE AND CONFIGURATION OF THE JMT01 TEST SERIES ................................ 4 SOIL PROPERTIES .................................................................................................................... 4 STRUCTURE PROPERTIES ..................................................................................................... 5 SCALE FACTORS ..................................................................................................................... 11 INSTRUMENTS AND MEASUREMENTS ............................................................................ 12 TEST SERIES CHRONOLOGY .............................................................................................. 14 KNOWN LIMITATIONS OF RECORDED DATA AND MODEL ..................................... 14 DESCRIPTION OF DISPLACEMENT COMMAND FOR STATIC PUSH EVENTS...... 15 DESCRIPTION OF DISPLACEMENT-COMMAND FILES FOR MODEL SHAKING . 15 ORGANIZATION OF DATA FILES AND PLOTS ............................................................... 15 REFERENCES: .......................................................................................................................... 22 Tables and Figures APPENDIX A: MathCAD Example Sheets………………………………………………….23 APPENDIX B: SSG04 Test Series Result Plots………………………………………..….…61 APPENDIX C: SSG04 Test Series Time History Plots…………………………………..….81
3
PURPOSE AND CONFIGURATION OF THE JMT01 TEST SERIES JMT01 was the seventh test series in a study to understand the behavior of shallow building foundations under large non-linear loading. Similar to the KRR01, KRR02, KRR03, SSG02, SSG03 and SSG04 test series, this model featured shear wall strip footings. Rigid structures were placed on a dense sand foundation. Procedures unique to JMT01 include: 1: Single walls and footings were used for slow cyclic tests as opposed to double-wall structures used in the KRR series. 2: A total of 12 stations were utilized, all having a sand foundation with a relative density of approximately 80%. 3: Many stations were embedded with embedments ranging from 0.5B to 2.5B. 4: All but one of the horizontal slow cyclic tests used two actuators to apply various load paths. 5: About half of the tests were conducted using a square footing. 6: In the dynamic test LVDT’s were placed to measure free field settlement and free field surface accelerations were measured. JMT01 was built with a 20.0 centimeter soil base made with Nevada Sand having a relative density of roughly 80% throughout the container. The foundation soil contained instrumentation for measuring both vertical and horizontal accelerations for dynamic tests. The 50.8 cm or 55.8 cm tall structures simulated rigid shear walls that transfer lateral loads to the foundation elements. The overall height of the structure varied depending on the degree of embedment that was desired. The structures were instrumented to measure horizontal acceleration, vertical accelerations, vertical displacements, and horizontal displacements during testing. Model testing was performed using the 9-meter-radius geotechnical centrifuge at UC Davis. A total of 85 slow cyclic events and 5 dynamic events were applied to the model. Shaking was applied parallel to the long sides of the rigid model container. Ground motions for dynamic events included various amplitudes of a tapered cosine wave as well as a Santa Cruz ground motion from the Loma Prieta Earthquake. The approximate centrifuge acceleration used in these tests was 20 g at the soil-footing interface (i.e. sand surface). A chronology of the entire test is listed in Table 5. The column headings for this table are described under Organization of Data Files and Plots. SOIL PROPERTIES Some of the material properties of the Nevada sand used in the test program are given in Table 1. Mechanical grain-size analyses of the sand were conducted according to ASTM D422 for a prior test. It should be noted that the samples used in the grain size analyses were dry samples taken from the storage bin at the centrifuge facility during a prior test (DKS02), not from the pluviator during construction or from the model after testing. Average relative density is based on calculated unit weights and on the results from maximum and minimum density measurements performed according to ASTM D4253-83 and D4254-83 by Woodward-Clyde (1997). For this test series the friction angle of the soil was determined to be 43o. The friction angle was back 4
calculated from a vertical push test run during the JMT01 series. This vertical push was slightly different from similar test run in previous series, KRR or SSG. For the JMT01 vertical push test a square footing was used where as only rectangular footings had been used previously. In the spirit of the first six test series, WD40 was added to the surface of the sand for all of the JMT01 events. The oil was discovered to maintain the shape of the foundation imprint as the structure rocked back and forth. As noted by Rosebrook (July 2001), with no oil, the sand grains fell into the gaps created by the foundation uplift at the soil-structure interface. As the building rocked back into its original position, it was forced onto the newly caved-in sand, which was considered to be unrealistic. This sometimes caused a “negative settlement” of the structure. For the JMT01 series, WD40 was used for all tests. The amount of oil used was measured based on its viscosity and lubrication characteristics and sprayed onto the sand surface before placement of each structure. Rosebrook (July 2001) concluded that the effect of WD40 on the strength characteristics of the sand was minimal and that only the cohesion was slightly altered. Table 1: Soil properties of Nevada Sand Soil Supplier Classification Specific Gravity Mean Grain Size, D50 (mm) Coefficient of Uniformity, Cu Maximum Dry Unit Weight2, γd,max (kN/m3) Minimum Dry Unit Weight2, γd,min (kN/m3) Relative Density (average) (%) 2
No. 120 Nevada Sand, UCD Batch #2 delivered approx. November 1996 Gordon Sand Co., Compton, CA Uniform, fine sand; SP 2.67 0.15 1.06 16.8 14.0 80
Woodward – Clyde (1997)
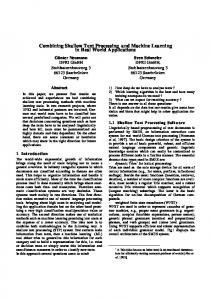
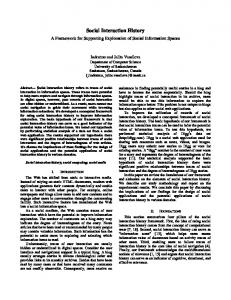
STRUCTURE PROPERTIES See the SSG02 data report (Gajan et al., 2003) for a description of the footing and shear wall properties. The JMT01 model configuration is shown in Figure 1 (along with a visual description of the local coordinate system) and the aluminum and steel structures are shown in Figure 2. For absolute positions, refer to Table 6.
5
N
Top View 1759
Load Frame
STATION I
STATION F
STATION E
STATION C
STATION B
905
STATION J
STATION G
STATION D
x y Load Frame Figure 1a: plan view of soil container and relative location of slow cyclic stations. Dimensions are in model scale millimeters 1759
Load Frame
STATION K AND L
905
STATION A
x y Load Frame Figure 1b: plan view of soil container and relative location of dynamic stations. Dimensions are in model scale millimeters
6
N
Top View 1759
Load Frame A1
Station H A9 A7
905
A8
A3
A6 A4
A5
x
Station I y A2
Load Frame Figure 1c: Instrument configuration in and on rigid container.
1759
Load Frame A1
STATION K AND L
INSTRUMENTS A16-A25
905
A3
STATION A INSTRUMENTS A11-A15
x
y A2
Load Frame
Horizontal Accelerometer Vertical Accelerometer
Figure 1d: Instrument configuration on dynamic stations
7
West Side Section View
LC2 LC1 V2
V1
V2
LC1
L2
LC2
L2
L1
LC1
L1
V2
V1
V1
beams continue for length of box
Nevada Sand
Z
200
STATION D
STATION G
STATION J
y Figure 1e: Side view of model configuration for stations "J", "G" and "D"
L2
LC2 LC1 V2
L1 V1
LC2 LC1 V2
V1
L2
LC2
L1
LC1
L2 L1 V1
V2
Z
Nevada Sand STATION I
200
STATION F
STATION C
y Figure 1f: Side view of model configuration for stations "I", "F" and "C" Vertical Linear Potentiometer Horizontal Linear Potentiometer Load Cell
N 8
West Side Section View
beams continue for length of box
L2
LC2 LC1 V2
Nevada Sand 200
L2
L1 V1
LC1 V2
STATION E
L1 V1
Z
STATION B
y Figure 1g: Side view of model configuration for stations "E" and "B"
A19, A24
A20, A25
A14
A15
A11
A16, A21
L2
V2
L2
A12
A17, A22
L1
L1 V1
V2
A18, A23
V1
A13
Z
Nevada Sand
A3
STATION K AND L
STATION A
200
y
A1, A2
Figure 1h: Side view of model configuration for stations "K and L" and "A" Linear Potentiometer Accelerometer
N
direction of shaking
Load Cell
9
y'
x'
y'
Sand Surface
-z'
Sand Surface
-z'
North-South Side View
x'
East-West Side View
-z'
-z'
North-South Side View
East-West Side View
Vertical Linear Potentiometer Horizontal Linear Potentiometer Horizontal Linear Potentiometer
Figure 2a: Test configuration for lightweight and standard wall with shallow square footing.
Sand Surface
Sand Surface
North-South Side View
East-West Side View
North-South Side View
East-West Side View
Vertical Linear Potentiometer Horizontal Linear Potentiometer Horizontal Linear Potentiometer
Figure 2b: Test configuration for standard wall with deep square footing and heavy wall with shallow rectangular footing. 10
Sand Surface
Sand Surface
North-South Side View
East-West Side View
North-South Side View
Vertical Linear Potentiometer Horizontal Linear Potentiometer Horizontal Linear Potentiometer
Figure 2c: Test configuration for heavy wall with deep rectangular footing and vertical push test with square footing, x'
x'
y'
Sand Surface
-z' East-West Side View of Accelerometers
-z' East-West Side View of Potentiometers
-z' North-South Side View of Potentiometers
Vertical Linear Potentiometer Horizontal Linear Potentiometer Horizontal Linear Potentiometer Horizontal Accelerometer Horizontal Accelerometer
Figure 2d: Test configuration for dynamic tests; heavy wall with deep rectangular footing and standard wall with deep square footing. 11
SCALE FACTORS All data presented in this report and included in the accompanying data files are in prototype units of millimeters and g's for displacement and acceleration, respectively, unless otherwise noted. A uniform scale factor of 20 has been applied because all test events were conducted at approximately the same g-level. Table 2 lists the approximate factors that were used to convert the data to prototype scale. A radial distance to the surface of the sand of 8.65 m was used to calculate centrifugal accelerations within the model. This value was determined by taking the 9.14m radius to the bucket floor, minus the 0.29m distance between the inside base of the container and the bucket floor, minus 0.200m sand thickness.
Scale Factor
Table 2: Scale factors used to convert the data to prototype units: Model Dimension / Prototype Dimension vs. Centrifuge rpm. Centrifuge rpm 45.5 Time (dynamic) 1/20 Displacement, Length 1/20 Acceleration, Gravity 20 Velocity 1 Pressure, Stress 1 INSTRUMENTS AND MEASUREMENTS Two different origins are used to define the x, y, z location of the instruments, and are summarized in Table 6. The axis origin of the “container coordinate system” locating instruments within the soil (i.e. instrument location numbers A4-A15 in Table 6) is located at the inside southwest bottom corner of the container. As shown in the test series configuration drawings (Figure 1), positive “x” is taken as the East direction, positive "y" is taken in the North direction, and positive "z" is taken in the up direction (i.e. the bottom inside of box being zero). By convention, the centrifuge arm is considered to be a compass needle, with the bucket forming the north arrow. Positions of instruments are recorded before testing as well as after testing and are presented in Table 6. Distances of the instruments from the origin are recorded using a measuring tape and a depth gauge. Specifically, the position of each accelerometer is measured to their tip along the centerline of the instrument. The instruments located on the structure are placed with reference to a “structure coordinate system” with an origin at the top middle south side of the structure. As shown in Figure 2, positive “x’” is taken in the East direction, positive “y’” is taken in the North direction, and positive “z’” is taken in the up direction. Specific structure details such as the footing length, width, and area, the z coordinate of the center of gravity, and the mass moment of inertia are listed in Table 3. Note that configurations vary with different stations as the structures components were changed for different tests. For double-wall configurations, the mass moment of inertia and the mass data in Table 3 are the total building moment of inertia and mass divided by two to obtain a mass and a mass moment of inertia per footing. Locations of the accelerometers and linear potentiometers on the structure are listed in Table 6. 12
Table 3: Station specific structure data (model dimensions per footing). L B A M CG (z Icg (kg*cm2) per footing Station (mm) (mm) (mm2) (kg) coordinate) C C F I G J E B D A K
50 142.2 142.2 142.2 50 50 142.2 142.2 50 50 142.2
50 34.3 34.3 34.3 50 50 34.3 34.3 50 50 34.3
2500 4877 4877 4877 2500 2500 4877 4877 2500 2500 4877
3.177 4.801 4.801 8.115 4.90 n/a 8.64 8.64 4.9 4.06 9.67
n/a n/a n/a n/a n/a n/a n/a n/a n/a -242.5 -260.2
n/a n/a n/a n/a n/a n/a n/a n/a n/a 507.9 817.1
F.S. 3.6 5.0 7.7 3.0 2.4 n/a 8.4 12.6 12.1 14.4 8.3
In addition to giving each instrument’s location, Table 6 lists each instrument’s location number, type, engineering units for reported data, location description, direction, range, serial number, calibration factor, and comments. An instrument location number is an alphanumeric identifier assigned to a specific instrument location and corresponds to an instrument label in the model configurations of Figures 1 and 2. The location description is a general description of an instruments location in the model. The direction refers to an instrument's primary orientation; specifically, "V" and "H" refer to vertical and horizontal orientation, respectively. The range of an instrument is simply its maximum rated capacity. Calibration factors were used to convert instrument voltage outputs into engineering model-unit data, and were determined either by manual re-calibration prior to model construction (linear potentiometers and load cell) or by using the manufacturer's instrument sensitivity directly (accelerometers). If an instrument performed unexpectedly, or was adjusted or replaced during the test, a comment is included in Table 6. During JMT01 testing, the following types of data were recorded: accelerations through the Nevada sand, accelerations of the shaker load frames and the rigid container, settlement of the sand layer, linear displacement of the structures during slow cyclic tests, and linear displacement as well as acceleration of the structure during dynamic testing. Each instrument had a consistent, positive-output sign convention corresponding to its orientation in the model. In particular, positive displacement represented the extension of the linear potentiometers. All soil horizontal accelerometers were oriented with their tips to the north, and their outputs will have the same sign whenever the container was accelerated in a given direction. The accelerometers on the outside of the box pointed south. All vertical accelerometers pointed upward in the sand. To compensate for the variation in instrument orientation, a negative (–) sign is included in the calibration factor where appropriate such that positive acceleration is in the positive “container coordinate” direction indicated in Figure 1.
13
TEST SERIES CHRONOLOGY Table 5a outlines the chronology of the JMT01 test series for all events between May 19, 2004 and June 29, 2004. For each event it includes a listing of the “Date”, “Test” name (associated with each pertinent test recording), “Event” name, “Time”, “Structure Location”, raw “Output File” name, “Channel Gain List” name, “Prototype Unit File” name and a space for comments associated with the event. In addition, there is a column to describe the type of event. This mentions the general driving mechanism (slow cyclic or dynamic), the direction of motion for the slow cyclic events (horizontal or vertical), the weight of the structure (light, standard or heavy), and the height of horizontal push (standard or low). KNOWN LIMITATIONS OF RECORDED DATA AND MODEL Friction of the Teflon® supports was not accounted for in any of the tests. Resistance to lateral displacement or rotation would be largest on those buildings placed off center (Stations C, F, I, D, G and J) due to the lateral component of the radial centrifugal force direction. However, the coefficient of friction between Teflon® and aluminum is small (approximately 0.04) so the assumption was that the resistance was negligible compared to the applied moment (less than 2%). Depending on the weight of the structure, the resisting moment created by the support system ranged between 2.5 kN-m to 6.8 kN-m (prototype scale). This is comparable an approximate moment capacity of 200 kN-m to 450 kN-m on the footing. Due to friction in the bucket pivot point, and due to eccentric mass on the bucket, there may have been a small tilt of the container relative to the g-field. The bucket tilt was less than 0.5 degrees. During construction of the model and placement of the buildings, an attempt was made to locate accelerometers and linear potentiometers as accurately as possible. Due to the operators’ close proximity to the surface of the sand as well as the structure footings, small movements of the instruments during the test sequence were inevitable. The surface of the soil may have been inadvertently disturbed for the same reason. In some of the testing springs were used to hold instruments to the building. The forces from these springs were determined to be negligible compared to the total force that was imparted on the building. Therefore, the springs were neglected in the calculations. The above limitations were present in all of the tests that were conducted. Additional limitations were present in some of the other tests conducted. On May 29th during the test named sliderot2 one of the load cells went out of range. The settlement and rotation data can be used, however, none of the force data is reliable. On June 7th and unknown problem arose on the last five tests, the names are; sliding2, sliding3, sliderot1, sliding4 and sliding5. Although everything appears to be okay with the data when the applied moments were calculated, the values exceeded the theoretical maximum for that footing. One theory on the cause of this was the possibility that one or both of the load cells was overstressed and yielded. The author recommends that the force and moment data from these tests not be used. The analyses of the above mentioned tests have been included in the appendix for completeness. 14
DESCRIPTION OF DISPLACEMENT COMMAND FOR STATIC PUSH EVENTS Hydraulic actuators were used to apply controlled lateral and vertical forces to the building model foundations. LabVIEW® software was programmed to command the actuator to perform sinusoidal strokes at any frequency, amplitude and number of cycles. Time histories for all events can be found in Appendix B. Table 5b describes these slow, cyclic events in detail. Station D, for example, had two types of input motion. One of the command types was to achieve only sliding, the actuators were given the command to both move the same distance, 3 mm for example. The second type of input was for the structure to only rotate. Commands were given based on ratios of the heights of the actuators above the base of the footing and the desired amplitude of rotation, for example 0.5% rotation. DESCRIPTION OF DISPLACEMENT-COMMAND FILES FOR MODEL SHAKING The input motion used to command the shaker during the first four dynamic test events was a tapered cosine wave. The motion was a cosine that increased in amplitude through 6 cycles. Chronologically, the same wave sequence was subjected to the model 4 times, with an increasing amplification factor for each event. The final dynamic test event used a ground motion recorded in Santa Cruz from the Loma Prieta earthquake. See Table 5a for amplification factor values. ORGANIZATION OF DATA FILES AND PLOTS In addition to listing the date, time, rpm, and input file name for each test, Table 6 also gives the event description, amplification factors used to scale the amplitude of shaking, channel gain list with file names (CGL_*.txt), output file names, rough peak to peak base accelerations, and comments pertaining to each event. In the case of a shaking event, the event description is a shortened version of the full input file description. Several channel gain lists were used for the static and dynamic test events (Tables 7 and 8, respectively). They specified which instruments’ outputs, and in what order, would be recorded for a particular event. The information contained in each list is unique to each test. The order in which the instruments were sampled is referred to as “DT Entry No.” and corresponds to the column number to which data for an instrument was written in the original output file for an event. The initials “DT” stand for “Data Translation”, the company that manufactured the A/D board. The importance of the DT number is that it also gives the column number of the instrument data in the *.out output files. In the MathCAD example sheets, it is the Data Translation number that is used to name an instrument (i.e. accelerometer A15 is DT number 21 for the dynamic test sequence as shown in channel gain list “CGL_11.txt”). In the channel gain lists (Table 7 and 8), the column labeled “Scale Exp.” indicates how model data should be scaled according to centrifuge modeling laws. For example, a value of 2 means that to convert model values to prototype values, the data should be multiplied by N2, where N is the scale factor for gravity. All original raw output files had *.out extensions. Low frequency data sampling (256 Hz, model scale) occurred during the vertical and horizontal pseudo-static load tests and high frequency 15
data sampling (2048 Hz, model scale) occurred during the dynamic shaking events. Prototype files (with extensions *.prt) are output files that have been converted to engineering prototype units using the appropriate channel gain list and centrifuge scaling laws. As part of this conversion to *.prt format, all data was zero referenced. For the linear potentiometers the zero reference was the voltage recorded at 20g prior to testing. Accelerometers were zeroed prior to each shaking event. Example MathCAD conversion sheets are provided in Appendix A. Results from this test are presented in Appendices B and C. Appendix B contains plots of the structure in regards to the moment-rotation, settlement-rotation, lateral load-sliding and settlement-sliding. Appendix C contains the time histories of slow cyclic events and shake sequences. The page number at the bottom of each plot is specific to the instruments plotted on that page. Table 4a and 4b specify which instruments were used on each page for the slow cyclic test sequences. Table 4c specifies which instruments were used on each page for the dynamic test sequence. Note that “AB” represents the average base acceleration, and is included on all pages for easy reference. Also note that when “AB” is plotted with displacement, displacement time scales are correct, but the acceleration is not plotted to scale.
Table 4a: Organization of slow cyclic time histories, Horizontal Load, in Appendix C. Page # 1 2
Page Name Linear Potentiometers Load Cell
Instruments L1, L2, V1, V2, FB0, FB1 LC0, LC1
Table 4b: Organization of dynamic time histories in Appendix C. Page # 1 2 3 4 5 6 7
Page Name Soil Accelerations Station A Station K, East Wall Station K, West Wall. Station A, Linear Potentiometers Station K, East Wall Linear Poten. Station K, West Wall Linear Poten.
Instruments A4-A10 A11-A15 A21-A25 A16-A20 L1,L2,V1,V2 L1E, L2E, V1E, V2E L1W, L2W, V1W, V2W
16
6-29-04
6-10-04
6-10-04
6-7-04
6-2-04
6-1-04
5-28-04
5-27-04
5-21-04
5-19-04
Date
Table 5a: JMT01 Test Series Chronology
1
Test
Event
HSC1 HSC2 HSC3 HSC4 HSC5 HSC6 HSC7 HSC8 HSC9 HSC10 HSC11 HSC12
jmt01_01 jmt01_02 jmt01_03 jmt01_04 jmt01_05 jmt01_06 jmt01_07 jmt01_08 jmt01_09 jmt01_10 jmt01_11 jmt01_12
Time
Structure Location
Station C
Station C
StationF
HSC13 jmt01_13 HSC14 jmt01_14 HSC15 jmt01_15 HSC16 jmt01_16 HSC17 jmt01_17 HSC18 jmt01_18 HSC19 jmt01_19 HSC20 jmt01_20 Station I HSC21 jmt01_21 HSC22 jmt01_22 HSC23 jmt01_23 HSC24 jmt01_24 HSC25 jmt01_25 HSC26 jmt01_26 HSC27 jmt01_27 HSC28 jmt01_28 HSC29 jmt01_29 HSC30 jmt01_30 HSC31 jmt01_31 HSC32 jmt01_32 HSC33 jmt01_33 Station G HSC34 jmt01_34 HSC35 jmt01_35 HSC36 jmt01_36 HSC37 jmt01_37 HSC38 jmt01_38 HSC39 jmt01_39 VSC1 jmt01_40 VSC2 jmt01_41 VSC3 jmt01_42 VSC4 jmt01_43 VSC5 jmt01_44 VSC6 jmt01_45 VSC7 jmt01_46 VSC8 jmt01_47 VSC9 jmt01_48 Staton J VSC10 jmt01_49 VSC11 jmt01_50 VSC12 jmt01_51 VSC13 jmt01_52 VSC14 jmt01_53 VSC15 jmt01_54 VSC16 jmt01_55 VSC17 jmt01_56 VSC18 jmt01_57 HSC40 jmt01_58 HSC41 jmt01_59 HSC42 jmt01_60 HSC43 jmt01_61 HSC44 jmt01_62 HSC45 jmt01_63 HSC46 jmt01_64 Station E HSC47 jmt01_65 HSC48 jmt01_66 HSC49 jmt01_67 HSC50 jmt01_68 HSC51 jmt01_69 HSC52 jmt01_70 HSC53 jmt01_71 HSC54 jmt01_72 HSC55 jmt01_73 HSC56 jmt01_74 Station B HSC57 jmt01_75 HSC58 jmt01_76 HSC59 jmt01_77 HSC60 jmt01_78 HSC61 jmt01_79 HSC62 jmt01_80 HSC63 jmt01_81 Station D HSC64 jmt01_82 HSC65 jmt01_83 HSC66 jmt01_84 HSC67 jmt01_85 D1 jmt01_86 D2 jmt01_87 Stations A,K&L D3 jmt01_88 D4 jmt01_89 D5 jmt01_90 HSC - Horizontal Slow Cyclic VSC - Vertical Slow Cyclic D - Dynamic
Centrifugal Acceleration, N (g) 20 20 20 20 20 20 20 20 20 20 20 20 20 20 20 20 20 20 20 20 20 20 20 20 20 20 20 20 20 20 20 20 20 20 20 20 20 20 20 20 20 20 20 20 20 20 20 20 20 20 20 20 20 20 20 20 20 20 20 21 22 23 24 25 26 27 28 29 30 31 32 33 20 20 20 20 20 20 20 20 20 20 20 20 20 20 20 20 20 20
Output File
Channel Gain List
Prototype Unit File
Comments
light wall, 2 acct, pure sliding light wall, 2 acct, pure sliding light wall, 2 acct, pure sliding light wall, 2 acct, pure rotation light wall, 2 acct, pure rotation standard wall, 2 acct, pure sliding standard wall, 2 acct, pure sliding standard wall, 2 acct, pure rotation standard wall, 2 acct, pure sliding standard wall, 2 acct, pure sliding standard wall, 2 acct, pure rotation standard wall, 2 acct, slide and rotate
test1a.txt test1b.txt test3.txt rotation1.txt rotation2.txt test1.txt test2.txt rotation1.txt sliding1.txt sliding2.txt rotation1.txt slideandrot1.txt
CGL_01.txt CGL_01.txt CGL_01.txt CGL_01.txt CGL_01.txt CGL_02.txt CGL_02.txt CGL_02.txt CGL_03.txt CGL_03.txt CGL_03.txt CGL_03.txt
test1a.prt test1b.prt test3.prt rotation1.prt rotation2.prt test1.prt test2.prt rotation1.prt sliding1.prt sliding2.prt rotation1.prt slideandrot1.prt
square footing square footing square footing square footing square footing rectangular footing rectangular footing rectangular footing rectangular footing rectangular footing rectangular footing rectangular footing
standard wall, 2 acct, slide and rotate heavy wall, 2 acct, pure sliding heavy wall, 2 acct, pure rotation heavy wall, 2 acct, pure rotation heavy wall, 2 acct, pure rotation heavy wall, 2 acct, pure sliding heavy wall, 2 acct, slide and rotate heavy wall, 2 acct, pure sliding heavy wall, 2 acct, correct for rotation heavy wall, 2 acct, correct for rotation heavy wall, 2 acct, pure sliding heavy wall, 2 acct, pure sliding heavy wall, 2 acct, pure rotation heavy wall, 2 acct, pure rotation heavy wall, 2 acct, slide and rotate standard wall, 2 acct, pure rotation standard wall, 2 acct, pure rotation standard wall, 2 acct, pure rotation standard wall, 2 acct, pure rotation standard wall, 2 acct, pure sliding standard wall, 2 acct, pure rotation standard wall, 2 acct, pure rotation standard wall, 2 acct, pure rotation standard wall, 2 acct, pure rotation standard wall, 2 acct, pure rotation standard wall, 2 acct, pure sliding standard wall, 2 acct, pure sliding vertical push, down 6.35 mm vertical push, down 5 mm vertical push, up and down 1 mm vertical push, down 2 mm vertical push, up 1 mm vertical push, down 2 mm vertical push, up 1 mm vertical push, down 2 mm vertical push, up 1 mm vertical push, down 3 mm vertical push, up 1 mm vertical push, down 3 mm vertical push, up 1 mm vertical push, down 3 mm vertical push, up 1 mm vertical push, down 4 mm vertical push, down 4 mm vertical push, down 3 mm heavy wall, 2 acct, pure rotation heavy wall, 2 acct, pure rotation heavy wall, 2 acct, pure rotation heavy wall, 2 acct, pure rotation heavy wall, 2 acct, pure sliding heavy wall, 2 acct, pure rotation heavy wall, 2 acct, pure rotation heavy wall, 2 acct, pure rotation heavy wall, 2 acct, pure rotation heavy wall, 2 acct, pure rotation heavy wall, 2 acct, pure sliding heavy wall, 2 acct, pure sliding heavy wall, 2 acct, slide and rotate heavy wall, 2 acct, pure sliding heavy wall, 2 acct, pure sliding heavy wall,1 acct,intermediate height heavy wall,1 acct,intermediate height heavy wall,1 acct,intermediate height heavy wall,1 acct,intermediate height heavy wall,1 acct,intermediate height standard wall, 2 acct, pure rotation standard wall, 2 acct, pure rotation standard wall, 2 acct, pure rotation standard wall, 2 acct, pure rotation standard wall, 2 acct, pure sliding standard wall, 2 acct, pure sliding standard wall, 2 acct, pure rotation standard wall, 2 acct, pure sliding tapered cosine wave tapered cosine wave tapered cosine wave tapered cosine wave Santa Cruz motion
slideandrot2.txt sliding1.txt rotation1.txt rotation2.txt rotation3.txt sliding2.txt sliderot1.txt sliding3.txt correction1.txt correction2.txt sliding4.txt slide5.txt rotation5and6.txt rotation7.txt sliderot2.txt rotation1.txt rotation2.txt rotation3.txt rotation4.txt sliding1.txt rotation5.txt rotation6.txt rotation7.txt rotation8.txt rotation9.txt sliding2.txt sliding3.txt push1.txt push2.txt push3.txt push4.txt push5.txt push6.txt push7.txt push8.txt push9.txt push10.txt push11.txt push12.txt push13.txt push14.txt push15.txt push16.txt push17.txt push18.txt rotation1.txt rotation2.txt rotation3.txt rotation4.txt sliding1.txt rotation5.txt rotation6.txt rotation7.txt rotation8.txt rotation9.txt sliding2.txt sliding3.txt sliderot1.txt sliding4.txt sliding5.txt push1.txt push2.txt push3.txt push4.txt push5.txt rotation1.txt rotation2.txt rotation3.txt rotation4.txt sliding1.txt sliding2.txt rotation5.txt sliding3.txt testa_temp.txt testb_temp.txt testc_temp.txt testd_temp.txt teste_temp.txt
CGL_03.txt CGL_04.txt CGL_04.txt CGL_04.txt CGL_04.txt CGL_04.txt CGL_04.txt CGL_04.txt CGL_04.txt CGL_04.txt CGL_04.txt CGL_04.txt CGL_04.txt CGL_04.txt CGL_04.txt CGL_05.txt CGL_05.txt CGL_05.txt CGL_05.txt CGL_05.txt CGL_05.txt CGL_05.txt CGL_05.txt CGL_05.txt CGL_05.txt CGL_05.txt CGL_05.txt CGL_VP.txt CGL_VP.txt CGL_VP.txt CGL_VP.txt CGL_VP.txt CGL_VP.txt CGL_VP.txt CGL_VP.txt CGL_VP.txt CGL_VP.txt CGL_VP.txt CGL_VP.txt CGL_VP.txt CGL_VP.txt CGL_VP.txt CGL_VP.txt CGL_VP.txt CGL_VP.txt CGL_06.txt CGL_06.txt CGL_06.txt CGL_06.txt CGL_06.txt CGL_06.txt CGL_06.txt CGL_06.txt CGL_06.txt CGL_06.txt CGL_06.txt CGL_06.txt CGL_06.txt CGL_06.txt CGL_06.txt CGL_07.txt CGL_07.txt CGL_07.txt CGL_07.txt CGL_07.txt CGL_07.txt CGL_07.txt CGL_07.txt CGL_07.txt CGL_07.txt CGL_07.txt CGL_07.txt CGL_07.txt CGL_11.txt CGL_11.txt CGL_11BIG.txt CGL_11BIG.txt CGL_11BIG.txt
slideandrot2.prt sliding1.prt rotation1.prt rotation2.prt rotation3.prt sliding2.prt sliderot1.prt sliding3.prt correction1.prt correction2.prt sliding4.prt slide5.prt rotation5and6.prt rotation7.prt sliderot2.prt rotation1.prt rotation2.prt rotation3.prt rotation4.prt sliding1.prt rotation5.prt rotation6.prt rotation7.prt rotation8.prt rotation9.prt sliding2.prt sliding3.prt push1.prt push2.prt push3.prt push4.prt push5.prt push6.prt push7.prt push8.prt push9.prt push10.prt push11.prt push12.prt push13.prt push14.prt push15.prt push16.prt push17.prt push18.prt rotation1.prt rotation2.prt rotation3.prt rotation4.prt sliding1.prt rotation5.prt rotation6.prt rotation7.prt rotation8.prt rotation9.prt sliding2.prt sliding3.prt sliderot1.prt sliding4.prt sliding5.prt push1.prt push2.prt push3.prt push4.prt push5.prt rotation1.prt rotation2.prt rotation3.prt rotation4.prt sliding1.prt sliding2.prt rotation5.prt sliding3.prt testa_temp.prt testb_temp.prt testc_temp.prt testd_temp.prt teste_temp.prt
rectangular footing rectangular footing rectangular footing rectangular footing rectangular footing rectangular footing rectangular footing rectangular footing rectangular footing rectangular footing rectangular footing rectangular footing rectangular footing rectangular footing rectangular footing square footing square footing square footing square footing square footing square footing square footing square footing square footing square footing square footing square footing push distances are in model scale
Description1
Amp g - peakFactor to-peak
0.2 .06 2.0 3.0 15
0.65 1.4 16 34 22
all files were stacked and plotted to form one single plot
rectangular footing rectangular footing rectangular footing rectangular footing rectangular footing rectangular footing rectangular footing rectangular footing rectangular footing rectangular footing rectangular footing rectangular footing rectangular footing rectangular footing rectangular footing rectangular footing rectangular footing rectangular footing rectangular footing rectangular footing square footing square footing square footing square footing square footing square footing square footing square footing
17
-Cyclic Test Event Specifics Structure Location
Station B
Station C
Station D
Station E
Station F
Station G
Station I
Station J
Type of Command Motion
# Cycles
Sine Wave Sine Wave Sine Wave Sine Wave Sine Wave Sine Wave (Sliding) Sine Wave (Sliding) Sine Wave (Sliding) Sine Wave (Sliding) Sine Wave (Sliding) Sine Wave (Rotation) Sine Wave (Rotation) Sine Wave (Rotation) Sine Wave (Sliding) Sine Wave (Sliding) Sine Wave (Sliding) Sine Wave (Rotation) Sine Wave (Rotation) Sine Wave (Rotation) Sine Wave (Rotation) Sine Wave (Rotation) Sine Wave (Sliding) Sine Wave (Sliding) Sine Wave (Sliding) Sine Wave (Sliding) Sine Wave (Sliding) Sine Wave (Rotation) Sine Wave (Rotation) Sine Wave (Rotation) Sine Wave (Rotation) Sine Wave (Rotation) Sine Wave (Rotation) Sine Wave (Rotation) Sine Wave (Rotation) Sine Wave (Rotation) Sine Wave (Sliding and Rotation) Sine Wave (Sliding) Sine Wave (Sliding) Sine Wave (Rotation) Sine Wave (Sliding and Rotation) Sine Wave (Sliding and Rotation) Sine Wave (Sliding) Sine Wave (Sliding) Sine Wave (Sliding) Sine Wave (Rotation) Sine Wave (Rotation) Sine Wave (Rotation) Sine Wave (Rotation) Sine Wave (Rotation) Sine Wave (Rotation) Sine Wave (Rotation) Sine Wave (Rotation) Sine Wave (Rotation) Sine Wave (Sliding) Sine Wave (Sliding) Sine Wave (Sliding) Sine Wave (Sliding) Sine Wave (Rotation) Sine Wave (Rotation) Sine Wave (Rotation) Sine Wave (Rotation) Sine Wave (Rotation) Sine Wave (Rotation) Sine Wave (Sliding and Rotation) Sine Wave (Sliding and Rotation) Monotonic Push Monotonic Push Monotonic Push Monotonic Push Triangle Wave Monotonic Push Monotonic Push Monotonic Push Monotonic Push Monotonic Push Monotonic Push Monotonic Push Monotonic Push Monotonic Push Monotonic Push Monotonic Push Monotonic Push Monotonic Push Monotonic Push Monotonic Push
3 3 3 3 3 3 3 3 3 3 3 3 3 3 3 3 3 3 3 3 3 3 3 3 3 3 3 3 3 3 3 3 3 3 3 3 3 3 3 3 3 3 2 2 3 3 3 3 3 3 3 3 3 3 2 2 2 3 3 3 3 3 3 2 2 1 1 1 1 0.5 1 1 1 1 1 1 1 1 1 1 1 1 1 1 1
Max Amplitude (mm/percent rotation) 1.0 2.0 4.0 8.0 16.0 1.5 1.5 4.5 1.5 3.0 1.0% 1.0% 2.0% 3.0 6.0 6.0 0.5% 1.0% 2.0% 4.0% 5.0% 3.0 3.0 6.0 6.0 12.0 0.5% 1.0% 2.0% 4.0% 0.5% 1.0% 2.0% 4.0% 6.0% 6.0, 3% 4.5 9.0 2.0% 3.0, 2.0% 3.0,-2.0% 3.0 3.0 6.0 0.5% 1.0% 2.0% 4.0% 0.5% 1.0% 2.0% 4.0% 6.0% 1.5 3.0 3.0 3.0 0.5% 1.0% 2.0% 0.5% 1.0% 2.0% 6.0, 2.0% 6.0, -2.0% 1.5% 3.5% 6.35 5.0 1.0 2.0 -1.0 2.0 -1.0 2.0 -1.0 3.0 -1.0 3.0 -1.0 3.0 -1.0 4.0 4.0 3.0
Freq (Hz)
Amp Ratio
Freq Ratio
0.03 0.03 0.03 0.03 0.03 0.03 0.03 0.03 0.03 0.03 0.03 0.03 0.03 0.03 0.03 0.03 0.03 0.03 0.03 0.03 0.03 0.03 0.03 0.03 0.03 0.03 0.03 0.03 0.03 0.03 0.03 0.03 0.03 0.03 0.03 0.03 0.03 0.03 0.03 0.03 0.03 0.03 0.03 0.03 0.03 0.03 0.03 0.03 0.03 0.03 0.03 0.03 0.03 0.03 0.03 0.03 0.03 0.03 0.03 0.03 0.03 0.03 0.03 0.03 0.03 n/a n/a n/a n/a 0.02 n/a n/a n/a n/a n/a n/a n/a n/a n/a n/a n/a n/a n/a n/a n/a
n/a n/a n/a n/a n/a n/a n/a n/a n/a n/a n/a n/a n/a n/a n/a n/a n/a n/a n/a n/a n/a n/a n/a n/a n/a n/a n/a n/a n/a n/a n/a n/a n/a n/a n/a n/a n/a n/a n/a n/a n/a n/a n/a n/a n/a n/a n/a n/a n/a n/a n/a n/a n/a n/a n/a n/a n/a n/a n/a n/a n/a n/a n/a n/a n/a n/a n/a n/a n/a n/a n/a n/a n/a n/a n/a n/a n/a n/a n/a n/a n/a n/a n/a n/a n/a
n/a n/a n/a n/a n/a n/a n/a n/a n/a n/a n/a n/a n/a n/a n/a n/a n/a n/a n/a n/a n/a n/a n/a n/a n/a n/a n/a n/a n/a n/a n/a n/a n/a n/a n/a n/a n/a n/a n/a n/a n/a n/a n/a n/a n/a n/a n/a n/a n/a n/a n/a n/a n/a n/a n/a n/a n/a n/a n/a n/a n/a n/a n/a n/a n/a n/a n/a n/a n/a n/a n/a n/a n/a n/a n/a n/a n/a n/a n/a n/a n/a n/a n/a n/a n/a
18
Table 6: Instrument List for JMT01 Instrument Location No.
Soil Structure Station A Station L and K Station C Station F Station I Station G Station E Station B Station D
Instr. Type
Engr. units
Location Description
Coordinate System Type
Initial Position of Instrument: (See Fig 1 and 2 for coord. origins), mm y (north) z (up)
Direction
Instr. Instrument Range Serial No.
Calibr. Factor1 and Units
Scale Factor Exp.
Comments
x (east)
Container
Group
A1
acc
g's
NE Horizontal Load Frame
Absolute
A2
acc
g's
NW Horizontal Load Frame
Absolute
A3
acc
g's
North Vertical Base Plate
Absolute
H
50g
A3202
9.5
g/v
H
50g
A3950
9.5
g/v
V
50g
A3949
9.5
g/v
A4
acc
g's
Station A North Horizontal
Absolute
727.0
1512.0
-1
90.0
H
100g
A5599
-19
g/v
-1
A5
acc
g's
Station A South Horizontal
Absolute
718.0
1280.0
87.0
H
100g
A5602
-19
g/v
-1
A6
acc
g's
Station A Vertical
Absolute
728.0
1401.0
96.0
V
100g
A7
acc
g's
Station K North Horizontal
Absolute
165.0
448.0
99.0
H
100g
A5598
-19
g/v
-1
A8
acc
g's
Station K South Horizontal
Absolute
169.0
289.0
107.0
H
100g
A21051
-19
g/v
-1
A9
acc
g's
Station K Vertical
Absolute
151.0
349.0
101.0
V
100g
A21704
-19
g/v
-1 -1
Mounted to exterior of sample box
A5604
-19
g/v
-1 -1
-1
A10
acc
g's
Free Field Surface
Absolute
-
-
-
H
50g
A3955
9.5
g/v
VFF
displ
mm
Free Field Settlement
Absolute
2.52
mm/v
1
Single Wall Top Horizontal
Local
-12.0
LP110
g's
128.0
1"
acc
0.0
V
A11
H
50g
A4437
9.5
g/v
-1
A12
acc
g's
Single Wall Middle Horizontal
Local
0.0
128.0
-322.0
H
50g
A3951
9.5
g/v
-1
A13
acc
g's
Single Wall Bottom Horizontal
Local
89.0
-504.0
H
50g
A3204
9.5
g/v
-1
A14
acc
g's
Single Wall North Vertical
Local
0.0
11.0
0.0
V
50g
A3960
9.5
g/v
-1
A15
acc
g's
Single Wall South Vertical
Local
0.0
107.0
0.0
V
50g
A3961
9.5
g/v
-1
A16
acc
g's
Double Wall West Wall Top Horizontal
Local
0.0
89.0
-10.0
H
50g
A5267
9.5
g/v
-1
A17
acc
g's
Double Wall West Wall Middle Horizontal
Local
0.0
89.0
-295.0
H
50g
A5274
9.5
g/v
-1
A18
acc
g's
Double Wall West Wall Bottom Horizontal
Local
0.0
116.0
-490.0
H
50g
A3203
9.5
g/v
-1
A19
acc
g's
Double Wall West Wall North Vertical
Local
0.0
8.0
0.0
V
50g
A3963
9.5
g/v
-1
A20
acc
g's
Double Wall West Wall South Vertical
Local
0.0
82.0
0.0
V
50g
A4596
9.5
g/v
-1
A21
acc
g's
Double Wall East Wall Top Horizontal
Local
0.0
89.0
-10.0
H
50g
A3962
9.5
g/v
-1
A22
acc
g's
Double Wall East Wall Middle Horizontal
Local
0.0
89.0
-295.0
H
50g
A5268
9.5
g/v
-1
A23
acc
g's
Double Wall East Wall Bottom Horizontal
Local
0.0
116.0
-488.0
H
50g
A4435
9.5
g/v
-1
A24
acc
g's
Double Wall East Wall north Vertical
Local
0.0
7.0
0.0
V
50g
A3166
9.5
g/v
-1
A25
acc
g's
Double Wall East Wall South Vertical
Local
0.0
84.0
0.0
V
50g
A3964
9.5
g/v
-1
L1
displ
mm
Single Wall Bottom Horizontal
Local
0.0
0.0
-390.0
H
LP405
10.1
mm/v
1
L2
displ
mm
Single Wall Top Horizontal
Local
0.0
0.0
-290.0
H
LP410
10.1
mm/v
1
V1
displ
mm
Single Wall South Vertical
Local
10.0
20.0
-425.0
V
LP202
5.05
mm/v
1
V2
displ
mm
Single Wall North Vertical
Local
10.0
125.0
-425.0
V
LP214
5.05
mm/v
1
L1W
displ
mm
Double Wall West Wall Bottom Horizontal
Local
0.0
0.0
-385.0
H
LP408
10.1
mm/v
1
L2W
displ
mm
Double Wall West Wall Top Horizontal
Local
0.0
0.0
-285.0
H
LP411
10.1
mm/v
V1W
displ
mm
Double Wall West Wall South Vertical
Local
10.0
-20.0
-435.0
V
LP407
10.1
mm/v
1
V2W
displ
mm
Double Wall West Wall North Vertical
Local
10.0
77.0
-435.0
V
LP603
15.15
mm/v
1
LIE
displ
mm
Double Wall East Wall Bottom Horizontal
Local
0.0
0.0
-380.0
H
LP409
10.1
mm/v
L2E
displ
mm
Double Wall East Wall Top Horizontal
Local
0.0
0.0
-277.0
H
LP412
10.1
mm/v
1
V1E
displ
mm
Double Wall East Wall South Vertical
Local
-10.0
-25.0
-425.0
V
LP604
15.15
mm/v
1
V2E
displ
mm
Double Wall East Wall north Vertical
Local
-10.0
75.0
-425.0
V
LP413
10.1
mm/v
FB0
load
N
Bottom Feedback LVDT
Local
0.0
83.0
-339.0
H
12"
15
mm/V
1
FB1
load
N
Top Feedback LVDT
Local
0.0
83.0
-249.0
H
12"
15
mm/V
1
LC1
displ
mm
Bottom Load Cell
Local
-339.0
H
1000#
LC2
displ
mm
Top Load Cell
Local
0.0
83.0
-249.0
H
1000#
V1
displ
mm
Southern Vertical Linear Pot
Local
10.0
-45.0
-408.0
V
2"
LP201
0.0
0.0
83.0
115471
1
1
1
N/V
-2
115471
N/V
-2
5.06
mm/V
1
V2
displ
mm
Northern Vertical Linear Pot
Local
10.0
58.0
-408.0
V
2"
LP214
5.06
mm/V
1
L1
displ
mm
Bottom Horizontal Linear Pot
Local
0.0
0.0
-398.0
H
4"
LP405
10.11
mm/V
1
L2
Top Horizontal Linear Pot
Local
0.0
0.0
-298.0
H
4"
LP410
10.11
mm/V
1
displ
mm
FB0
load
N
Bottom Feedback LVDT
Local
0.0
157.0
-334.0
H
12"
15
mm/V
FB1
load
N
Top Feedback LVDT
Local
0.0
157.0
-244.0
H
12"
15
mm/V
1
LC1
displ
mm
Bottom Load Cell
Local
0.0
157.0
-334.0
H
1000#
115471
N/V
-2
LC2
displ
mm
Top Load Cell
Local
0.0
-244.0
H
1000#
N/V
-2
V1
displ
mm
Southern Vertical Linear Pot
Local
10.0
18.0
-424.0
V
2":
LP202
5.06
mm/V
1
V2
displ
mm
Northern Vertical Linear Pot
Local
10.0
121.0
-424.0
V
2"
LP214
5.06
mm/V
1
L1
displ
mm
Bottom Horizontal Linear Pot
Local
0.0
0.0
-361.0
H
4"
LP405
10.11
mm/V
1
L2
displ
mm
Top Horizontal Linear Pot
Local
0.0
0.0
-261.0
H
4"
LP410
10.11
mm/V
1
FB0
load
N
Bottom Feedback LVDT
Local
0.0
120.0
-369.0
H
12"
15
mm/V
FB1
load
N
Top Feedback LVDT
Local
0.0
120.0
-279.0
H
12"
15
mm/V
1
LC1
displ
mm
Bottom Load Cell
Local
0.0
120.0
-369.0
H
1000#
115471
N/V
-2
LC2
displ
mm
Top Load Cell
N/V
-2
157.0
115471
1
Local
0.0
120.0
-279.0
H
1000#
V1
displ
mm
Southern Vertical Linear Pot
Local
10.0
-30.0
-427.0
V
2"
LP202
5.06
mm/V
L1
displ
mm
Bottom Horizontal Linear Pot
Local
0.0
0.0
-379.0
H
4"
LP405
10.11
mm/V
1
L2
displ
mm
Top Horizontal Linear Pot
Local
0.0
0.0
-279.0
H
4"
LP410
10.11
mm/V
1
V2
displ
mm
Northern Vertical Linear Pot
Local
10.0
73.0
-427.0
2"
LP214
5.4
mm/V
1
FB0
load
N
FB1
displ
mm
LC1
load
N
LC2
displ
mm
V
115471
1
1
Bottom Feedback LVDT
Local
0.0
160.0
-419.0
H
12"
15
mm/V
Top Feedback LVDT
Local
0.0
160.0
-329.0
H
12"
15
mm/V
1
Bottom Load Cell
Local
0.0
160.0
-419.0
H
1000#
115471
N/V
-2 -2
Top Load Cell
1
Local
0.0
160.0
-329.0
H
1000#
115471
N/V
V1
displ
mm
Southern Vertical Linear Pot
Local
-10.0
27.0
-479.0
V
2"
LP202
5.06
mm/V
L1
displ
mm
Bottom Horizontal Linear Pot
Local
0.0
0.0
-429.0
H
4"
LP405
10.11
mm/V
1
L2
displ
mm
Top Horizontal Linear Pot
Local
0.0
0.0
-329.0
H
4"
LP410
10.11
mm/V
1
V2
displ
mm
Northern Vertical Linear Pot
Local
-10.0
130.0
-479.0
V
2"
LP214
5.4
mm/V
1
FB0
load
N
1
Bottom Feedback LVDT
Local
0.0
120.0
-364.0
H
12"
15
mm/V
FB1
Top Feedback LVDT
Local
0.0
120.0
-274.0
H
12"
15
mm/V
1
LC1
Bottom Load Cell
Local
0.0
120.0
-364.0
H
1000#
115471
N/V
-2
Top Load Cell
Local
0.0
120.0
-274.0
H
1000#
115471
N/V
-2
Local
10.0
-25.0
-416.0
LC2
displ
mm
V1
displ
mm
Southern Vertical Linear Pot
L1
displ
mm
Bottom Horizontal Linear Pot
Local
0.0
0.0
-374.0
H
4"
LP405
10.11
mm/V
1
L2
displ
mm
Top Horizontal Linear Pot
Local
0.0
0.0
-284.0
H
4"
LP410
10.11
mm/V
1
V2
displ
mm
Northern Vertical Linear Pot
Local
10.0
78.0
-416.0
2"
LP214
5.4
mm/V
1
FB0
load
N
FB1
displ
mm
V1 L1
V
V
2"
LP202
5.06
mm/V
1
1
Bottom Feedback LVDT
Local
0.0
120.0
-326.0
H
12"
15
mm/V
Top Feedback LVDT
Local
0.0
120.0
-236.0
H
12"
15
mm/V
1
Southern Vertical Linear Pot
Local
10.0
-28.0
-397.0
V
2"
5.06
mm/V
1
LP202
1
Bottom Horizontal Linear Pot
Local
0.0
0.0
-351.0
H
4"
LP405
10.11
mm/V
L2
displ
mm
Top Horizontal Linear Pot
Local
0.0
0.0
-251.0
H
4"
LP410
10.11
mm/V
1
LC1
displ
mm
Bottom Load Cell
Local
0.0
120.0
-326.0
H
3000#
-
413891
N/V
-2
1
LC2
displ
mm
Top Load Cell
H
V2
displ
mm
FB0
load
N
Local
0.0
120.0
-236.0
3000#
-
413891
N/V
-2
Northern Vertical Linear Pot
Local
10.0
75.0
-397.0
V
2"
LP214
5.4
mm/V
1
Bottom Feedback LVDT
Local
0.0
160.0
-349.0
H
12"
15
mm/V
FB1
Top Feedback LVDT
Local
0.0
160.0
-259.0
H
12"
15
mm/V
1
V1
Southern Vertical Linear Pot
Local
-10.0
10.0
-419.0
V
2"
LP202
5.06
mm/V
1
Bottom Horizontal Linear Pot
Local
0.0
0.0
-384.0
H
4"
LP405
10.11
mm/V
1
Local
0.0
4"
LP410
10.11
mm/V
L1
displ
mm
0.0
-284.0
H
1
L2
displ
mm
Top Horizontal Linear Pot
LC1
displ
mm
Bottom Load Cell
Local
0.0
160.0
-349.0
H
3000#
-
413891
N/V
-2
LC2
displ
mm
Top Load Cell
Local
0.0
160.0
-259.0
H
3000#
-
413891
N/V
-2
1
V2
displ
mm
Northern Vertical Linear Pot
Local
-10.0
113.0
-419.0
V
2"
LP214
5.4
mm/V
1
1. Calibration factor as applied to raw data. The data files included in this report are in model-scale engineering units (g's, mm).
19
Table 7: Slow Cyclic Test Channel Gain Lists JMT01_C Entry # 1 2 3 4 5 6 7 8 9 10
DT # 0 1 2 3 4 5 6 7 8 9
Inst. # DA0 DA1 FB0 FB1 LC1 LC2 V1 V2 L1 L2
Amp. XDCR XDCR XDCR XDCR XDCR XDCR
"CGL_01.txt" Amp Chnl Amp Gain 0 250 1 250 2 1 3 1 4 1 5 1
Description Top Command Bottom Command Bottom Feedback LVDT Top Feedback LVDT Bottom Load Cell Top Load Cell Southern Vertical Linear Pot Northern Vertical Linear Pot Bottom Horizontal Linear Pot Top Horizontal Linear Pot
Serial #
JMT01_C Entry # 1 2 3 4 5 6 7 8 9 10
DT # 0 1 2 3 4 5 6 7 8 9
Inst. # DA0 DA1 FB0 FB1 LC1 LC2 V1 V2 L1 L2
Amp. XDCR XDCR XDCR XDCR XDCR XDCR
"CGL_02.txt" Amp Chnl Amp Gain 0 250 1 250 2 1 3 1 4 1 5 1
Description Top Command Bottom Command Bottom Feedback LVDT Top Feedback LVDT Bottom Load Cell Top Load Cell Southern Vertical Linear Pot Northern Vertical Linear Pot Bottom Horizontal Linear Pot Top Horizontal Linear Pot
Serial #
JMT01_F Entry # 1 2 3 4 5 6 7 8 9 10
DT # 0 1 2 3 4 5 6 7 8 9
Inst. # DA0 DA1 FB0 FB1 LC1 LC2 V1 V2 L1 L2
Amp. XDCR XDCR XDCR XDCR XDCR XDCR
"CGL_03.txt" Amp Chnl Amp Gain 0 250 1 250 2 1 3 1 4 1 5 1
Description Top Command Bottom Command Bottom Feedback LVDT Top Feedback LVDT Bottom Load Cell Top Load Cell Southern Vertical Linear Pot Northern Vertical Linear Pot Bottom Horizontal Linear Pot Top Horizontal Linear Pot
Serial #
JMT01_I Entry # 1 2 3 4 5 6 7 8 9 10
DT # 0 1 2 3 4 5 6 7 8 9
Inst. # DA0 DA1 FB0 FB1 LC1 LC2 V1 L1 L2 V2
Amp. XDCR XDCR XDCR XDCR XDCR XDCR
"CGL_04.txt" Amp Chnl Amp Gain 0 250 1 250 2 1 4 1 5 1 6 1
Description Top Command Bottom Command Bottom Feedback LVDT Top Feedback LVDT Bottom Load Cell Top Load Cell Southern Vertical Linear Pot Bottom Horizontal Linear Pot Top Horizontal Linear Pot Northern Vertical Linear Pot
Serial #
JMT01_G Entry # 1 2 3 4 5 6 7 8 9 10
DT # 0 1 2 3 4 5 6 7 8 9
Inst. # DA0 DA1 FB0 FB1 LC1 LC2 V1 L1 L2 V2
Amp. XDCR XDCR XDCR XDCR XDCR XDCR
"CGL_05.txt" Amp Chnl Amp Gain 0 250 1 250 2 1 4 1 5 1 6 1
Description Top Command Bottom Command Bottom Feedback LVDT Top Feedback LVDT Bottom Load Cell Top Load Cell Southern Vertical Linear Pot Bottom Horizontal Linear Pot Top Horizontal Linear Pot Northern Vertical Linear Pot
Serial #
JMT01_E Entry # 1 2 3 4 5 6 7 8 9 10
DT # 0 1 2 3 4 5 6 7 8 9
Inst. # DA0 DA1 FB0 FB1 LC1 LC2 V1 L1 L2 V2
Amp. XDCR XDCR XDCR XDCR XDCR XDCR
"CGL_06.txt" Amp Chnl Amp Gain 0 100 1 100 2 1 4 1 5 1 6 1
Description Top Command Bottom Command Bottom Feedback LVDT Top Feedback LVDT Bottom Load Cell Top Load Cell Southern Vertical Linear Pot Bottom Horizontal Linear Pot Top Horizontal Linear Pot Northern Vertical Linear Pot
Serial #
JMT01_B,D Entry # 1 2 3 4 5 6 7 8 9 10
DT # 0 1 2 3 4 5 6 7 8 9
Inst. # DA0 DA1 FB0 FB1 V1 L1 L2 LC1 LC2 V2
Amp. XDCR XDCR XDCR XDCR XDCR XDCR
"CGL_07.txt" Amp Chnl Amp Gain 2 1 4 1 5 1 6 100 7 100 8 1
Description Top Command Bottom Command Bottom Feedback LVDT Top Feedback LVDT Southern Vertical Linear Pot Bottom Horizontal Linear Pot Top Horizontal Linear Pot Bottom Load Cell Top Load Cell Northern Vertical Linear Pot
Serial #
LP201 LP214 LP405 LP410
LP201 LP214 LP405 LP410
LP202 LP214 LP405 LP410
LP202 LP405 LP410 LP214
LP202 LP405 LP410 LP214
LP202 LP405 LP410 LP214
LP202 LP405 LP410 LP604 LP201 LP214
Calibration 15 15 15 15 115471 115471 5.06 5.06 10.11 10.11
Units KN/V KN/V mm/V mm/V mm/V mm/V
Zero 5.00 5.00 5.00 5.00 0.20 0.25 -1.10 -0.95 0.55 0.70
Scale Exp 1 1 1 1 -2 -2 1 1 1 1
Calibration 15 15 15 15 115471 115471 5.06 5.06 10.11 10.11
Units KN/V KN/V mm/V mm/V mm/V mm/V
Zero 5.00 5.00 5.00 5.00 0.29 0.26 -1.34 -1.22 -0.43 0.54
Scale Exp 1 1 1 1 -2 -2 1 1 1 1
Calibration 15 15 15 15 115471 115471 5.06 5.06 10.11 10.11
Units mm/V mm/V mm/V mm/V N/V N/V mm/V mm/V mm/V mm/V
Zero 5.00 5.00 5.00 5.00 0.65 0.28 -0.75 -0.79 -1.77 -1.59
Scale Exp 1 1 1 1 -2 -2 1 1 1 1
Calibration 15 15 15 15 115471 115471 5.06 10.11 10.11 5.4
Units mm/V mm/V mm/V mm/V N/V N/V mm/V mm/V mm/V mm/V
Zero 5.00 5.00 -0.50 -0.65 -0.03 0.61
Scale Exp
Calibration 15 15 15 15 115471 115471 5.06 10.11 10.11 5.4
Units mm/V mm/V mm/V mm/V N/V N/V mm/V mm/V mm/V mm/V
Zero 5.00 5.00 0.60 -0.95 -1.03 0.25 0.93
Scale Exp 1 1 1 1 -2 -2 1 1 1 1
Calibration 15 15 15 15 115471 115471 5.06 10.11 10.11 5.4
Units mm/V mm/V mm/V mm/V N/V N/V mm/V mm/V mm/V mm/V
Zero 5.00 5.00 0.58 -0.12 -1.71 -0.25 -0.60
Scale Exp 1 1 1 1 -2 -2 1 1 1 1
Calibration 15 15 15 15 5.06 10.11 10.11 413891 413891 5.4
Units mm/V mm/V mm/V mm/V mm/V mm/V mm/V N/V N/V mm/V
Zero 5.00 5.00 0.58 -0.59 -1.95 -2.26 -1.70
Scale Exp
1 1 1 1 -2 -2 1 1 1 1
1 1 1 1 1 1 1 -2 -2 1 20
Table 8: Dynamic Test Channel Gain List "CGL_11.TXT" Entry # DT #
Instr.#
Amp.
Amp Channel
Amp Gain
Description
Serial #
Calibration
Units
Scale Exp
1
0
V1
PVL
XDCR2
1
LP202
5.05
mm/v
1
2
1
L2
PVL
XDCR4
1
LP410
10.1
mm/v
1
3
2
L1
PVL
XDCR5
1
LP405
10.1
mm/v
1
4
3
V2
PVL
XDCR7
1
LP214
5.05
mm/v
1
5
4
V2W
PVL
XDCR9
1
LP603
15.15
mm/v
1
6
5
V1W
PVL
XDCR10
1
7
6
V1E
PVL
XDCR11
1
8
7
L1E
PVL
XDCR12
1
9
8
L2W
PVL
XDCR15
1
10
9
L2E
PVL
XDCR16
1
11
10
VFF
PVL
XDCR18
1
12
11
V2E
PVL
XDCR19
1
13
12
L1W
PVL
XDCR20
1
14
13
A23
PBP
DC48
10
15
14
A20
PBP
DC49
10
16
15
A19
PBP
DC50
10
17
16
A16
PBP
DC51
10
18
17
A17
PBP
DC52
10
19
18
A13
PBP
DC53
10
20
19
A11
PBP
DC54
10
21
20
A14
PBP
DC56
10
22
21
A15
PBP
DC57
10
23
22
A12
PBP
DC58
10
24
23
A3
PBP
DC59
10
25
24
A18
PBP
DC62
10
26
25
A24
PBP
DC63
10
27
26
A1
PBP
DC35
10
28
27
A2
PBP
DC36
10
29
28
A4
PBP
DC37
10
30
29
A6
PBP
DC38
10
31
30
A5
PBP
DC39
10
32
31
A8
PBP
DC40
10
33
32
A7
PBP
DC41
10
Single Wall South Vertical Single Wall Top Horizontal Single Wall Bottom Horizontal Single Wall North Vertical Double Wall West Wall North Vertical Double Wall West Wall South Vertical Double Wall East Wall South Vertical Double Wall East Wall Bottom Horizontal Double Wall West Wall Top Horizontal Double Wall East Wall Top Horizontal Free Field Settlement Double Wall East Wall north Vertical Double Wall West Wall Bottom Horizontal Double Wall East Wall Bottom Horizontal Double Wall West Wall South Vertical Double Wall West Wall North Vertical Double Wall West Wall Top Horizontal Double Wall West Wall Middle Horizontal Single Wall Bottom Horizontal Single Wall Top Horizontal Single Wall North Vertical Single Wall South Vertical Single Wall Middle Horizontal Box Vertical Double Wall West Wall Bottom Horizontal Double Wall East Wall north Vertical Box North East Horizontal Box North West Horizontal Station A North Horizontal Station A Vertical Station A South Horizontal Station K South Horizontal Station K North Horizontal Station K Vertical Free Field Surface Double Wall East Wall Middle Horizontal Double Wall East Wall Top Horizontal Double Wall East Wall South Vertical
34
33
A9
PBP
DC42
10
35
34
A10
PBP
DC43
10
36
35
A22
PBP
DC44
10
37
36
A21
PBP
DC45
10
38
37
A25
PBP
DC47
10
"CGL_11BIG.TXT" Entry # DT #
LP407
10.1
mm/v
1
LP604
15.15
mm/v
1
LP409
10.1
mm/v
1
LP411
10.1
mm/v
1
LP412
10.1
mm/v
1
LP110
2.52
mm/v
1
LP413
10.1
mm/v
1
LP408
10.1
mm/v
1
A4435
9.5
g/v
-1
A4596
9.5
g/v
-1
A3963
9.5
g/v
-1
A5267
9.5
g/v
-1
A5274
9.5
g/v
-1
A3204
9.5
g/v
-1
A4437
9.5
g/v
-1
A3960
9.5
g/v
-1
A3961
9.5
g/v
-1
A3951
9.5
g/v
-1
A3949
9.5
g/v
-1
A3203
9.5
g/v
-1
A3166
9.5
g/v
-1
A3202
9.5
g/v
-1
A3950
9.5
g/v
-1
A5599
-19
g/v
-1
A5604
-19
g/v
-1
A5602
-19
g/v
-1
A21051
-9.5
g/v
-1
A5598
-19
g/v
-1
A21704
-19
g/v
-1
A3955
9.5
g/v
-1
A5268
9.5
g/v
-1
A3962
9.5
g/v
-1
A3964
9.5
g/v
-1
Instr.#
Amp.
Amp Channel
Amp Gain
Description
Serial #
Calibration
Units
Scale Exp
1
0
L1
PVL
XDCR2
1
LP202
5.05
mm/v
1
2
1
L2
PVL
XDCR4
1
LP410
10.1
mm/v
1
3
2
L3
PVL
XDCR5
1
LP405
10.1
mm/v
1
4
3
L4
PVL
XDCR7
1
LP214
5.05
mm/v
1
5
4
L5
PVL
XDCR9
1
LP603
15.15
mm/v
1
6
5
L6
PVL
XDCR10
1
7
6
L7
PVL
XDCR11
1
8
7
L8
PVL
XDCR12
1
9
8
L9
PVL
XDCR15
1
10
9
L10
PVL
XDCR16
1
11
10
L11
PVL
XDCR18
1
12
11
L12
PVL
XDCR19
1
13
12
L13
PVL
XDCR20
1
14
13
A1
PBP
DC48
1
15
14
A2
PBP
DC49
1
16
15
A3
PBP
DC50
1
17
16
A4
PBP
DC51
1
18
17
A5
PBP
DC52
1
19
18
A6
PBP
DC53
1
20
19
A7
PBP
DC54
1
21
20
A8
PBP
DC56
1
22
21
A9
PBP
DC57
1
23
22
A10
PBP
DC58
1
24
23
A11
PBP
DC59
1
25
24
A12
PBP
DC62
1
26
25
A13
PBP
DC63
1
27
26
A14
PBP
DC35
1
28
27
A15
PBP
DC36
1
29
28
A16
PBP
DC37
1
30
29
A17
PBP
DC38
1
31
30
A18
PBP
DC39
1
Single Wall South Vertical Single Wall Top Horizontal Single Wall Bottom Horizontal Single Wall North Vertical Double Wall West Wall North Vertical Double Wall West Wall South Vertical Double Wall East Wall South Vertical Double Wall East Wall Bottom Horizontal Double Wall West Wall Top Horizontal Double Wall East Wall Top Horizontal Free Field Settlement Double Wall East Wall north Vertical Double Wall West Wall Bottom Horizontal Double Wall East Wall Bottom Horizontal Double Wall West Wall South Vertical Double Wall West Wall North Vertical Double Wall West Wall Top Horizontal Double Wall West Wall Middle Horizontal Single Wall Bottom Horizontal Single Wall Top Horizontal Single Wall North Vertical Single Wall South Vertical Single Wall Middle Horizontal Box Vertical Double Wall West Wall Bottom Horizontal Double Wall East Wall north Vertical Box North East Horizontal Box North West Horizontal Station A North Horizontal Station A Vertical Station A South Horizontal
LP407
10.1
mm/v
1
LP604
15.15
mm/v
1
LP409
10.1
mm/v
1
LP411
10.1
mm/v
1
LP412
10.1
mm/v
1
LP110
2.52
mm/v
1
LP413
10.1
mm/v
1
LP408
10.1
mm/v
1
A4435
9.5
g/v
-1
A4596
9.5
g/v
-1
A3963
9.5
g/v
-1
A5267
9.5
g/v
-1
A5274
9.5
g/v
-1
A3204
9.5
g/v
-1
A4437
9.5
g/v
-1
A3960
9.5
g/v
-1
A3961
9.5
g/v
-1
A3951
9.5
g/v
-1
A3949
9.5
g/v
-1
A3203
9.5
g/v
-1
A3166
9.5
g/v
-1
A3202
9.5
g/v
-1
A3950
9.5
g/v
-1
A5599
-19
g/v
-1
A5604
-19
g/v
-1
A5602
-19
g/v
-1
21
REFERENCES: Woodward-Clyde (1997). “Experimental Results of Maximum and Minimum Dry Densities of Nevada Sand,” Memorandum to the Center for Geotechnical Modeling, University of California, Davis. Gajan, S., Phalen, J.D. and Kutter, B.L. (2003). “Soil-Foundation-Structure Interaction: Shallow Foundations Centrifuge Data Report for SSG02,” University of California, Davis, Center for Geotechnical Modeling, Report No. UCD/CGMDR-03/01. Phalen, J. (2003). “Physical Modeling of the Soil-Foundation Interaction of Spread Footings Subjected to Lateral Cyclic Loading.” Masters Thesis, University of California, Davis, June. Rosebrook, K. (2001). “Moment Loading on Shallow Foundations: Centrifuge Test Data Archives,” Masters Thesis, University of California, Davis. Rosebrook, K.R. and Kutter, B.L. (2001a). “Soil-Foundation-Structure Interaction: Shallow Foundations Centrifuge Data Report for KRR01,” University of California, Davis, Center for Geotechnical Modeling, Report No. UCD/CGMDR-01/09. Rosebrook, K.R. and Kutter, B.L. (2001b). “Soil-Foundation-Structure Interaction: Shallow Foundations Centrifuge Data Report for KRR02,” University of California, Davis, Center for Geotechnical Modeling, Report No. UCD/CGMDR-01/10. Rosebrook, K.R. and Kutter, B.L. (2001c). “Soil-Foundation-Structure Interaction: Shallow Foundations Centrifuge Data Report for KRR03,” University of California, Davis, Center for Geotechnical Modeling, Report No. UCD/CGMDR-01/11.
22
APPENDIX A: Example MathCAD Sheets
23