SOIL SAMPLING INTENSITY AND SPATIAL DISTRIBUTION PATTERN OF SOILS ATTRIBUTES AND CORN YIELD IN NO-TILLAGE SYSTEM MARCOS S. RODRIGUES1, JOSÉ E. CORÁ2, CAROLINA FERNANDES3 ABSTRACT: Taking into account that the sampling intensity of soil attributes is a determining factor for applying of concepts of precision agriculture, this study aims to determine the spatial distribution pattern of soil attributes and corn yield at four soil sampling intensities and verify how sampling intensity affects cause-effect relationship between soil attributes and corn yield. A 100referenced point sample grid was imposed on the experimental site. Thus, each sampling cell encompassed an area of 45 m2 and was composed of five 10-m long crop rows, where referenced points were considered the center of the cell. Samples were taken from at 0 to 0.1 m and 0.1 to 0.2 m depths. Soil chemical attributes and clay content were evaluated. Sampling intensities were established by initial 100-point sampling, resulting data sets of 100; 75; 50 and 25 points. The data were submitted to descriptive statistical and geostatistics analyses. The best sampling intensity to know the spatial distribution pattern was dependent on the soil attribute being studied. The attributes P and K+ content showed higher spatial variability; while the clay content, Ca2+, Mg2+ and base saturation values (V) showed lesser spatial variability. The spatial distribution pattern of clay content and V at the 100-point sampling were the ones which best explained the spatial distribution pattern of corn yield. KEYWORDS: geostatistics, precision agriculture, Zea mays.
INTENSIDADE AMOSTRAL E DEFINIÇÃO DA DISTRIBUIÇÃO ESPACIAL DE ATRIBUTOS DO SOLO E DA PRODUTIVIDADE DE MILHO SOB SEMEADURA DIRETA RESUMO: Tendo em vista ser a intensidade amostral de atributos do solo um fator determinante para a aplicação dos conceitos de agricultura de precisão, este trabalho foi conduzido para determinar o padrão de distribuição espacial de atributos do solo e da produtividade de milho em quatro intensidades de amostragem de solo e verificar a influência da intensidade amostral na compreensão da relação de causa e efeito entre atributos do solo e produtividade. Para isto, utilizou-se uma malha amostral de 100 pontos referenciados, na qual cada célula amostral de 45 m2 era composta por cinco linhas de 10 m da cultura, onde o ponto referenciado foi considerado o centro da célula. As amostras foram realizadas nas profundidades de 0-0,1 e 0,1-0,2 m para avaliar atributos químicos e a textura do solo. A partir dos 100 pontos, obtiveram-se conjuntos de dados com 100; 75; 50 e 25 pontos amostrais. Os dados foram submetidos à análise estatística descritiva e à geoestatística. A melhor intensidade amostral para determinação do padrão de distribuição espacial foi dependente do atributo do solo estudado. Os teores de P e K+ no solo apresentaram maior variabilidade espacial, enquanto os teores de argila, Ca2+, Mg2+ e valores de saturação por base (V) apresentaram menor variabilidade. Os teores de argila e os valores de V, na intensidade amostral com 100 pontos, foram os que melhor se correlacionaram com a produtividade. PALAVRAS-CHAVE: geoestatística, agricultura de precisão, Zea mays.
___________________________________ 1
Doutorando em Agronomia (Produção Vegetal), FCAV/UNESP, Câmpus de Jaboticabal - SP,
[email protected]. Prof. Adjunto, Departamento de Solos, FCAV/UNESP, Câmpus de Jaboticabal - SP,
[email protected]. 3 Profa. Assistente Doutora, Departamento de Solos, FCAV/UNESP, Câmpus de Jaboticabal - SP,
[email protected]. Recebido pelo Conselho Editorial em: 11-4-2011 Aprovado pelo Conselho Editorial em: 3-5-2012 Eng. Agríc., Jaboticabal, v.32, n.5, p.852-865, set./out. 2012 2
Soil sampling intensity and spatial distribution pattern of soils attributes and corn yield in no-tillage system
853
INTRODUCTION One of the determining factors for the practical application of the concepts of precision agriculture (PA) is related to the number of samples necessary to know, with accuracy, the spatial distribution pattern of soil attributes (CORÁ & BERALDO, 2006). However, a large number of samples can raise costs relating to the analysis of soil attributes, thereby undermining the benefits of implementing the concepts of PA (KRAVCHENKO, 2003). The accuracy of the maps of soil attributes is dependent on several factors, but primarily the spatial structure of the analyzed variables (MUELLER et al., 2001), therefore, is dependent on the sampling intensity used to be captured correctly. In this sense, THOMPSON et al. (2004) found that the spatial structure of the soil K+ and P content were changed when the sampling intensity was modified. The authors noted that the sampling intensity of 0.20 samples per hectare the adjusted model for K+ and P was the exponential, reaching values of 485 and 228 m, respectively, whereas for the sample intensity of 0.40 samples per hectare the spherical model was adjusted and the ranges were 301 and 299 m for K+ and P, respectively. The definition of sample intensity might depend on the evaluated attribute, since different soil properties may require different sampling intensities. This happens because some attributes suffer greater change in its spatial distribution pattern than others, mainly due to soil management. For example, the spatial variability of of soil P and K+ content is most affected by soil management in relation to other chemical attributes, mainly due to those fertilizer nutrients contained in the lines seeding. MALLARINO & WITTRY (2004), when studying strategies for more efficient soil sampling approach in eight fields of agricultural production in the U.S., found that for all the strategies investigated, lower efficiency in the samples was for P and K+ as compared with pH and organic matter (OM). In agreement with these results, SOUZA et al. (2006) found that it would be necessary a larger sample size to determine the spatial distribution patterns for P and K+ compared to those required for pH, organic matter and eutroferric Red Latosol clay under cultivation of sugar cane. However, the definition of sampling intensity, based on knowledge of the spatial variability of soil attributes, is not sufficient for the decision making in the planning of crops. It is also necessary to verify that the data related to soil properties, obtained in a given intensity, were correlated with data from crop yield; therefore, to carry out the planning and commercial fields of scientific experiments it is necessary to know both the spatial variability of soil and plant attributes (REICHERT et al., 2008). Based on the foregoing, the hypothesis of this study is that the spatial distribution of soil attributes change with the intensity of soil sampling and consequently affects the understanding of cause and effect relationships between the spatial distribution of crop productivity and the soil properties. Therefore, the study aimed to determine the spatial distribution of soil attributes, using four soil sampling intensity and corn yield, and see how the intensity of soil sampling interfere in understanding the relationship of cause and effect between soil properties and corn yield. MATERIAL AND METHODS The experiment was conducted in Jaboticabal, state of São Paulo (SP), in Brazil (21º14'05''S, 48º17'09''W and altitude of 613 m). Climatologically the area belongs to the tropical zone/megatermal or Köeppen Aw (tropical climate with dry winter and average temperature of the warmest month above 18 ºC). The average annual rainfall is 1,417 mm, with annual distribution concentration in the period from October to March and on the dry period from April to September. The experimental area is classified as Rhodic Hapludox, clayey texture, soft wavy relief, with an average slope of 5%.
Eng. Agríc., Jaboticabal, v.32, n.5, p.852-865, set./out. 2012
Marcos S. Rodrigues, José E. Corá, Carolina Fernandes
854
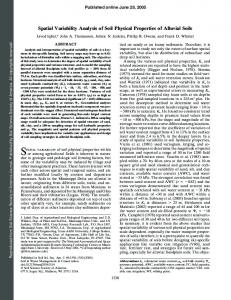
For 10 years, the experimental area has a corn crop in the summer using the no-tillage system and it remains fallow during the winter. Before sowing of the summer crop, a spontaneous vegetation desiccation is performed with non-selective herbicides. In crop year 2007/2008, it was seeded the Syngent triple hybrid Master on 12/05/2007, aiming a density of 65,000 plants ha-1. The recommendations of fertilizers and sowing coverage were based on the results of chemical analysis of soil, according to RAIJ et al. (1997). At the time of sowing, it was applied 30 kg of N, 70 kg of P2O5 and 50 kg of K2O per ha. In coverage, it was applied 100 kg ha-1 of N when the plants presented four to six pairs of fully developed leaves. Fertilization was performed conventionally, i.e., considering the average need of even input application in the area. Data were collected following a sampling grid containing 100 points referenced according to coordinates X and Y. The points were arranged at equidistant intervals, from 10 m in the direction of the rows of the crop (Y coordinate), along with four 250 m-long parallel transects, spaced 4.5 m (X coordinate), forming a rectangle with four columns and 25 rows. The cell sample was composed of five lines of 10 m, totalizing 45 m2 each, considering the point referenced as the center of the cell (Figure 1). 245
0.9 m spacing between the corn rows
0,9 m Espaçamento entre as linhas de milho
225 205 10 m
185
Sample Ponto amostralpoint
2) Sample cell (45m Célula amostral (45 m
Coordinate Y Coordenada Y
165 145
2
)
4,5 m
4.5 m
125 105 85 65 45 25 5 2,25 15.75 15,75 2.25
CoordenadaXX Coordinate
FIGURE 1. Sampling scheme of soil attributes and corn yield in a Rhodic Hapludox under notillage system. The corn harvest was performed 151 days after sowing, using a mechanical harvester of plots, which allows the harvest of a row of corn at a time. Thus, in each cell sample was harvested five lines of 10 m of corn plants, and the mass of grains was considered as the productivity of the cell. The grain moisture was standardized at 13% to estimate the yield (Mg ha-1). After the corn harvest, the soil sampling was performed, using a Dutch auger, in the layers 0 to 0.1 and 0.1 to 0.2 m deep, collecting five soil sub-samples to compose a representative composite sample, one sub-sample collected in the center of the cell (referenced point) and the other in the four cardinal points, spaced 2 m from the midpoint. It was measured the clay content (CAMARGO et al., 1986), pH, P, K+, Ca 2+, Mg2+ and OM in the samples, according to the procedures described Eng. Agríc., Jaboticabal, v.32, n.5, p.852-865, set./out. 2012
Soil sampling intensity and spatial distribution pattern of soils attributes and corn yield in no-tillage system
855
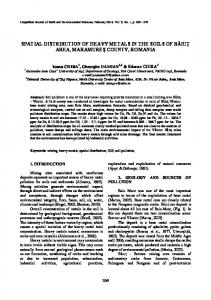
by RAIJ et al. (2001). Then, it was calculated the soil cation exchange capacity (CEC) and percent of soil bases saturation (V). The sampling intensities were established by elimination of intermediate sample points, starting from the highest intensity of the sampling grid, i.e., the sample grid with 100 points spaced 10 meters as Y coordinate and 4.5 meters as X coordinate. Thus, obtaining data sets with 100; 75; 50 and 25 sampling points (Figure 2). Regarding the intensity of 75 points, it was taken points every 40 meters in Y direction, starting with the distance 25 in coordinate Y. Thus forming seven sets of points spaced 20 m apart according to the coordinate Y. In the sample grids of 50 and 25 points, the sampling points were spaced 20 to 40 m in Y direction, respectively (Figure 2). 245
a
b
c
d
225 205 185
Coordinate Y Coordenada Y
165 145 125 105
85 65 45 25 5 2,25 15,75 2.25
15,75 2.25 15,75 2.25 15,75
CoordenadaX X Coordinate
FIGURE 2. Model of sampling distribution for different sampling intensities: a (100 points), b (75 points), c (50 points) and d (25 points). The data set, obtained from each sampling plan, was submitted to descriptive statistical analysis to determine the average, maximum and minimum values, coefficient of variation (C.V.), asymmetry and kurtosis coefficients and data frequency distribution. To test the hypothesis of normality of the data, it was used the SHAPIRO & WILK (1965) test. To estimate the spatial dependence between samples, as well as identify whether the changes were systematic or random, it was used semivariogram models. The selection of models was based on the smallest residual sum of squares (RSS) and better coefficient of determination (R2). The semivariograms were validated by the cross validation method, noting isotropy in all adjusted models, indicating that the pattern of spatial variability structure is the same in all directions. To analyze the degree of spatial dependence it was used the classification of CAMBARDELLA et al. (1994), which considers the strong spatial dependence semivariograms having nugget effect equal to 25% of the sill; moderate spatial dependence when the nugget effect is between 25 and 75% and low spatial dependence when the nugget effect is greater than 75%. Seeking to spatially correlate corn yield and soil attributes, it was estimated the crossed semivariogram. It was used the corn yield as a dependent variable and soil attributes as a covariate. The soil variables were used to estimate the cross semivariogram only when presented simple Eng. Agríc., Jaboticabal, v.32, n.5, p.852-865, set./out. 2012
Marcos S. Rodrigues, José E. Corá, Carolina Fernandes
856
semivariograms, i.e., presented spatial dependence (VIEIRA, 2000). It was selected the cross semivariogram which presented its series of points distributed only in one quadrant, denoting thus a reliable aspect between yield and soil attributes (MEGDA et al., 2008), since the cross semivariogram presenting their number of points in more than one quadrant are considered spatial correlation indefinite (CAMARGO et al., 2008). RESULTS AND DISCUSSION The results show that average values for clay were similar between different sampling intensities (Table 1). Based on the C.V. classification, suggested by PIMENTEL-GOMEZ & GARCIA (2002), we observed a low variability (C.V. < 10%) for clay depths 0 to 0.1 and 0.1 to 0.2 m for all sample intensities studied (Table 1). Similar results were obtained by KITAMURA et al. (2007) to study the variability of attributes of a Rhodic Hapludox under no-tillage system. However, MELLO et al. (2006) found average variability for clay in a Eutroferric red latosol under cultivation of sugar cane. TABLE 1. Results of the descriptive statistics and semivariogram parameters of clay content (g kg-1), from 0 to 0.1 and from 0.1 to 0.2 m depths, for four sampling intensities in a Rhodic Hapludox under no-tillage system. 100 Statistics Average Medium Minimum Maximum C.V. Asymmetry coefficient Kurtosis coefficient P