Published September 26, 2014
Nutrient Management & Soil & Plant Analysis
Soil Testing to Predict Dissolved Reactive Phosphorus Loss in Surface Runoff from Organic Soils Z.M. Zheng
Greenhouse and Processing Crops Research Centre Agriculture and Agri-Food Canada Harrow, ON, N0R 1G0 Canada and School of Environmental Sciences Univ. of Guelph Guelph, ON, N1G 2W1 Canada
T.Q. Zhang*
Greenhouse and Processing Crops Research Centre Agriculture and Agri-Food Canada Harrow, ON, N0R 1G0 Canada
G. Wen
School of Environmental Sciences Univ. of Guelph Guelph, ON, N1G 2W1 Canada and
Greenhouse and Processing Crops Research Centre Agriculture and Agri-Food Canada Harrow, ON, N0R 1G0 Canada
C. Kessel
Ontario Ministry of Agriculture, Food and Rural Affairs Guelph, ON, N1G 4Y2 Canada
C.S. Tan
Greenhouse and Processing Crops Research Centre Agriculture and Agri-Food Canada Harrow, ON, N0R 1G0 Canada
I.P. O’Halloran
Ridgetown Campus Univ. of Guelph Ridgetown, ON, N0P 2C0 Canada
D. K. Reid
Agriculture and Agri-Food Canada Guelph, ON, N1G 4S9 Canada
D. Nemeth
Ontario Ministry of Agriculture, Food and Rural Affairs Vineland, ON, L0R 2E0 Canada
D. Speranzini
Agriculture and Agri-Food Canada Guelph, ON, N1G 4S9 Canada
School of Environmental Sciences University of Guelph Guelph, ON, N1G 2W1 Canada and
Phosphorus loss from surface runoff contributes to eutrophication of surface water, a problem that is often severe from polders with organic soils where agricultural production is intensive. A soil P test is essential to predict the potential for P losses to precisely conduct environmental risk assessment and to efficiently develop and evaluate beneficial management practices. This study evaluated the possibility of using the environmental and agronomic soil P tests, soil P sorption index (PSI), and degree of soil P saturation (DPS), which are used for mineral soils, to predict surface runoff dissolved reactive P (DRP) from organic soils. Forty-four soils from eight subgroups representative of organic lands across Ontario were selected to provide a wide range of soil test P (STP) within each category. A surface runoff study was conducted following the U.S. National Phosphorus Research Project protocol. Flow-weighted mean runoff DRP concentration (DRP30) was linearly related to soil water- and CaCl2–extractable P concentrations but with data distribution patterns that inefficiently represented the soil variability in P release potentials. The runoff DRP30 was significantly related to Bray-1 P and FeO-extractable P concentrations in split-line models, each with a change point, but not to Mehlich-3 P and Olsen P. All DPS values calculated based on STP and their derived PSIs were closely related to runoff DRP30 in either a linear or a split-line model. The DPS values expressed as Bray-1 P/(PSI + Bray-1 P) and FeO P/(PSI + FeO P) showed the highest correlation with runoff DRP30 and thus can be recommended as environmental risk indicators of surface runoff DRP from organic soils. Abbreviations: DPS, degree of soil phosphorus saturation; DRP, dissolved reactive phosphorus; OM, organic matter; PSI, phosphorus sorption index; STP, soil test phosphorus.
O
rganic (muck) soils are dark or black in color, high in organic matter (OM), light in weight, and pulverulent or downy in texture. The profile of an organic soil does not exhibit the horizon differentiation that is typical of a mineral soil. Instead, there are alternate layers of decomposed materials that vary slightly in color, decomposition, and kind of plant remains (Canada Department of Agriculture and Ontario Department of Agriculture, 1962). Muck is developed from drained peatland Soil Sci. Soc. Am. J. 78:1786–1796 doi:10.2136/sssaj2014.02.0065 Received 10 Feb. 2014. *Corresponding author (
[email protected]). © Soil Science Society of America, 5585 Guilford Rd., Madison WI 53711 USA All rights reserved. No part of this periodical may be reproduced or transmitted in any form or by any means, electronic or mechanical, including photocopying, recording, or any information storage and retrieval system, without permission in writing from the publisher. Permission for printing and for reprinting the material contained herein has been obtained by the publisher.
Soil Science Society of America Journal
or marshland through a secondary transformation or mucking process and is typically covered by forest and wetland vegetation until cleared for agricultural cultivation. Organic soils are distributed in almost all counties of Ontario, with farmed organic soils existing in small pockets throughout southern Ontario. The largest muck lands are concentrated in the Lake Simcoe watershed, where five muck polders, including the Keswick, Colbar, Bradford, Deerhurst, and Holland marshes, are being intensively cultivated for horticultural production. Phosphorus, as an essential nutrient for crop production, including high-value horticultural crops, is necessary to maximize the productivity of organic soils because virgin and newly cleared organic soils are inherently low in plant-available P. The consistent addition of fertilizer and manure in excess of crop requirements is conducive to P accumulation in soils, potentially increasing P losses and resulting in eutrophication of surface waters (Sharpley et al., 1996; Sims et al., 2000; Torbert et al., 2002). Losses can be even greater from production-intensive organic soils because the visible seasonal changes in hydrologic and oxidation conditions in muck land promote P transformation and mobilization. The organic P pools in organic soils resulting from long-term sequestration under wetted conditions are unstable under drained conditions due to soil oxidation and organic P mineralization (Sanchez and Porter, 1994). Phosphorus sequestered in inorganic P pools is stable under drained conditions, but it may be unstable on wetting or flooding that can stimulate the release of mineral-bound P in organic soils (McGrath et al., 2001). In general, inorganic P in organic soils can have a higher potential for loss than in mineral soils because noncrystalline or organically bound Al and Fe in soils with high OM contents, such as >49 g kg−1, is less effective for P sorption than in soils with lower OM contents (Kang et al., 2009). Environmental concerns associated with agricultural production on organic soils have been reported (Lake Simcoe Region Conservation Authority, 2009, p. 24–35). Lake Simcoe in Ontario is experiencing significant water eutrophication, resulting in a dramatic decline in native fish species along with increases in algae blooms and aquatic weed growth (Lake Simcoe Region Conservation Authority, 2009, p. 24–35). Excessive P loss has been identified as the most significant cause of water quality impairment in tributaries of the lake, and the muck polders in Lake Simcoe watershed are deemed one of the major pollution sources, delivering an average of 3100 kg P per hydrologic year through leaching, surface runoff, and wind erosion (Lake Simcoe Region Conservation Authority, 2009, p. 24–35). Similarly, a recent nutrient survey of Elba organic soils in New York indicated that 25% of the fields had excessive P levels and that Elba muck land was one of eight major sources of pollution in Oak Orchard watershed, delivering total P concentrations of 5 to 12 mg L−1, with 1 to 2 mg L−1 as dissolved reactive P (DRP), a P form that is immediately available to aquatic biota (Hoepting, 2009). An earlier separate study indicated that muck land representing 27% of the Oak Orchard watershed contributed 20,000 kg DRP per hydrologic year during the 1980s, accounting for 55 to 86% of www.soils.org/publications/sssaj
the annual DRP load (Longabucco and Rafferty, 1989). The extensive P export from Histosols in the Everglades Agricultural Area (EAA) in Florida has been implicated in causing deterioration of water quality and alteration of the natural ecosystems of Everglades wetlands. As a result, the cultivated organic soils in EAA are being converted to their historic use as pasture or seasonally flooded prairie as part of restoration efforts (Wright, 2009). The upsetting of watershed ecosystems by P release from organic soils indicates that application of fertilizer P has to be optimized by having organic soils tested regularly to maximize crop production profitability in an environmentally sustainable manner. To this end, agronomic and environmental soil P tests applicable to organic soils are essential. In mineral soils, surface runoff has often been deemed to be the major pathway of soil P loss (Pote et al., 1999), given that P compounds in soils are sparingly soluble and strongly adsorbed to soil particles. An understanding of the relationship between P loss and P concentration in soils is crucial to mitigate P loss from soils. A number of soil P tests initially designed for agronomic purposes and specifically for environmental risk assessment have been used to estimate runoff DRP. Studies showed that runoff DRP concentration was related to soil P measures in either a linear or quadratic manner (Breeuwsma and Silva, 1992; Sharpley 1993; Sims et al., 2000). In many cases, this was a split-line relationship consisting of two segmental linear functions that intersect at a change point, above which the functional slope is significantly higher than that below it (McDowell and Sharpley, 2001; Allen et al., 2006; Wang et al., 2010). However, all of these relationships were derived from mineral soils, while relationships between runoff DRP and soil test P have rarely been reported for organic soils (Bond et al., 2006). In addition, it is ideal that the test used for indication of agronomic P availability in soils is also applicable to environmental assessment (Moody, 2011). For example, Mehlich-3 P is widely used as an agronomic soil P test and an environmental indicator of soil P loss in the Mid-Atlantic United States (Sims et al., 2002). This expectation, however, is not always satisfied because the optimum agronomic soil P tests may not predict P losses very well, and vice versa. For example, Bray-1 P, the primary agronomic soil P test used in the Minnesota River basin, was found to be less accurate for predicting runoff DRP loss than Mehlich-3 P and Olsen P (Fang et al., 2002). The Olsen soil P test has been recommended and widely used as an agronomic soil P test in Ontario; however, previous studies showed that it was less effective and accurate than FeO-coated filter paper strip extractable P (FeO-extractable P), water-extractable P (WEP), Mehlich-3 P, Bray-1 P, and the degree of P saturation (DPS) determined by Mehlich-3 extractable P, Al, and/or Fe for predicting DRP in surface runoff from mineral soils in Ontario (Wang et al., 2010). We speculated that a soil P test designed for mineral soils is not necessarily applicable in organic soils. Given the nature of most soil- or site-specific soil P tests for mineral soils, the observed correlation between soil test P (STP) and soil P loss from mineral soils is not necessarily true for organic soils. It is essential to assess the suitability and effectiveness of the routine 1787
agronomic and environmental soil P tests derived from mineral soils before they are adopted as environmental tools for organic soils to protect water quality. Unfortunately, such evaluation has not been reported, although some routine soil P tests are being adopted for agronomic calibrations in organic soils (Castillo and Wright, 2008; Wright, 2009). The overarching objective of this study was, therefore, to evaluate the suitability and effectiveness of the agronomic and environmental soil P tests designed for mineral soils as environmental risk indicators of runoff DRP loss from organic soils in Ontario.
Materials and Methods
Soil Collection, Sampling, and Preparation A total of 44 sites varying in chemical and physical properties was selected from organic (muck) lands across the province, with major focus on the Lake Simcoe and Lake Erie watersheds, the predominate areas of organic soils with water quality concerns. Before sampling, the existing soil test data from farmers, researchers, and extension professionals were used to select sampling sites that provided a wide range of STP levels. For each site, a bulk soil sample of approximate 100 kg was collected from the 0- to 20-cm depth in the fall of 2010 and spring of 2011 before fertilization and planting. All collected bulk organic soils were air dried and passed through a 13-mm sieve after careful removal of crop residues and other non-soil materials. After thoroughly mixing with care, one subsample of about 1.5 kg was taken from each bulk soil and ground to pass a 2-mm sieve for determination of soil properties and various soil test P values. A 30-g sub-subsample was further ground to pass a 0.15-mm (no. 100) sieve for determination of total P. The remaining bulk soils were stored for the runoff box study.
Determination of Soil Physical and Chemical Properties Soil pH was measured by an electrode after shaking 10 g of soil in 10 mL of distilled water (Thomas, 1996). Soil OM was determined using the dry combustion method with an Isotemp Programmable Muffle Furnace 750 (Fisher Scientific) (Karam, 1993). Field soil bulk density was measured by the core method (Culley, 1993). Particle size distribution was determined by using a modified sieve–sedimentation method (Kettler et al., 2001). Briefly, 10.0 g of a £2-mm organic soil was weighed into a 250-mL Erlenmeyer flask and 40 mL of double-distilled water was added. A sufficient amount of H2O2 was then cautiously and repeatedly added to remove the OM. After all OM was removed and the remaining H2O2 destroyed by gently heating the sample, 4.50 g of sodium hexametaphosphate was added as a particle disperser. The soil sample was shaken for 2 h on a reciprocating shaker at 120 oscillations per minute. After dispersion, the soil slurry was sieved through a 0.053-mm (no. 270) sieve to separate the sand particles. The remaining solution was collected in a bucket, transferred to a 1-L beaker, agitated vigorously, and allowed to settle for at least 90 min but not more than 6 h. The silt particles were then allowed to settle to the bottom, and the 1788
suspension containing suspended clay particles was decanted to a preweighed beaker, dried at 105°C to a constant weight, and then weighed. The particle size distribution was expressed as grams of sand, silt or clay per kilogram of whole organic soil rather than on the basis of mineral weight in order to precisely reflect the effects of the particle size distribution on the relationships between the DRP and STP values. The soil P was analyzed as (i) WEP (Self-Davis et al., 2000); (ii) 0.01 mol L−1 CaCl2 extractable P (CaCl2 P, Self-Davis et al., 2000); (iii) Olsen P, with addition of activated charcoal (Darco G60) for decoloration (Sims, 2000a); (iv) Bray-1 P (Sims, 2000b); (v) FeO-extractable P (1:40 of soil/0.01 mol L−1 CaCl2 ratio + FeO-impregnated filter paper strip, 16-h reaction time, followed by dissolving P from the filter paper strip for 1 h in 1 mol L−1 H2SO4) (Chardon, 2000); (vi) Mehlich-3 extractable P, Al, Fe, Ca, and Mg (Sims, 2000c); and (vii) total soil P with concentrated H2SO4 and H2O2 digestion (Bowman, 1988). Phosphorus concentration in all extracts or digestions was determined colorimetrically by the molybdate blue method using a Lachat flow injection autoanalyzer (QuikChem FIA + 8000 series, Lachat Instruments). Iron, Al, Ca, and Mg were determined using an atomic adsorption spectrometer (PerkinElmer AAnalyst 400). A soil P sorption index (PSI) (Sims, 2000d) was used as an estimation of soil P sorption capacity (Bache and Williams, 1971). A 1.0-g dry soil sample was weighed into a 50-mL centrifuge tube and 20 mL of solution containing 75 mg P L−1 in double-distilled water was added. The suspension was shaken for 18 h at room temperature using an end-to-end shaker. The samples were then centrifuged and filtered through a 0.45-mm filter. The PSI (L kg−1) was calculated as
PSI =
X log C
[1]
where X is the P sorbed (mg P kg−1) and C is the P concentration at equilibrium (mg L−1). The various DPS surrogates were calculated based on the extracted P, Al, Fe, Ca, and Mg contents (mg kg−1 soil):
DPS1 =
Mehlich-3 P Mehlich-3 Al + Fe
[2]
DPS 2 =
Mehlich-3 P Mehlich-3 Ca
[3]
DPS 3 =
Mehlich-3 P Mehlich-3 Mg
[4]
DPS 4 =
Mehlich-3 P Mehlich-3 Ca + Mg
[5]
DPS 5 =
Mehlich-3 P Mehlich-3 Al + Fe + Ca + Mg
[6]
Soil Science Society of America Journal
DPS 6 =
Mehlich-3 P PSI
[7]
DPS 7 =
Mehlich-3 P Mehlich-3 P + PSI
[8]
DPS8 =
Olsen P PSI
[9]
DPS 9 =
Olsen P Olsen P + PSI
[10]
DPS10 =
Bray-1 P PSI
[11]
DPS11 =
Bray-1 P Bray-1 P + PSI
[12]
DPS12 =
FeO-extractable P PSI
[13]
DPS13 =
FeO-extractable P FeO-extractable P + PSI
[14]
the degree of increase varies depending on the OM content. To achieve a 5-cm depth in the runoff boxes after saturation corresponding to the field bulk density, an inflation test was conducted before the runoff study to determine the inflation coefficient of each soil, and the amount of soil required was based on that. Soils were wetted by capillarity for 24 h by establishing a water table 1.0 cm below the surface of the soil in the box. Saturated soils were covered with a plastic sheet and left to drain for 24 h until field capacity was achieved. The box was then placed at a 5% slope below a rainfall simulator nozzle (TeeJet 1/2 HH SS 50 WSQ, Spraying Systems Co.). Simulated rainfall was applied at an intensity of 75 mm h−1 (produced at 28 kPa, 3.15 m above the center of the runoff slope), calibrated to achieve 90% uniformity. Surface runoff was collected at the lower end of runoff box in discrete 5-min intervals for 30 min. The runoff volume was recorded, and a 250-mL water sample was taken after thorough mixing. There were four replications (boxes) for each organic soil. A 60-mL aliquot of each runoff water sample was filtered through a 0.45-mm filter. The filtered water samples were analyzed for DRP within 12 h of collection. The determination of P in water was performed using a flow injection autoanalyzer (QuikChem FIA + 8000 series, Lachat Instruments) with the ammonium molybdate–ascorbic acid reduction method of Murphy and Riley (1962).
Data Analysis Surface Runoff Box Study The surface runoff box study was conducted following the modified U.S. National Phosphorus Research Project protocol (National Phosphorus Research Project, 2001). Although packed boxes are least representative of field conditions in terms of hydrology, soil surface, and the variability of soil physical and chemical characteristics, runoff box studies can give a reasonable estimation of P loss in surface runoff produced under field conditions (Kleinman et al., 2004; Guidry et al., 2006; Wang et al., 2010). Each runoff box was 100 cm long by 20 cm wide by 7.5 cm deep and had nine drainage holes (5-mm diameter) in the bottom: three in the middle and three 5 cm away from each end. This nine-hole runoff box initially designed for mineral soils was found to be not entirely suitable for a runoff study of organic soils because the downward movement of water was much faster than in mineral soils. To mitigate the direct loss of rainfall water through the holes, three holes at the end of the water collection gutter of the bottom and two in the middle were blocked to simulate the local field surface runoff, which mainly occurs during the snowmelt period in the spring. During that period, there is normally a frozen layer within 15 cm of the soil surface, so minimal water can penetrate (Ball-Coelho et al., 2012). A porous nylon membrane was used to cover the remaining open holes at the bottom of the box before the addition of the 13-mm sieved dry soil. After saturation with water, the volume of an organic soil can increase, and www.soils.org/publications/sssaj
The flow-weighted means of the DRP concentrations of runoff water collected during the 30-min period (DRP30) were used to evaluate the relationships between runoff P and STP or DPS. The DRP30 was calculated as
DRP30
∑ =
6 j =1
DRP j ×V j
∑
6
Vj j =1
[15]
where DRPj (j = 1, 2, …, 6) represents the DRP concentrations of runoff water collected in 0 to 5, 5 to 10, 10 to 15, 15 to 20, 20 to 25, and 25 to 30 min, respectively; and Vj (j = 1, 2, …, 6) represents the volume of runoff water collected in 0 to 5, 5 to 10, 10 to 15, 15 to 20, 20 to 25, and 25 to 30 min, respectively. All statistical analyses were conducted using SAS (SAS Institute, 2002). Analysis of linear and quadratic regressions was performed with the REG procedure. Appropriate regression equations were selected based on the criteria of best fit. The collinearity among STP and soil properties, such as pH and OM and clay contents, was tested, with the condition index and variance inflation factor selected as criteria. If collinearity was present, multiple regressions were then performed by integrating pH and OM and clay contents into a regression model with STEPWISE model selection. A split-line model described by McDowell and Sharpley (2001) was used to determine the change point for the relationship between runoff DRP30 and STP or DPS by running the NLIN procedure. The four param1789
Results and Discussion
eters defining the split lines were selected based on the criteria of best fit under prevalued boundary conditions. In the multiple equations presented, all variables contributed significantly at the 0.05 probability level. Given the coefficient of determination (r2) of a best-fit model as the proper indicator of relation strength, it was considered as a key criterion to determine if one STP or DPS surrogate was better than another to assess the environmental risk of P runoff loss from organic soils. Linear coefficients (slopes) of relationships between runoff DRP30 and the concentrations of various STPs or DPS measurements were compared using a series of contrast statements in the GLM procedure of SAS. Along with the criteria of the coefficient of determination (r2) of a bestfit model, the suitability of the STP or DPS, if its calculation was derived from an agronomic STP, was adopted as a secondary criterion for selection of an environmental soil P test, as it is desirable in practice that any assessment of environmental risk uses the same soil test as for agronomic calibration to be economically efficient (Moody, 2011).
Soil Characteristics
The 44 soils collected to represent muck lands across Ontario had a wide range of physical and chemical properties (Table 1). The depth of organic horizons ranged from 16 to >200 cm, bulk densities from 0.21 to 0.79 g cm−3, and OM contents from 111 to 813 g kg−1. The pH ranged from 5.7 to 8.1, with 80% of the soils in the neutral or slightly acidic range. The distribution of mineral particles, presented on the basis of the entire bulk soil, ranged from 116 to 707 g kg−1 sand, 59 to 336 g kg−1 silt, and 11 to 155 g kg−1 clay. The STPs varied widely, ranging from 3.70 to 148 mg kg−1 for WEP, from 9.50 to 123 mg kg−1 for CaCl2 P, from 65.4 to 333 mg kg−1 for Olsen P, from 15.2 to 413 mg kg−1 for Bray-1 P, from 43.7 to 584 mg kg−1 for FeO-extractable P, and from 126 to 973 mg kg−1 for Mehlich-3 P. Soil total P ranged from 913 to 6180 mg kg−1. The wide ranges of STPs and total P indicate that the soils selected reasonably covered a suitable range to determine an environmental soil P test method. A survey of the Elba
Table 1. Selected physical and chemical properties of the 44 organic soils used for simulated rainfall–surface runoff study. Soil series Humic Mesisol
Depth of Bulk Measure organics density cm >200
Limnic Mesisol Rego Gleysol, peaty phase
>180 16–34
Terric Humic Mesisol
75–130
Terric Humisol
46–135
Terric Mesisol
80–137
Typic Mesisol
>180
Disturbed soil
NA¶
pH
mean max. min. SD mean max. min. SD mean max. min. SD mean max. min. SD mean max. min. SD
g cm−3 0.26 0.32 0.21 0.06 0.40 0.48 0.58 0.37 0.08 0.39 0.39 0.39 0.00 0.42 0.54 0.28 0.07 0.37 0.41 0.28 0.08 0.30 0.31 0.29 0.01
6.8 7.3 5.8 0.8 5.7 7.0 7.6 5.9 0.5 6.7 7.0 6.4 0.4 7.1 7.8 5.9 0.6 7.0 8.1 6.5 0.7 6.7 7.1 6.5 0.3
mean max. min. SD
0.75 0.79 0.70 0.05
7.4 7.6 7.1 0.2
mean max. min. SD
Organic Sand matter
Silt
Clay WEP†
————– g kg−1 ————– 623 190 147 40.1 728 233 172 55.2 548 155 101 16.3 94.0 39.8 40.6 20.8 380 469 122 29.7 473 273 179 74.3 683 632 290 155 141 185 96.6 21.5 164 131 60.3 41.2 617 181 160 41.7 664 213 170 46.4 570 149 149 36.9 66.7 45.2 14.8 6.7 608 225 113 53.5 813 383 170 95.0 493 116 58.8 11.2 113 79.9 35.1 26.5 611 202 141 46.2 732 309 237 104 402 123 104 16.1 132 72.9 48.2 30.9 696 171 110 23.2 715 186 119 26.5 669 162 105 17.1 24.3 12.8 8.00 5.3 191 272 111 65.7
443 707 320 178
251 336 103 107
114 152 78.2 30.1
CaCl2 P‡
Olsen P
Bray-1 P
FeO P§
Mehlich-3 P
Total P
—————————– mg kg−1 ——————————– 54.9 48.7 210 181 307 425 2810 148 123 320 413 584 692 4440 7.40 11.1 142 39.6 166 252 1880 80.4 64.6 96.3 202 239 235 1420 29.0 16.7 103 117 241 175 1050 12.1 13.0 173 127 201 330 2390 39.1 28.2 264 184 309 520 3690 4.30 9.50 99.4 76.7 87.8 193 1590 10.8 5.40 58.0 42.3 85.3 117 829 13.7 12.3 122 91.7 156 242 1960 17.4 12.9 123 123 171 259 2260 9.90 11.8 122 60.1 141 226 1660 5.30 0.70 0.40 44.7 21.2 23.3 425 17.8 17.4 154 102 208 315 2390 66.4 50.7 219 203 420 459 3410 3.70 9.50 73.6 47.0 95.4 126 1310 20.1 13.0 41.8 46.4 96.1 101 645 14.7 14.2 161 108 214 369 2540 27.2 21.1 333 159 313 973 6180 4.90 10.1 88.4 50.3 107 170 1470 7.90 4.30 90.1 42.2 73.5 301 1810 35.0 31.0 192 205 295 524 2600 55.3 49.7 253 313 419 728 3360 10.8 13.4 159 132 210 400 2110 22.5 9.00 11.9 6.60 2.30
18.1 10.1 10.5 9.50 0.40
53.3 96.0 137 65.4 30.4
95.6 77.2 115 15.2 45.3
110 97.8 150 43.7 44.2
178 272 420 129 121
674 1460 2160 913 531
† Water-extractable P. ‡ 0.01 mol L−1 CaCl2–extractable P. § FeO-impregnated filter paper extractable P. ¶ NA, not applicable.
1790
Soil Science Society of America Journal
muck soils in New York also showed a wide range of Mehlich-3 P values, from 15 to 575 kg ha−1 (Hoepting, 2009), but at lower levels than most of the soils in Ontario. In addition, the organic soils had much higher STP levels than mineral soils in Ontario, as reported by Wang et al. (2010).
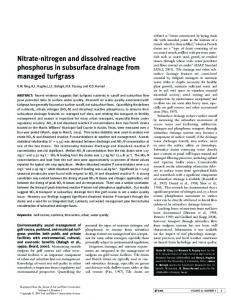
Relationship between Surface Runoff FlowWeighted Mean Dissolved Reactive Phosphorus and Soil Test Phosphorus The flow-weighted means of runoff DRP30 ranged widely from 0.019 to 5.130 mg L−1, with an average of 0.588 mg L−1, echoing the wide ranges in soil physical and chemical properties, especially STP (Table 1). The observations were consistent with Wortmann and Walters (2006) and Wang et al. (2010), who reported that STP accounted for 60 to 90% of the variation in runoff DRP. The DRP30 values were mostly above the upper limit of 0.1 mg total P for protecting the water quality of streams, as suggested by the USEPA (1986), indicating the potentially severe environmental consequences of agricultural production in organic soils. Over-limit DRP levels in runoff water were also observed in muck land from Oak Orchard watershed, New York, and in Histosols of the Everglades Agricultural Area, Florida (Hoepting, 2009; Wright, 2009). Numerous studies have reported the beneficial effect of OM on the bioavailability of P for plants and microorganisms (Giesler et al., 2005; Guppy et al., 2005; Gjettermann et al., 2007). In principle, these effects seem to involve different and complementary mechanisms. Among those related to P, mineralization of organic
P, competition for sorption sites with dissolved OM, and dissolution of Fe(III)-bound P play important roles in increasing P levels in the soil solution and runoff water (Morris, 2011). The beneficial effect on P availability and concurrently on P mobilization can increase the proportion of labile P in OM-enriched soils. This may explain the observation that DRP loss was much greater in runoff from organic soils than from the mineral soils. Of the six soil P tests evaluated in this study, the water, 0.01 mol L−1 CaC12 and FeO-impregnated filter paper strip extractions were initially designed for environmental risk assessment, while Olsen, Bray-1, and Mehlich-3 extractions were for agronomic indication of soil P. Our data showed that runoff DRP30 concentrations were strongly related to WEP (r2 = 0.86, p < 0.001) and CaCl2 P (r2 = 0.85, p < 0.001) (Fig. 1A and 1B), which was in agreement with those reported by Pote et al. (1999), Penn et al. (2006), and Wang et al. (2010). This was probably due to the analogous chemical behavior of water and dilute salt extractants with the simulated rainfall water (Penn et al., 2006; Wang et al., 2010). However, the majority of the data points appeared clustered within a narrower range of concentration, relative to other determinations, which are discussed below, indicating the limitation of the two methods for differentiating the potential for P release in different organic soils. The FeO-extractable P was significantly related to the runoff DRP30 concentration, and the relationship was best approximated by a split-line model, which accounted for 71% of the overall variation in DRP30 (Fig. 1D). A change point was observed at 233.8 mg FeO P kg−1, above which the increasing rate of runoff DRP30 concentration was 12 times that below. The split-line rela-
Fig. 1. Relationships between flow-weighted mean of dissolved reactive P concentrations in surface runoff collected for 30 min (DRP30) and soil test P, including (A) water-extractable P (WEP), (B) 0.01 mol L−1 CaCl2–extractable P (CaCl2–P), (C) Bray-1 P, and (D) FeO-impregnated filter paper strip extractable P (FeO P). ***Significant at p £ 0.001.
www.soils.org/publications/sssaj
1791
tionship between runoff DRP and FeO P has often been reported in mineral soils but with lower values, such as 42.6 mg FeO P kg−1 by Maguire and Sims (2002) and 45.3 mg FeO P kg−1 by Wang et al. (2010). Our change point value of FeO P in organic soils was about five times greater than those reported for mineral soils, probably due to the largely increased capacity for P retention through organic cation (such as Ca and Fe) complexation. In spite of a smaller coefficient of determination (r2) for DRP relative to WEP and CaCl2 P, FeO P showed a greater capability to distinguish the release potential of P in organic soils, as evidenced by data points that were distributed evenly within the range of values determined. In addition, FeO P has the potential also to be an indicator of plant-available P in organic soils (Zhang et al., 2012). Of the three agronomic soil P tests evaluated, the Olsen method is currently recommended for agronomic P calibration in mineral soils, as well as a default soil P test in organic soils, in Ontario. Our previous studies indicated that Olsen P was related to runoff DRP in mineral soils, although with a r2 value lower than others, including Mehlich-3 P, Bray-1 P, WEP, and FeO-extractable P (Wang et al., 2010). However, neither Olsen P nor Mehlich-3 P (p > 0.05) was related to the runoff DRP30 concentration in the organic soils (data not shown). The Olsen test is a soil measure that is most suitable to indicate plant P availability in calcareous soils. The pH values of the organic soils in this study, however, fell mostly into the neutral or slightly acidic range, leaving only six soils that had pH > 7.5. In addition, the alkali-soluble nature of enriched humified materials, such as humic acids, in organic soils might have decreased the capability of the alkaline Olsen solution to extract P, so that Olsen P can’t be a sensitive and accurate indicator of DRP in runoff water. The Bray-1 P was significantly (r2 = 0.69, p < 0.001) related to the runoff DRP30 concentration in a split-line model, with a change point of 114.8 mg kg−1 (Fig. 1C). Although having comparable pH values (pH » 3.0), the variation in the acidic components in the two extraction matrices of Bray-1 and Mehlich-3 greatly affects their performance in P extractability with organic soils. The molarity of the acidity of the Mehlich-3 extract is about 10 times of that of the Bray-1 extract and could have a profound effect on the dissolution of OM and extraction of calcium phosphates from organic soils. Our observations indicate that of the three agronomic soil P tests, only Bray-1 could be an index predicting runoff DRP. This underscores the importance and necessity of validating routine soil P tests for their accuracy and effectiveness as indicators of runoff DRP in organic soils.
voted to find a soil P test applicable to a wide range of soils in a given region by including other soil properties and/or site hydrologic characteristics in the test (Torbert et al., 2002; Schroeder et al., 2004; Penn et al., 2006). Soil pH influences soil P chemistry, including the relative concentrations of soil P compounds, soil P solubility, and soil P sorption capacity. It was often integrated into exploration of the relationship between DRP and STP. Torbert et al. (2002) advocated grouping soils by chemical characteristics (i.e., calcareous vs. non-calcareous) to allow the development of significant predictive equations relating runoff DRP concentration to soil P levels. Turner et al. (2004) indicated that soil pH partially accounts for differences in DRP concentrations in runoff from mineral soils with similar extractable P concentrations. Penn et al. (2006) observed that, among measures of WEP, Mehlich-1 P, Mehlich-3 P, FeO-extractable P, and DPS determined by Mehlich-3 extractable P, Al, and/or Fe, WEP provided the most consistent predictions of DRP concentrations in surface runoff from nine Virginia mineral soils, particularly when soil clay content was incorporated into the equation. Previous studies conducted in Ontario, Canada, indicated that the relationships between DRP and STP could be enhanced in mineral soils by including pH, soil C, and/or clay content into stepwise regressions (Wang et al., 2010). To ascertain the impacts of soil properties other than STP on the relationship, a collinearity analysis of STP and soil properties was performed, and multiple regression analyses of runoff DRP30 concentration against STP, pH, and OM and clay contents were conducted. It was shown that OM content significantly contributed to the regressions of runoff DRP30 against WEP or FeO-extractable P, while pH contributed to the relationship between runoff DRP30 and Olsen P, FeO P, and Mehlich-3 P. The contribution of pH outweighed Olsen P and Mehlich-3 P as the first regressor in the multiple regressions (Table 2), with partial r2 = 0.31, 0.20, and 0.23 for pH, Olsen P, and Mehlich-3 P, respectively. Interestingly, integrating clay content, pH, and OM into the relationship between runoff DRP30 and FeO P reduced the strength of the resultant multiple regression (R2 = Table 2. Multiple regression analyses for prediction of the flow-weighted mean of dissolved reactive P concentrations in surface runoff collected for 30 min (DRP30, mg L−1) by each of six P soil tests (mg kg−1), including water-extractable P (WEP), 0.01 mol L−1 CaCl2 extractable P (CaCl2 P), Olsen P, Bray-1 P, Mehlich-3 P, and FeO-impregnated filter paper strip extractable P (FeO P), and soil characterization factors of pH, organic matter content (OM, g kg−1) and clay content (g kg−1). Regression
Effects of Soil Characteristics on the Relationships between Runoff Flow-Weighted Mean Dissolved Reactive Phosphorus and Soil Test Phosphorus Numerous studies from mineral soils have shown that the relationship between runoff DRP concentration and STP or DPS is soil and site specific (Sharpley, 1995; Cox and Hendricks, 2000; Schroeder et al., 2004; Davis et al., 2005; Wang et al., 2010). It is impractical to have an environmental soil P test for each soil series. Alternatively, considerable efforts have been de1792
r2
DRP30 = 0.0359 WEP + 0.0006 OM − 0.4183 DRP30 = 0.0462 CaCl2 P − 0.0031 Clay − 0.0722
0.88*** 0.87***
DRP30 = −0.7214 pH + 0.0075 Olsen P − 0.0069 Clay + 4.8529
0.56***
DRP30 = 0.0104 Bray-1 P − 0.0078 Clay − 0.2095
0.71***
DRP30 = 0.0065 FeO P − 0.0068 Clay − 0.2475 pH − 0.0008 OM + 1.7865
0.65***
DRP30 = −0.7457 pH + 0.0030 Mehlich-3 P − 0.0071 Clay + 5.2076
0.59***
*** Significant at p £ 0.001.
Soil Science Society of America Journal
0.65) from that of the simple split-line model (r2 = 0.71). This is because, rather than chemical extraction, the FeO-impregnated filter paper strip is an ion sink extraction developed to simulate plant roots extracting P from the soil, regardless of soil properties (Menon et al., 1996; Zheng and Zhang, 2012). Arbitrarily enforcing soil characteristics into the regression would be expected to alleviate the accuracy of FeO P as an environmental predictor of runoff DRP in organic soils. Even though the clay content (48.9 g kg−1 averaged across 44 organic soils selected) was very low relative to its content in mineral soils, the contribution of clay particles to the relationships between runoff DRP30 and STP concentrations was significant for all the STP values except for WEP (Table 2). The results affirmed the assumption that soil properties beyond STP may influence the relationship between runoff DRP and STP (Davis et al., 2005; Penn et al., 2006, Wang et al., 2010), presumably through influencing P sorption and mobilization in organic soils, which are reflected in the concentrations of both runoff DRP and STP.
Relationships between Surface Runoff FlowWeighted Mean Dissolved Reactive Phosphorus and Degree of Phosphorus Saturation The linear and nonlinear relationships between the flowweighted mean of runoff DRP30 concentration and the DPS measurements are shown in Fig. 2 and 3. The DPS calculated based on Mehlich-3 extractable P, Al, and Fe (Mehlich-3 P/ Mehlich-3 Al or Mehlich-3 P/(Mehlich-3 Al + Fe) has been
widely recommended for agro-environmental P testing for mineral soils (Khiari et al., 2000; Sims et al., 2002; Wang et al., 2010). However, this robust approach did not prove to be a suitable risk indicator for organic soils in the present study (p > 0.05). The Mehlich-3 P, Al, and Fe concentrations averaged across all the organic soils in our study were 338, 97, and 274 mg kg−1, respectively, resulting in 37 of 44 tested soils’ ratios of Mehlich-3 P/Mehlich-3 Al and 22 of 44 soils’ ratios of Mehlich-3 P/(Mehlich-3 Al + Fe) >1.0, indicating the unsuitability of the two DPS surrogates based on its definition (DPS £ 1.0). A significant (r2 = 0.38, p < 0.01) quadratic relationship between runoff DRP30 and DPS estimated by Mehlich-3 P/Mehlich-3 Ca, Mehlich-3 P/(Mehlich-3 Ca + Mg), and Mehlich-3 P/(Mehlich-3 Al + Fe + Ca + Mg) was observed (data not shown), but all with r2 values