Research Article
Turk J Agric For 35 (2011) 95-102 © TÜBİTAK doi:10.3906/tar-0911-30
Soil texture fractions and fractal dimension of particle size distribution as predictors of interrill erodibility
Mohammad Reza NEYSHABOURI1, Abbas AHMADI1,*, Hassan ROUHIPOUR2, Hossein ASADI3, Mehdi IRANNAJAD4 1Department of Soil Science, Faculty of Agriculture, Tabriz University, Tabriz - IRAN 2Research Institute of Forests and Rangelands, Tehran - IRAN 3Department of Soil Science, Faculty of Agriculture, University of Guilan, Rasht - IRAN 4Department of Mining & Metallurgical Engineering, Amirkabir University of Technology, Tehran - IRAN
Received: 05.11.2009
Abstract: Choosing a particular textural fraction as an erodibility predictor is often confusing because various fractions of soil particles have been introduced as erodibility index by many researchers. Recently, advances in fractal theory have introduced a scaling parameter for characterizing soil fragments. The objectives of this study were (i) to test the applicability of fractal dimension of particle size distribution (PSD) for estimation of interrill erodibility and (ii) to study the relationship between interrill erodibility and soil texture components. Samples from 36 soil series with contrasting characters were collected from northwest Iran. The sand fractions were obtained by sieving, while silt and clay fractions were determined by hydrometer. Fractal dimension (DB) of PSD was estimated. A rainfall simulator with drainable tilting 2 -1 flume (1 × 0.5 m ) at a slope of 9% was used and interrill erodibility (Ki) was calculated for 20, 37, and 47 mm h rainfall intensities. The results showed a positive correlation between Ki and clay content. The degree of dependence of Ki to soil texture fractions (sand, silt, and clay contents) was greatly affected by the rainfall intensity level. Using either texture fractions (sand, silt, very fine sand and sand) or DB did not affect the accuracy of the Ki- predicting models. As use of fractal dimension could follow the principles of uniqueness, fractal dimension of PSD may be applied as an alternative of texture fractions for prediction of interrill erodibility. Key words: Erosion predictor, fractal dimension, interrill erodibility, soil texture
Introduction Soil texture is an important character contributing to soil erodibility. Soils high in silt and very fine sand (USDA classification system of particles), or expanding clay minerals tend to have high erodibility. Erodibility is low for clay-rich soils with a low shrink-
swell capacity, as clay particles mass together into larger aggregates that resist detachment and transportation (ÓGeen et al. 2006). Aba Idah et al. (2008) stated that sandy soils have low cohesive force and are more prone to detachment and transportation by water and wind. Wischmeier and Smith (1978)
* E-mail:
[email protected]
95
Soil texture fractions and fractal dimension of particle size distribution as predictors of interrill erodibility
used sand and silt fractions as indices for estimation of soil erodibility factor in the USLE model. Duiker et al. (2001) in their erosion test found that average soil loss is negatively correlated with clay content but positively correlated with very fine sand and silt+very fine sand contents. They concluded that very fine sand content alone is not the best predictor of interrill erodibility. Flanagan and Nearing (1995) introduced clay fraction as a predictor to estimate the interrill erodibility of cropland soils containing less than 30% sand. They also introduced very fine sand fraction as a predictor to estimate the interrill erodibility of cropland soils containing 30% or more sand. León (2005) proposed very fine sand besides silt content as suitable variables for the interrill erodibility estimation. Obi et al. (1989) found that erosion was well predicted by sand percentage with a negative relationship. Choosing of a particular texture fraction as an erodibility predictor, however, is often confusing because various fractions of soil have been introduced as an erodibility index by various researchers. A good index used to describe soil erodibility should follow the principles of uniqueness and applicability. Recently advances in fractal theory have introduced a scaling parameter for characterizing soil fragments. This scaling parameter is called fractal dimension and its value depends on the shape of individual objects within the distribution. Fractal dimensions are characterized by a power-law relation between the mass or number and size of objects. The fractal dimension of particle size distribution (PSD) has been significantly correlated with soil texture fractions by many researchers (e.g. Huang and Zhan 2002; Millan et al. 2003; Su et al. 2004). Fractal theory offers the possibility of quantifying and integrating information about biological, chemical, and physical phenomena in soil (Perfect and Kay 1995; Anderson et al. 1998). The objectives of this study were (i) to test the applicability of fractal dimension of PSD for estimation of interrill erodibility and (ii) to study the relationship between interrill erodibility and soil texture parameters. 96
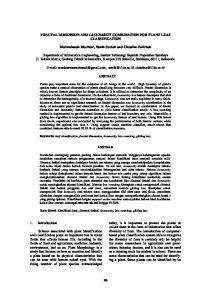
Materials and methods Soil sampling and analysis To provide a wide range of particle size distribution 36 soil series (Bordbar 1967) with diverse properties were selected from the northwest of Iran and 36 samples were taken from the Ap or A horizon of soil profiles. The samples were air dried at room temperature. A sub-sample of about 2 kg of each soil was sieved using 2-mm sieve apertures. Soil texture (Gee and Or 2002), organic matter, pH, EC, cation exchange capacity (CEC), sodium adsorption ratio (SAR), calcium carbonate equivalent (CCE), and CaSO4 were determined using standard laboratory methods (Sparks 1996). Soil particle size distribution was described according to percentage of clay (2sigma) were discarded to improve considerably the regression fit (Figure 1). Coefficient of determination 2 (R ) and Morgan-Granger-Newbold (MGN) test (Harvey 1997) were applied to compare predictive accuracy of the regression modeling. Two different
9 y = 0.495x + 82425 R2 = 0.517 Ki - Predicted x106
0.09-m thick layer and then was saturated from the base by a constant-head water supply for 24 h. Excess water was allowed to drain from the soil by gravity for 5 min before the start of each experiment, and the drainage outlet remained open during the experiment; then the slope of the flume was adjusted to the 9% and was subjected to the rainfall for at least -1 90 min. Rainfall intensity treatments were 20 mm h , -1 -1 37 mm h and 47 mm h , which will be designated hereafter as IA, IB, and IC, respectively. The flume provided sufficient runoff and soil erosion for interrill erodibility analysis, but could not supply sufficient flow for producing bed shear stress to induce rill erosion. Outflow runoff samples were collected continuously manually at different time intervals, from less than 60 s at the beginning to up to 15 min near the end of the test. At the end of the experiment, the volume of runoff samples (V) was measured and they were allowed to evaporate. The remaining mass was oven dried at 105 °C for 24 h and weighed (Md), allowing the sediment load to be determined at each time interval during the erosion test. Sediment concentration in each runoff sample was computed as Md /V. These data were used to calculate runoff and erosion rates. The observed interrill erodibility values were calculated using Eq. (2) (Kinnell 1993):
6
3
IeσirSf
a 0
Sf = 1.05 − 0.85 exp
(−4 sin (θ))
(3)
where θ is the slope angle (degrees). Di and σir were considered, respectively, as the – ratios of mean sediment mass (Md) per unit area and – the mean runoff volume (V ) per unit area to the mean time intervals (t ) at which steady-state conditions were realized and the sediments and runoffs were measured.
6 Ki - Measured x106
9
5
Ki - Predicted x106
where Ki is interrill erodibility (kg s m ), Di is interrill −2 −1 −1 erosion rate (kg m s ), Ie is rainfall intensity (m s ), -1 σir is interrill runoff rate (m s ), and Sf is the slope factor (dimensionless) calculated as (Liebenow et al. 1990):
3
0
−4
y = 0.857x + 37106 R2 = 0.652
4 3 2 1
b
0 0
1
2
3 4 Ki - Measured x106
5
Figure 1. Comparison of measured and predicted Ki for the all 36 soils (a) and for the 34 soils (b) after dropping 2 outlier data points (encircled).
97
Soil texture fractions and fractal dimension of particle size distribution as predictors of interrill erodibility
approaches were adopted in the model structure. In the first approach, texture fractions were included as independent variables and non-significant variables were excluded from the model by the stepwise method. In the second approach fractal parameters were included in simple linear regression modeling.
dimensions (DB < 3). The results (Table 2) also showed that the low DB values were obtained for soils containing high sand, while greater DB values were associated with soils that had high silt and clay contents. Therefore, DB seems to be able to differentiate between soil textures. Interrill erodibility
Results Soil properties and fractal dimensions of PSD Table 1 summarizes the range, mean, and standard deviation of some physical and chemical properties of the examined soils. There were considerable differences in SAR, EC, organic matter, CCE, clay, silt, and sand contents among the soils used in this experiment. The greatest coefficients of variation occurred for SAR (130.3%). This high variation in soil properties imparts a generality to the findings and allows them to be applied with greater reliability to other soils. Table 1 contains statistics of the fractal dimensions of PSD in 36 examined soils. The values for DB ranged from 2.60 to 2.89 and are comparable to those reported by Bayat (2009) for 124 soil samples from the west and northwest of Iran. Results in Table 1 showed that the PSDs of all 36 examined soils have fractal behavior, because they have fractional (non-integer)
Interrill erodibility parameters (Ki) of the examined soils calculated at 3 rainfall rates using Eq. (2) are listed in Table 3. The values ranged from 1.03 5 -4 to 79.71 × 10 kg s m , depending on the soil and rainfall intensity. Table 2. Mean and standard deviation (SD) of fractal dimensions (DB) of each texture class. DB Texture class
silty clay clay silty clay loam clay loam sandy clay loam loam sandy loam sand
Number of samples
Mean
SD
2 1 5 7 1 13 6 1
2.88 2.85 2.84 2.82 2.78 2.74 2.69 2.63
0.01 0.01 0.03 0.03 0.05 -
Table 1. Overall minimum, maximum, mean, standard deviation (SD), and coefficient of variation (CV) of some properties of the studied soils. Soil properties
98
Min
Max
Mean
SD
CV (%)
8.3 34.72 59.9 8.56 69.08 0.61 26.3 4.38 50.2 53.0 90.1 22.0
7.79 5.84 23.96 2.19 41.81 0.21 16.18 1.91 26.0 34.6 39.4 10.1
0.29 7.61 11.07 2.15 12.94 0.12 6.48 1.35 10.9 11.4 20.2 5.5
3.7 130.3 46.2 98.7 31.0 57.1 40.1 70.7 42.1 33.0 51.2 54.5
2.89
2.77
0.07
2.54
pH SAR CEC EC SP CaSO4 CCE OM Clay Silt Sand Very fine sand
(cmol kg ) (cmolc kg-1) (dS m-1) (%) (%) (%) (%) (%) (%) (%) (%)
6.81 0.31 6.8 0.41 24.01 0 3.7 0.06 8.5 1.4 6.5 0.0
DB
-
2.60
-1 0.5
M. R. NEYSHABOURI, A. AHMADI, H. ROUHIPOUR, H. ASADI, M. IRANNAJAD
Table 3. Minimum, maximum, mean, standard error (SD), and coefficient of variation (CV) of interrill soil erodibility (Ki) values. Min. Dataset
IA IB IC Combined
Max.
Rainfall intensity (mm h-1)
Mean
SD CV (%)
×105 (kg s m-4)
20 37 47 -
2.10 1.03 3.17 2.39
15.52 ns 13.27 ns 15.15 ns 13.98
79.71 39.69 44.38 46.47
14.58 8.75 8.87 8.62
93.94 65.95 58.54 61.64
ns
: Not significant at the 0.05 level
Soil erodibility (Ki) and texture parameters Table 4 shows the relation between Ki and soil texture parameters (percent clay, silt, and sand, and fractal dimensions of PSD). High soil loss with increasing silt content (significant positive correlation between Ki and silt content, Table 4) was observed for various soils. Unlike the finding reported by Elliot et al. (1989), Table 4 shows a highly significant positive correlation between Ki and clay. The correlation of Ki to the fractal dimensions of particle size distribution is also shown by the significant positive correlation between Ki and DB.
Table 5 shows the regression equations constructed using stepwise ridge regression analysis and the corresponding coefficient of determination. At IA rainfall rate, clay content, at IB rainfall rate sand and vfs contents, and at IC rainfall rate none of the texture fractions remained in the model. By using the combined dataset, clay fraction in the regression model accounted for 24% of the variation in Ki. Interrill erodibility parameter, Ki, was also predicted by the second approach where fractal dimensions were included in the linear regression analysis (Table 5). Accordingly, DB was included in the models of IA and IB and the combined dataset, and accounted for 66%, 16%, and 19% of the variation in Ki, respectively.
Table 4. Simple correlation coefficient (r) of interrill erodibility (Ki) at 3 rainfall intensities to textural fractions and PSD fractal dimensions. Ki Texture parameters IA
IB
IC
Combined
clay
0.804**
0.481**
0.286
0.436**
silt
0.596**
0.466**
0.221
0.458**
sand
-0.735**
-0.525**
-0.278
-0.496**
-0.076
-0.061
0.023
-0.116
vfs+silt
0. 466**
0.464**
0.346*
0.428**
DB
0.812**
0.398*
0.213
0.370*
vfs
-1 . IA, IB and IC present rainfall intensities of 20, 37 and 47 mm h , respectively * and ** mean significant at the 0.01 and 0.05 level
99
Soil texture fractions and fractal dimension of particle size distribution as predictors of interrill erodibility
Table 5. Regression equations to estimate interrill erodibility (Ki) from soil texture fractions and fractal dimensions of soil particles. R2
MGN
Ki=8658254 DB -22510000 Ki=5766325 clay-55490
0.66** 0.65**
2.09ns
IB (37 mm h-1)
Ki=4884291 DB -12200000 Ki=1985941-3189005 sand +2690122 vfs
0.16** 0.37**
2.03ns
Combined data
Ki=4909085 DB -12210000 Ki=3572701 clay + 554920
0.19** 0.24**
1.45ns
Rainfall intensity
Equation
-1 IA (20 mm h )
* and ** mean significant at the 0.01 and 0.05 level ns : Not significant at the 0.05 level
Discussion Our results show that the lower values of DB were related to the soils that had the greater sand content, while the higher values were related to the soils with greater silt and clay contents. Therefore, it seems that fractal dimension is able to differentiate between soil textures. Wang et al. (2006) stated that the lowest and the highest fractal dimension of PSD corresponded to sandy and clay soils, respectively. Giménez et al. (1997), on the other hand, reported that fractal dimension values showed an unclear trend with soil texture. Huang and Zhan (2002) also found that the fractal dimension of PSD increased with clay but decreased with sand contents.
Ki from the WEPP-recommended model using soil texture fractions at higher rainfall intensities. They concluded that neglecting the dominancy of flowdriven erosion at high rainfall rates and ignoring the effect of water depth on interrill erosion were probably the most important problems concerning the interrill component of the WEPP model. Chaves and Nearing (1991) concluded that this uncertainty arises from the inadequacy and incompleteness of the model in representing the physical system being studied.
The lack of significance among difference in Ki values at the 3 rainfall rates implies that Ki is independent of rainfall intensity. In other words, according to Eq. (2), it appears that changes in Di and σir become almost proportional to the variation in the rainfall rate in a way that keeps Ki unaltered. Kinnell (1993) has also considered Ki as an independent factor from rainfall intensity in the steady-state condition of soil erosion. However, Asadi et al. (2008) reported that Ki increased with rainfall rate, indicating that there is a structural uncertainty hidden in Eq. (2).
There was a significant positive correlation between Ki and silt content. Silt-sized particles are small enough to reduce the permeability of a soil and are also easily transported by runoff (FDER 1988). Ross et al. (1988) also reported that soils with high contents of silt are generally more erodible. A negative correlation between sand fraction and Ki means that it takes more energy to transport sand particles. There was no correlation between very fine sand (vfs) and Ki. Duiker et al. (2001) reported that very fine sand content alone is not the best parameter to use to predict interrill erodibility. Our findings (Table 4) also show that Ki has a higher correlation with vfs + silt than vfs alone.
Correlation of Ki to soil texture parameters was higher in low rainfall intensity (IA) than in high (IC) rainfall intensity (Table 4). These results imply that with increasing rainfall intensity other soil properties rather than texture may control Ki. Asadi et al. (2008) also reported a bias and systematic error in predicting
A positive correlation between Ki and clay may relate to the nature of the clay minerals present in the soils of the current study (Lado et al. 2004). Khormali and Abtahi (2005) and Samadi et al. (2008) reported that expanding clays are the major clay minerals in the soils of west and northwest of Iran. They swell
100
M. R. NEYSHABOURI, A. AHMADI, H. ROUHIPOUR, H. ASADI, M. IRANNAJAD
markedly and adversely affect resistance to erosion (Ross et al. 1988; Mermut et al. 1997). Udeigwe et al. (2007) also found a positive relationship between clay content and soil erosion. They reported that clay mineralogy could have an important effect on erodibility. Yılmaz et al. (2005) reported that there is a positive relationship between structural stability and kaolinite, and there is a negative relationship with smectite.
The results of the predictive accuracy test (MGN, Table 5) showed that a nonsignificant difference was found between accuracy of the models derived using either texture fractions (sand, silt, very fine sand and sand) or DB. On the other hand, since using fractal dimension could follow the principles of uniqueness, fractal dimension of PSD could be applied as an alternative of texture fractions for prediction of interrill erodibility.
At the low (IA) and moderate (IB) rainfall intensities, clay and sand contents, respectively, showed the highest correlation with Ki (Table 4). This means that at different rainfall intensities various fractions of soil texture may control the discharge of sediment. Kinnell (2009) also showed that at low rainfall intensity (20 mm h-1) the proportion of coarse material in sediment load decreased because the rates of particles moving through interrill erosion by raindrop impact induced saltation were lower than the rates that occurred during the high rainfall intensity (50 mm h-1).
Unlike the results reported by several researchers, our findings showed a positive correlation between Ki and clay content. It could be due to differences in clay mineralogy. The clarification, however, needs further research.
At the high rainfall intensity (IC) Ki was correlated only with vfs + silt contents; this may be due to greater flow depth and lower raindrop impact induced saltation of coarser soil particles (Asadi et al. 2008). Decreasing in correlation coefficients between Ki and soil texture fractions at Ic intensity level may imply that under high rainfall intensities the detachmentlimiting sediment process dominated. Assouline and Ben-Hur (2006) stated that the earlier stage of erosion is mostly a transport-limited regime, which shifts to a detachment-limited regime especially at higher rainfall intensities. Tromp-van et al. (2008) in their studies assumed that rainfall detachment is nonselective with respect to particle size.
Using either texture fractions (sand, silt, very fine sand and sand) or DB did not affect the accuracy of the Ki-predicting models. On the other hand, since using fractal dimension could follow the principles of uniqueness, fractal dimension of PSD could be applied as an alternative of texture fractions for prediction of interrill erodibility.
Conclusions
The degree of dependence of interrill erodibility (Ki) to soil texture fractions (sand, silt and clay contents) was greatly affected by the rainfall intensity level. No unique regression model could be constructed to predict Ki equally well at various intensity levels.
As our data set is restricted to a semi-arid area, further study is needed at different soil and climatic conditions to generalize the findings of this study.
References Aba Idah P, Mustapha HI, Musa JJ, Dike J (2008) Determination of erodibility indices of soils in Owerri west local government area of Imo State Nigeria. Assumption University Journal of Technology 12: 130-133. Anderson AN, McBratney AB, Crawford JW (1998) Application of fractals to soil studies. Adv Agron 63: 1-76. Asadi H, Rouhipour H, Ghadiri H (2008) Evaluation of interrill component of the WEPP model for three contrasting soil types in Iran. Adv GeoEcology 39: 237-246.
Assouline S, Ben-Hur M (2006) Effects of rainfall intensity and slope gradient on the dynamics of interrill erosion during soil surface sealing. Catena 66: 211-220. Bayat H (2009) Development of Pedotransfer Functions to Predict Soil Moisture Curve Using Artificial Neural Networks and Group Method of Data Handling by Using Fractal Parameters and Principle Component as Predictors. PhD thesis, Tabriz University, p. 274.
101
Soil texture fractions and fractal dimension of particle size distribution as predictors of interrill erodibility
Bird NRA, Perrier E, Rieu M (2000) The water retention function for a model of soil structure with pore and solid fractal distributions. Eur J Soil Sci 51: 55-63.
Liebenow AM, Elliot WJ, Laflen JM, Kohl KD (1990) Interrill erodibility, collection and analysis of data from cropland soils. Trans ASAE 33: 1882-1888.
Bordbar M (1967) The semi detailed soil survey of Tabriz project. Ministry of Agriculture, Soil Institute of Iran, Publication No. 92.
Mermut AR, Luk SH, Romkens MJM, Poesen JWA (1997) Soil loss by splash and wash during rainfall from two loess soils. Geoderma 75: 203-214.
Chaves HML, Nearing MA (1991) Uncertainty analysis of the WEPP soil erosion model. Trans ASAE 34: 2437-2444.
Millan H, Posada MG, Aguilar M, Domínguez J, Cespedes L (2003) On the fractal scaling of soil data: Particle-size distributions. Geoderma 117: 117-128.
Duiker SW, Flanagan DC, Lal R (2001) Erodibility and infiltration characteristics of five major soils of southwest Spain. Catena 45: 103-121. Elliot WJ, Liebenow AA, Laflen JM, Kohl KD (1989) A compendium of soil erodibility data from WEPP cropland soil field erodibility experiments 1987 and 88. NSERL Report Vol. 3 Agricultural Research Service, US Department of Agriculture, National Soil Erosion Research Lab, West Lafayette, Indiana p. 316. FDER (1988). The Florida Development Manual: A Guide to Sound Land and Water Management. Department of Environmental Regulation, Tallahassee, FL. Flanagan DC, Nearing MA (1995) USDA -Water Erosion Prediction Project (WEPP), WEPP Users Summary. NSERL Report, Vol. 10 USDA -ARS National Soil Erosion Research Laboratory, West Lafayette, Indiana. Gee GW, Or D (2002) Particle-size analysis. In: Methods of Soil Analysis Part 4 Physical Methods (Ed. AD Warren), Soil Sci Soc Am Inc pp. 255-295. Giménez D, Perfect E, Rawls WJ, Pachepsky YA (1997) Fractal models for predicting soil hydraulic properties: A review. Eng Geol 48: 161-183. Harvey MADI (1997) The Evaluation of Economic Forecasts. PhD thesis, University of Nottingham, p. 276. Huang GH, Zhan WH (2002) Fractal property of soil particle size distribution and its application. Acta Pedologica Sinica 39: 490497. Khormali F, Abtahi A (2005) Correlation of the clay mineral distributions in the sedimentary rocks of south and western Zagros Iran. Geophysical Res Abstracts, Vol. 7, European Geosciences Union.
Obi ME, Salako FK, Lal R (1989) Relative susceptibility of some Southeastern Nigeria soils to erosion. Catena 16: 215-225. ÓGeen AT, Elkins R, Lewis D (2006) Erodibility of agricultural soils with examples in Lake and Mendocino counties Oakland. University of California, Division of Agriculture and Natural Resources, Publication No.8194. Perfect E, Kay BD (1995) Applications of fractals in soil and tillage research: A review. Soil Tillage Res 36: 1-20. Perrier E, Bird N, Rieu M (1999) Generalizing the fractal model of soil structure: The pore–solid fractal approach. Geoderma 88: 137-164. Ross HG, Beattie JA, Reid RE (1988) Australian Soil and Land Survey Handbook: Guidelines for Conducting Surveys. Inkata Press, ISBN: 0909605440. Samadi A, Dovlati B, Barin M (2008) Effect of continuous cropping on potassium forms and potassium adsorption characteristics in calcareous soils of Iran. Aust J Soil Res 46: 265-272. Sparks DL (1996) Methods of Soil Analysis Part 3 Chemical Methods. SSSA-ASA, Madison WI. StatSoft (2004) STATISTICA for Windows. Computer program manual. Tulsa, OK 74104, USA. Su YZ, Zhao HL, Zhao WZ, Zhang TH (2004) Fractal features of soil particle size distribution and the implication for indicating desertification. Geoderma 122: 43-49. Tromp-van MHJ, Parlange JY, Barry DA, Tromp MF, Sander GC, Walter MT, Parlange MB (2008) Influence of sediment settling velocity on mechanistic soil erosion modeling. Water Resou Res 44: 1-17.
Kinnell PIA (1993) Runoff as a factor influencing experimentally determined interrill erodibilities. Aust J Soil Res 31: 333-342.
Udeigwe TK, Wang JJ, Zhang H (2007) Predicting runoff of suspended solids and particulate phosphorus for selected Louisiana soils using simple soil tests. J Environ Qual 36: 13101317.
Kinnell PIA (2009) The influence of raindrop induced saltation on particle size distributions in sediment discharged by rainimpacted flow on planar surfaces. Catena 78: 2-11.
Wang X, Li MH, Liu Sh, Liu G (2006) Fractal characteristics of soils under different land-use patterns in the arid and semiarid regions of the Tibetan Plateau China. Geoderma 134: 56-61.
Lado M, Ben-Hur M, Shainberg I (2004) Soil wetting and texture effects on aggregate stability, seal formation and erosion. Soil Sci Soc Am J 68: 1992-1999.
Wischmeier WH, Smith DD (1978) Predicting Rainfall Erosion Losses: A Guide to Conservation Planning Agricultural Handbook. Vol. 537. US Department of Agriculture, Washington DC.
León CCR (2005) A Multi-scale Approach for Erosion Assessment in the Andes. PhD thesis, Wageningen University, ISBN: 90 - 8504 - 166- X.
102
Yılmaz K, Çelik I, Kapur S, Ryan J (2005) Clay minerals, Ca/Mg ratio and Fe-Al-oxides in relation to structural stability, hydraulic conductivity and soil erosion in southeastern Turkey. Turk J Agric For 29: 29-37.