www.nmletters.org
Solid-State Synthesis and Effect of Temperature on Optical Properties of CuO Nanoparticles C. C. Vidyasagar, Y. Arthoba Naik∗ , T. G. Venkatesha, R. Viswanatha
(Received 22 February 2012; accepted 9 May 2012; published online 28 June 2012.)
Abstract: Modulation of band energies through size control offers new ways to control photoresponse and photoconversion efficiency of the solar cell. The P -type semiconductor of copper oxide is an important functional material used for photovoltaic cells. CuO is attractive as a selective solar absorber since it has high solar absorbance and a low thermal emittance. The present work describes the synthesis and characterization of semiconducting CuO nanoparticles via one-step, solid-state reaction in the presence of Polyethylene glycol 400 as size controlling agent for the preparation of CuO nanoparticles at different temperatures. Solid-state mechanochemical processing, which is not only a physical size reduction process in conventional milling but also a chemical reaction, is mechanically activated at the nanoscale during grinding. The present method is a simple and efficient method of preparing nanoparticles with high yield at low cost. The structural and chemical composition of the nanoparticles were analyzed by X-ray diffraction, field emission scanning electron microscopy and energy-dispersive spectrometer, respectively. Optical properties and band gap of CuO nanoparticles were studied by UV-Vis spectroscopy. These results showed that the band gap energy decreased with increase of annealing temperature, which can be attributed to the improvement in grain size of the samples. Keywords: Band gap; CuO; Polyethylene glycol 400; Semiconductors; Solid-state reaction
Citation: C. C. Vidyasagar, Y. Arthoba Naik, T. G. Venkatesha and R. Viswanatha, “Solid-State Synthesis and Effect of Temperature on Optical Properties of CuO Nanoparticles”, Nano-Micro Lett. 4 (2), 73-77 (2012). http://dx.doi.org/10.3786/nml.v4i2.p73-77
Introduction Work demand for energy is expected high and finding sufficient route to produce clean energy is an ever more pressing problem. Science had identified the key research challenges if solar energy is to provide a significant fraction of our energy needs. The huge gap between our present use of solar energy and its enormous undeveloped potential defines a grand challenge in energy research. One of the most attractive methods currently being developed is “dye sensitization” in solar cells in order to increase the efficiency of conversion of solar radiation into electrical energy. Further, the most serious problem of fossil fuel as the energy source is the harmful effect produced on the environ-
ment due to the release of hazardous gases into the atmosphere. To avoid both environmental pollution and the future energy crisis, much attention has been devoted to the development of photovoltaic solar cells. The development of photovoltaic solar cells was initiated first by the French Scientist Edmund Bequerel [1]. During the last two decades, a substantial body of research has been directed toward the synthesis of metal nanoparticles in efforts to explore their special properties and potential applications. Nanocrystalline semiconductor particles have drawn considerable interest in recent years because of their special properties such as a large surface-to-volume ratio, increased activity, special electronic properties and unique optical properties as compared to those of the bulk materials [2-4]. The large
Department of Chemistry, School of Chemical Sciences, Kuvempu University, Jnanasahyadri, Shankaraghatta-577 451, Karnataka, INDIA *Corresponding author. E-mail:
[email protected]
Nano-Micro Lett. 4 (2), 73-77 (2012)/ http://dx.doi.org/10.3786/nml.v4i2.p73-77
Nano-Micro Lett. 4 (2), 73-77 (2012)/ http://dx.doi.org/10.3786/nml.v4i2.p73-77
Materials and methods
surface area to volume ratio can contribute to some of the unique properties of nanoparticles. The oxides of transition metals are an important class of semiconductors. Among various semiconductors, Cu and their oxides have attracted a great deal of attention in both fundamental research and technical application because of their catalytic, optical, and electrical conducting properties [5,6]. Copper is an important material because of its high electrical and thermal conductivities. CuO is known as p-type semiconductor exhibiting narrow band gaps (Eg = 1.2 eV) and which makes it a promising material for gas sensors, magnetic storage media, solar energy transformation, electronics, semiconductors, varistors, and catalysis [7]. It has therefore been studied together with other copper oxides, especially with respect to its applications as a photothermally active and photoconductive compound [8]. Thus, great efforts have been made to study the preparation of nanosized CuO in the past two decades. Conventional methods for the preparation of CuO powders include one step solidstate reaction at room temperature, thermal decomposition of copper salts and mechanical milling of commercial powders [9-11]. Solid-state mechanochemical processing is an effective, useful and simple processing technique widely applied to the synthesis of quasicrystalline, nanocrystalline and crystalline materials, which is not only a physical size reduction process in conventional milling but also a chemical reaction that is mechanically activated at the nanoscale during grinding. The present method is a simple and efficient method of preparing nanoparticles with high yield at low cost. Thus, there is a renewed interest in understanding the fundamental physical properties of CuO, as well as for upgrading its performance in applications. PEGs are prepared by polymerization of ethylene oxide and are commercially available over a wide range of molecular weights from 300 g/mol to 10,000,000 g/mol. While PEG with different molecular weights find use in different applications and have different physical properties (e.g., viscosity). They are used in industry as surfactants, including food, cosmetics, toothpastes and pharmaceutics; in biomedicine, as dispersing agents. PEG 400 is less toxic and soluble in water, acetone, alcohols and benzene [12,13]. In this work, to prepare low-cost advanced materials for photovoltaic energy production, we report a simple one-step, solid-state reaction in presence of PEG 400 [H-(O-CH2 -CH2 )n -OH] as size controlling agent for the preparation of CuO nanoparticles at different temperature. The process is carried out at room temperature. Band gap energy of all the synthesized nanoparticles was calculated using UV-vis spectroscopic data and synthesized the materials as in our pervious paper (C. C. Vidyasagar, et al. Powder Tech. 2011).
Materials Copper dichloride and sodium hydroxide were procured from Merck (Mumbai, India). PEG 400 (Polyethylene glycol 400) was procured from s.d.fineCHEM Ltd. (Mumbai, India). All the chemicals were of analytical grade and used as received for the experiments. Double distilled water was used for the preparation of the solutions. Characterization of nanoparticles X-ray powder diffraction (XRD) patterns were recorded on a Philips X’Pert X-ray diffractrometer using Cu-Kα radiation. The size distribution and morphology of the samples were analyzed by Field emission scanning electron microscope (FESEM) fitted with an Energy-dispersive X-ray spectroscopy (EDAX) [Model: Nova Nano SEM600-FEI]. The absorbance of nanopowder samples were measured on a UV-Vis spectrophotometer [Model: USB 4000, Ocean Optics, USA]. Synthesis of CuO nanoparticles In a typical synthesis, 5 g of CuCl2 and 3 g of NaOH were ground separately for 5 min in an agate mortar. Thus obtained fine powder of CuCl2 and NaOH were mixed with 6 ml of PEG 400 and subjected to further grinding for 30 min. The resultant paste was thoroughly washed with double distilled water and ethyl alcohol to remove the PEG 400. Finally, the product was dried at 70℃ in an oven and the resultant solid was subsequently annealed at 400℃, 600℃ and 800℃ for 2 h.
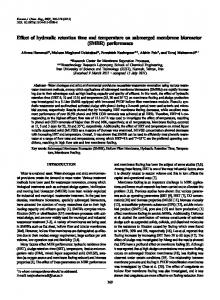
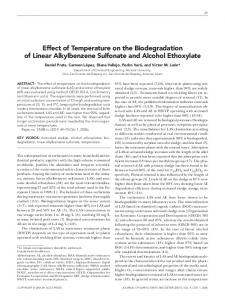
Results and discussions X-ray diffraction measurements were carried out to study the crystal structure and crystalline quality. Figure 1 represents the XRD pattern of synthesized CuO nanoparticles calcined at 400℃, 600℃ and 800℃, respectively. All the diffraction peaks could be indexed to crystalline monoclinic structure. The major peaks located at 2θ values correspond to the characteristic diffraction of monoclinic phase of CuO (JCPDS NO80-1268). No other peaks were observed belonging to any impurity such as Cu(OH)2 and Cu2 O, indicating high purity of CuO nanoparticles. CuO particles annealed at higher temperature shows shift in (110), (002) and (200) planes compared to lower annealed temperatures. As the annealing temperature increases, the peak intensity of CuO nanoparticles increases with a decrease in the full width at half maximum (FWHM), which indicates a possible change in the grain size of CuO [12,14]. The diffraction peak (110) was narrower 74
Nano-Micro Lett. 4 (2), 73-77 (2012)/ http://dx.doi.org/10.3786/nml.v4i2.p73-77
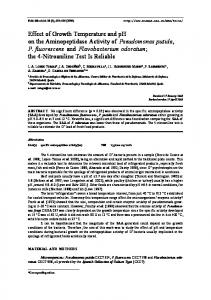
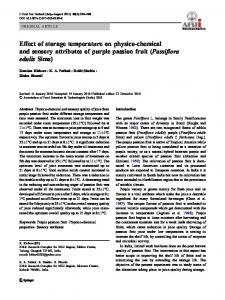
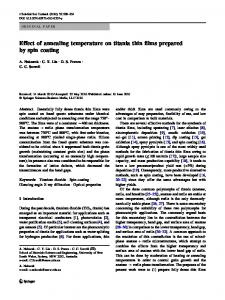
As the annealing temperature increases from 400℃ to 800℃, the crystal size of CuO was also found to be increased from 65 nm to 454 nm) (Fig. 2(b) and 2(c)). With increasing in the annealing temperatures, the nucleation rate of the particles increases more rapidly. This is due to the increase in supersaturation of the reaction products, which accelerates the crystal core forming reaction within a short time. Under these conditions the controlling step of the reaction is transferred from grain growth to crystal nucleus formation. With the temperature continuing to rise, the phenomenon of “nuclear-aggregation” caused by the rapid formation of crystal nucleus is obvious, which results in aggregation among the crystal nucleus [12,16,17]. The rate of particle aggregation is a major factor that controls the morphology and structure (crystalline) of the final product [18]. With increasing the calcination temperature particle agglomeration was observed in FESEM images. Literature also indicates that with increase in calcination temperature the crystallinity of the particle increases as well as the surface area decreases. Variation in calcination temperature brought about changes in the crystallinity [21]. The micrographs clearly indicated that the crystallinity has increased with an increase in annealing temperature, which is in agreement with XRD results. EDAX spectra of CuO particles at different temperatures are shown in Figs. 2(d), 2(e) and 2(f), which indicates the high purity of synthesized materials where only Cu and O are present. Carbon signal are due to the Gold coating and carbon film supporting the specimen in FESEM observation [12]. Surfactants (PEG 400) would change nanoparticle’s shape, size and surface properties to different extent depending upon their molecular structure, for example, nature of head group, length of hydrophobic tail and type of counter ions. The termination of the nanoparticle growth and size is controlled by the diffusion and the attachment rates of surfactants (PEG 400) on the nanoparticle surface [23, 24]. Figure 3 shows the UV-Vis absorption spectra of the samples annealed at different temperatures. The exciton absorption is at about 650-900 nm. The CuO particles obtained from the higher annealing temperatures exhibits the relatively lower absorption in the visible range. As shown in Fig. 3, the increasing annealing temperature of CuO particles is considered to be the main factor for the intense decrease in absorption [19]. The crystallinity of the particles in our experiment was improved when the substrate temperatures increased from 400℃ to 800℃ (Fig. a, b and c). With increase in the annealing temperature from 400℃ to 800℃, the optical absorption edge slightly shifted towards longer wavelength, which may be attributed to the increase in grain size at higher annealing temperatures. The optical band gap (Eg ) of the CuO was determined by using the formula, Eg = hc/λ, where h is plank’s constant, c
30
35
40 2θ (degree)
45
(−202)
(200)
400 °C 600 °C 800 °C (110)
Intesity (a.u.)
(002)
than (002) peak, and in turn (002) peak was narrower than (200) peak. This clearly indicates the presence of asymmetry in the crystallite shape. The height of c-axis of the crystal is bigger than the basal diameter (crystal axis, a1 , a2 ) [15]. The intensity of (110), (002) and (200) peaks gradually increases with increase in annealing temperature. However, the peak intensity of the annealed samples at 800℃ was found to be increased. The lattice parameters for CuO nanoparticles were calculated from the XRD data. The lattice constants a, b and c for CuO annealed at 400℃ were found to be 0.47153 nm, 0.33774 nm and 0.51247 nm, respectively. As for CuO annealed at 600℃, the lattice constant a decreases to 0.47141 nm, b increases to 0.34206 nm and c increases to 0.51264 nm. For CuO annealed at 800℃, a decreases to 0.46392 nm, b decreases to 0.33934 nm and c decrease to 0.50409 nm. Figure 1 illustrates the changes in (002) and (200) peaks position of the nano powders. As shown in Fig. 1, when the calcinations temperature changes from 400℃ to 600℃, the peaks slightly shift towards lower angles. On the other hand the strongest shift towards higher angles has been observed in the sample annealed at 800℃. This can be seen from the enlarged view of the inset in Fig. 1. These shifts depend directly on the changes of the lattice constants [22]. It can be seen that the shifts of the peaks were detected as the lattice constants changed, which results in the changes of lattice constants along a, b and c-axis. As the peaks shift towards lower angle, the lattice constants increase and as it shifts towards higher angle, the lattice constants decrease [20]. The increases in peak intensity at higher annealing temperatures are attributed to the increase in crystallinity.
50
Fig. 1 XRD patterns of CuO samples prepared at different temperatures.
Figure 2 shows the FESEM micrographs of all annealed samples and EDAX patterns of CuO. It was clearly seen that the samples annealed at 800℃ revealed the uniform and plate-like particles. From Fig. 2(a) it can be seen that size of CuO nanoparticles annealed at 400℃ are in the range of 21-25 nm. 75
Nano-Micro Lett. 4 (2), 73-77 (2012)/ http://dx.doi.org/10.3786/nml.v4i2.p73-77 (a)
4.8
(d)
5.6 Cu
(c)
3.5
(e) Cu
3.0
3.6
4.2
2.5
3.0
3.5
2.4 1.8 O 1.2 Cu 0.6 C 0 0 2
Cu
6 8 Energy KeV
1.5
2.1 O 1.4 Cu
0 12 0
10
(f)
Cu
2.0
2.8
4
6 8 Energy KeV
Cu
Cu
0.5
Cu 2
O
1.0
Cu
0.7 C
Cu 4
Counts
4.9
Counts
Counts
4.2
(b)
10
C 0 12 0
Cu 2
4
6 8 Energy KeV
10
12
Fig. 2 FESEM images and EDAX spectra of CuO samples prepared at different temperatures. (a) and (d) 400℃, (b) and (f) 600℃, (c) and (e) 800℃.
Conclusion
is velocity of light and λ is wavelength [12]. The crystallinity of the CuO improved when the temperature increased from 400℃ to 800℃. It is obvious that the conduction type of CuO is dependent on temperature. From UV-Vis results, the shift in the band gap may be attributed to the effect of temperature on the crystallinity of CuO samples. On the other hand, the crystallinity become better when Eg value red shifted from 1.72 to 1.58 eV. The changes in the optical band gap of CuO samples with increase in temperature are due to the change of crystallinity at higher temperature. The observed results show that the annealing temperature is very important in the band gap assignment.
In summary, nanocrystalline CuO particles with a monoclinic structure have been synthesized through a simple, rapid, low-cost and one-step solid state reaction method using PEG 400 as a surfactant. The improved crystallinity was observed when annealed at higher temperatures. The grain size can between 21-450 nm. The intensity of peaks has been increased with increase in annealing temperature, as well as the optical band gap edge shifts towards longer wavelength region which may be attributed to the decreasing band gap of the CuO nanoparticles at higher temperatures.
Absorbance
0.3
0.2
Acknowledgments a b
Authors are grateful to UGC for financial support and DST, New Delhi. I would like to thank Prof. G. U. Kulkarni, Chemistry and Physics of Material Unit, Jawaharlal Nehru for Advanced Scientific Research, Bangalore, for helping FESEM/EDAX analysis. The authors wish to thank Dept. of Chemistry, Kuvempu University, for providing laboratory facilities to carry out this work.
1.72 eV 1.62 eV 1.58 eV
c 0.1
0.0 300
400
500 600 700 Wavelength (λ)
800
References
900
Fig. 3 UV-Vis spectra of CuO samples prepared at different temperatures.
[1] Sambandam Anandan, Sol. Energy Mater. Sol. Cells 91, 843 (2007). http://dx.doi.org/10.1016/j. 76
Nano-Micro Lett. 4 (2), 73-77 (2012)/ http://dx.doi.org/10.3786/nml.v4i2.p73-77 [14] Wang Dong, Z. Q. Chen, D. D. Wang, J. Gong, C. Y. Cao and Z. Tang, et al., J. Magn. Magn. Mater. 332, 3642 (2010). http://dx.doi.org/10. 1016/j.jmmm.2010.07.014
solmat.2006.11.017 [2] A. Henglein, Chem. Rev. 89, 1861 (1989). http://dx. doi.org/10.1021/cr00098a010 [3] A. Agfeldt and M. Gratzel, Chem. Rev. 95, 49 (1995). http://dx.doi.org/10.1021/cr00033a003 [4] Hui Wang, Jin-Zhong Xu, Jun-Jie Zhu and Hong-Yuan Chen, J. Cryst. Growth 244, 88 (2002). http://dx. doi.org/10.1016/S0022-0248(02)01571-3 [5] Julia Hambrock, Ralf Becker, Alexander Birkner, Jurij Weiß and Roland A. Fischer, Chem. Commun. 68-69 (2002). http://dx.doi.org/10.1039/b108797e [6] Bong Kyun Park, Sunho Jeong, Dongjo Kim, Jooho Moon, Soonkwon Lim and Jang Sub Kim, J. Colloid Interface Sci. 311, 417 (2007). http://dx.doi.org/10. 1016/j.jcis.2007.03.039 [7] Masoud Salavati-Niasari and Fatemeh Davar, Mater. Lett. 63, 441 (2009). http://dx.doi.org/10.1016/j. matlet.2008.11.023 [8] Chih-Hung Lo and Tsing-Tshih Tsung, J. Vac. Sci. Technol. B 23, 2394 (2005). http://dx.doi.org/10. 1116/1.2122787 [9] Junwu Zhu, Haiqun Chen, Hongbo Liu, Xujie Yang, Lu. Lude and Xin Wang, Mater. Sci. Eng. A 384, 172 (2004). http://dx.doi.org/10.1016/j. msea.2004.06.011 [10] Claude Carel, Mona Mouallem Bahout and Jean Gaude, Solid State Ionics 117, 47 (1999). [11] Wang Wenzhong, Zhan Yongjie and Wang Guanghou, Chem. Commun. 727 (2001). http://dx.doi.org/10. 1039/B008215P [12] C. C. Vidyasagar, Y. Arthoba Naik, T. G. Venkatesh and R. Viswanath, Powder Tech. 214, 337 (2011). http://dx.doi.org/10.1016/j.powtec.2011.08.025 [13] Tetsuya Kida, Takanori Oka and Masamitsu Nagano, J. Am. Ceram. Soc. 90, 107 (2007). http://dx.doi. org/10.1111/j.1551-2916.2006.01402.x
[15] Masoud Sa lavati-Niasari, Fatemeh Davar and Mehdi Mazaheri, Mater. Lett. 62, 1890 (2008). [16] Siqingaowa, Zhaorigetu, H. Yao and Garidi, Front. Chem. China 3, 277 (2006). http://dx.doi.org/10. 1007/s11458-006-0036-7 [17] Fan Zhang and Junling Yang, Int. J. Chem. Kinet.1, 18 (2009). [18] Z. C. Michael Hu, T. Michael Harris and H. Charles Byers, J. Colloid Interface Sci. 198, 87 (1998). http:// dx.doi.org/10.1006/jcis.1997.5290 [19] T. Prem Kumar, S. Saravanakumar and K. Sankaranarayanan, Appl. Surf. Sci. 257, 1923 (2011). http:// dx.doi.org/10.1016/j.apsusc.2010.09.027 [20] J. C. Fan and Z. Xie, Mater. Sci. Eng. B 150, 61 (2008). http://dx.doi.org/10.1016/j.mseb.2008.02.014 [21] T. H. Mahato, Beer Singh, A. K. Srivastava, G. K. Prasad, A. R. Srivastava, K. Ganesan and R. Vijayaraghavan, J. Hazard. Mater. 192, 1890 (2011). http://dx.doi.org/10.1016/j. jhazmat.2011.06.078 [22] Majid Ebrahimizadeh Abrishami, Seyed Mohammad Hosseini and Ahmad Kompany, J. App. Sci. 11, 1411 (2011). http://dx.doi.org/10.3923/jas.2011. 1411.1415 [23] Mehta, S. K. & Chaudhary, Savita. Sci. Topics Retrieved, January 20 (2012). [24] Chang-Woo Kwon, Tae-Sik Yoon, Sung-Soo Yim, Sang-Hyun Park and Ki-Bum Kim, J. Nanopart. Res. 11, 831 (2009). http://dx.doi.org/10.1007/ s11051-008-9451-7
77