PROCEEDINGS OF THE FOURTH INTERNATIONAL CONFERENCE ON DYNAMICAL SYSTEMS AND DIFFERENTIAL EQUATIONS May 24 – 27, 2002, Wilmington, NC, USA
pp. 951–959
SOLUTION FILTERING TECHNIQUE FOR SOLVING BURGERS’ EQUATION
Tianliang Yang and J. M. McDonough Department of Mechanical Engineering University of Kentucky, Lexington, KY USA 40506-0503 Abstract. In this paper we focus on using a solution filtering technique as an alternative to the conventional large-eddy simulation approach of filtering the governing equations. Our research shows that the solution filtering technique works quite well when applied to Burgers’ equation, and since this equation embodies many important mathematical features of the Navier–Stokes equations, the solution filtering technique possesses significant potential for solving practical turbulence problems governed by these equations.
1. Introduction. Burgers’ equation is a one-dimensional (1-D) analogue of the Navier–Stokes (N.–S.) equations; it embodies many main mathematical features of the N.–S. equations if the driving force term in the equation is nonzero. On the other hand, it is well know that direct numerical simulations (DNS) of the N.– S. equations at high-Reynolds number, Re, are impossible at the present time or in the near future due to the restricted computer resources. The 1-D character of Burgers’ equation allows us to sidestep the difficulties encountered; therefore, many numerical studies of turbulent flows have been conducted by solving Burgers’ equation. Successful examples can be found in McDonough and Bywater [1], Love [2] and elsewhere. In [1] the effects of large-scale motion on the small-scale motion of turbulence were revealed while in [2] several subgrid-scale models for large-eddy simulation (LES) were tested successfully. In the present study, we test the solution filtering technique proposed in McDonough et al. [3] by solving Burgers’ equation numerically. The solution filtering technique is a numerical approach for solving turbulence problems, or any other problems for which computationally-affordable solutions will necessarily be under resolved on available computing hardware. It uses the filtering idea of the classical LES (see Germano [4]), and the usual LES decomposition variables is still employed. The difference is that in the solution filtering approach the governing equations (N.–S. equations or Burgers’ equation) are not filtered and are solved directly on a grid system that is much coarser than required by DNS; then the solution at each time step is filtered to remove aliasing that results from under resolution. Filtering equations, as done in usual LES, results in two main problems. First, if the governing equations are nonlinear, the action of the filter on the nonlinear terms produces correlations (statistical, rather than physical quantities) requiring modeling. Second, if nonuniform gridding is employed the filter will no longer 1991 Mathematics Subject Classification. Primary: 65M06, 76D05, 76F65. Key words and phrases. Turbulence, Filter, Burgers’ Equation.
951
952
TIANLIANG YANG AND J. M. MCDONOUGH
exactly commute with the differential operators, so errors arise even for linear terms. These problems are significantly reduced by filtering the solutions. The remainder of this paper is organized as follows. We begin in Sec. 2 with a Burgers’ equation model problem, particularly highlighting the similarity between the solutions of Burgers’ equation we designed for testing the numerical method and real turbulent flows. This is followed with a section that presents the detailed numerical method employed in the present study. Section 4 is a most important part in the present context; in it we describe our numerical results and provide pertinent comparisons. The final section summarizes the present work. 2. Burgers’ Equation Model problem. The form of Burgers’ equation considered here is the conserved form used in [1]: uτ +
1 ¡ 2¢ 1 u x− uxx = −P, 2 Re
(1)
with u(x, τ ) as the time- and space-dependent variable, and subscripts denoting partial differentiation. The nonhomogeneous function P plays the role of a pressure gradient and must be assigned. Similar to the fact that the pressure field strongly influences the flow field of a N.–S. flow, this nonhomogeneous function has a powerful effect on the form of solution of Eq. (1). There are two objectives for solving Burgers’ equations employing the solution filtering technique. The first is to compare the numerical results obtained by this method with the exact solutions of the original governing equation. This requires that exact solutions of Eq. (1) be easily obtained either analytically or numerically. The second objective is to investigate use of solution filtering in the context of solving Burgers’ equation to gain insight for applications involving turbulent flow problems. Therefore, it is important that the solutions of Eq. (1) have the irregular behavior of the N.–S. turbulent solutions in general. Previous studies [5] have shown that the solutions of Eq. (1) can exhibit the −5/3 Kolmogorov inertial range exponent if the nonhomogeneous function P is varied randomly in time within a certain amplitude range. But from the theory of dynamical systems we do not expect solutions to the N.–S. equation to be random. Thus, we have designed a forcing function that is completely deterministic, but exhibiting erratic (but not actually chaotic) behavior in both space and time. This is given by McDonough and Yang [6]:
P = 105π
M ½ X 20A2−α π j j=1
Re
£ ¡ ¢¤ £ ¡ ¢¤ sin19 Aj π x + τ cos2 Aj π x + τ
¾ £ ¡ ¢¤ £ ¡ ¢¤ £ ¡ ¢¤ A2−α π j 1−α 21 20 sin Aj π x + τ − Aj sin Aj π x + τ cos Aj π x + τ (2) − Re ¾ M½ ¾ M ½ £ ¡ ¢¤ £ ¡ ¢¤ X £ ¡ ¢¤ 525π X 20 21 , − 2α−1 sin Aj π x + τ cos Aj π x + τ sin Aj π x + τ Aj j=1 j=1 where Aj is a factor defined by Aj = e0.31j ,
j = 1, ..., M,
(3)
SOLUTION FILTERING TECHNIQUE FOR SOLVING BURGERS’ EQUATION
953
and the value of α is a prescribed constant for each specific nonhomogeneous function. Once P is assigned, Eq. (1) will have a unique solution under prescribed boundary and initial conditions. Two kinds of boundary and initial conditions are used in the present study. One set is the typical Dirichlet boundary condition and constant initial condition given by ¡ ¢ u a, τ = 0, (4a) ¡ ¢ u b, τ = 0, (4b) ¡ ¢ u x, 0 = 0. (4c) The other conditions take the following form given in [6]: u(a, τ ) =
¾ £ ¡ ¢¤ 21 5/Aα sin A π a + τ , j j
(5a)
¾ £ ¡ ¢¤ sin Aj π b + τ ,
(5b)
M ½ X j=1
u(b, τ ) =
M ½ X
5/Aα j
21
j=1
u(x, 0) =
M X ¡ ¢¤ £ 21 Aj πx , 5/Aα j sin
(5c)
j=1
with Aj as defined in Eq. (3). As shown in [6] the conditions (5) result in the following analytical solution to Eq. (1): ¾ M ½ X £ ¡ ¢¤ 21 u(x, τ ) = 5/Aα sin A π x + τ . (6) j j j=1
1.00
1
(a)
0.75
0.5
0.50
0
Normalized Velocity u
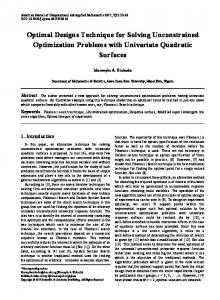
For large M , Eq. (6) can exhibit very complicated quasiperiodic oscillations with respect to both space x and time τ . If α is chosen appropriately, these oscillations are similar to those of real turbulent fluid flows. Figure 1 compares the oscillations of Eq. (6) for α = 1 and M = 500 with an actual experimental time series. The experimental velocity time series is measured by 1-D hot wire anemometry (HWA) for flow over a turbulator inside a channel with flow Reynolds number of 105 . Since only the absolute value of the velocity component can be obtained by 1D HWA, the absolute values of u in Eq. (6) at a certain point of space (x = 1.5) are shown here. It can be seen that much of the experimental flow structure shown in Fig. 1(b) can be reproduced by Eq. (6).
0.25
-0.5
0.0
1 -1 0
(b)
0.2
0.4
0.6
0.8
1
0.75
0.5
0.50
0
0.25
-0.5
0.0 0.0 -1
0
0.2
0.2
0.4
0.4
0.6
0.6
0.8
0.8
1
1.0
Scaled Time (Arbitray Units)
Fig. 1 Comparison of Eq. (6) with experimental velocity time series. (a) Modeled results. (b) Experimental measurements
954
TIANLIANG YANG AND J. M. MCDONOUGH
3. Numerical Method. The governing equation (1) is nonlinear, but it can be solved by a straightforward finite-difference scheme. This consists of trapezoidal integration in time and centered differencing (on a uniform grid in the present case) in space. The only significant difficulties are formulating an iteration procedure to handle the nonlinearities. This is done by applying quasilinearization (the NewtonKantorovich procedure—see, e.g., Ames [7] and references therein). The solution filtering procedure is invoked at every time step of the calculations. In each time step, an unfiltered solution is obtained upon completion of the nonlinear iterations. Unlike usual numerical simulation procedures, this solution is not employed as the initial condition of the next time step. It is first filtered (spatially), and the resulting filtered solution is then utilized to start the next time step. In recent investigations, three different types of filter have been tested to determine a proper filter for future applications, viz., Shuman filter, Gaussian filter and Fourier sharp cut-off filter. The latter two of these are widely used in standard LES, and the Shuman filter is very simple. It employs dependent variable values in a small neighborhood of grid points in “physical” space to remove the effects of aliasing. The mathematical formula for the Shuman filter is as follows (see Shuman [8]): ui =
ui+1 + βui + ui−1 , 2+β
i = 2, ..., N − 1,
(7)
where β is the filter parameter, and {ui }N i=1 is the grid function. Our numerical results indicate that the Shuman filter is the best of the three filters tested for the solution filtering technique, but the Gaussian filter also works well. Gaussian filters are commonly used in large-eddy simulation of turbulent flows, and take the following form (see Germano [4]): Pm 2 2 ui + j=1 ui−j e−λj + ui+j e−λj ui = , (8) 1 + 2e−λj 2 where λ is a constant parameter. It should be noted that the Gaussian filter cannot be applied to grid points near the boundary if the value of the filter width m is larger than 1. To solve this problem, a smaller value is employed near the boundary while applying larger m at interior grid points. The Fourier sharp cut-off filter is based on fast Fourier transformation of the original variable profile. Let af and bf be the real and imaginary parts, respectively, at wave number λ of the transformed series. For the case of a low-pass filter operation, the new wave number series are obtained as follows: Af = af and Bf = bf ∀ λ < λc , and Af = 0 and Bf = 0 ∀ λ ≥ λc , where λc is the low-pass cutoff wave number. Then the inverse Fourier transformation of the new wave number series is performed to obtain the low-pass filtered variable profile. It should be noted that the Fourier transformation and inversion require considerable amounts of additional CPU time since they are applied at every time step. Therefore, the Fourier sharp cut-off filter is not a good candidate for solution filter technique. In addition, results produced by it are inferior to those of the Shuman and Gaussian filters in the present context. This will be briefly discussed in the next section.
SOLUTION FILTERING TECHNIQUE FOR SOLVING BURGERS’ EQUATION
955
4. Numerical Results and Discussion. Numerical solutions of Burgers’ equation (1) obtained by employing the solution filtering technique are compared with either exact solutions or the numerical solutions calculated via DNS with a very fine grid (8192 points). Since the Shuman filter works better than the other two filters, for brevity, our discussions will focus on results obtained by using this filter. However, to facilitate comparison, some of the results computed with the other filters are also presented. It should be emphasized that there may be other filters that work better than the Shuman filter does, and further studies are expected to identify the best filter for a given application. The first numerical simulation is conducted under boundary and initial conditions (5) with a = 0.8 and b = 1.8. The nonhomogeneous function P is Eq. (2) with α = 1.0 and M = 500. The Reynolds number is Re = 105 . The time step size is set to be ∆τ = 10−5 . (To ensure accuracy and stability of the numerical solutions, the time step size for all the numerical simulations in the present study is ∆τ = 10−5 unless otherwise specified.) Different numbers of grid points Nx are selected to perform the numerical calculations by employing two different methods; i) DNS without filter and ii) the solution filtering technique. We have used Nx = 512, 1024, 2048, 4096, and 8192. The DNS results show that, if Nx ≤ 4096, the numerical solutions blow up after a certain number of time steps; the numerical simulation procedure goes smoothly only when Nx ≥ 8192. If the solution filtering technique is employed, the numerical simulation can be conducted on all of the abovementioned grids. 5 Figure 2 compares the numerical reAnalytical Solution Eq. (5) Filtered numerical solution sults obtained on a 512-point grid em2 ploying the solution filtering technique with the exact solution, Eq. (6). In this case, the Shuman filter parameter −1 is chosen to be β = 100. Figure 2(a) (a) shows the distribution of u in space at −4 0.8 1.0 1.2 1.4 1.6 1.8 τ = 0.3 while Fig. 2(b) is the time series Scaled Length (Arbitray Units) at x = 0.925. Both figures demonstrate 5 Analytical Solution Eq. (5) Filtered numerical solution that the numerical simulations with the solution filtering technique have cap2 tured most of the large-scale oscillations of the exact solution. The only signif- −1 icant differences between the numerical results and exact solution exist in −4 (b) 0.0 0.2 0.4 0.6 0.8 1.0 the regions around x ≈ 1.05 in space Scaled Time (Arbitray Units) and τ ≈ 0.42 in time. Such differences represent a phase reversal between the Fig. 2 Comparison of numerical solutions on numerical and exact solutions. Magni512 point grid (β = 100) with the exact solutudes of the oscillations remain approx- tion. (a) Spatial distribution of u at τ = 0.3. imately the same for the two solutions. (b) Time series of u at x = 0.925. Considering the fact that the number of grid points employed in Fig. 2 is less than a tenth of that required by DNS, the results shown here are quite encouraging. Numerical simulations with different values of filter parameter show that as this value decreases more small-scale oscillations are removed, resulting in greater stability of the numerical simulation procedure. At the same time, the difference of 5
4
3
2
u
1
0
-1
-2
-3
-4
0.8
1
1.2
1.4
1.6
1.8
0.2
0.4
0.6
0.8
1
5
4
3
u
2
1
0
-1
-2
-3
-4
0
956
TIANLIANG YANG AND J. M. MCDONOUGH
u
the large-scale motion between the numerical and exact solution increases, 5 Analytical Solution Eq. (5) (a) consistent with this. Figure 3 shows Filtered numerical solution a comparison of numerical results com2 puted with β = 20 on a 512-point grid and the exact solution. The spatial dis−1 tributions of u at τ = 0.3 and τ = 0.8 are shown in Figs. 3(a) and (b), respec−4 Analytical Solution Eq. (5) (b) tively. By comparing Fig. 3 with Fig. Filtered numerical solution 3 2(a), the effects of β mentioned above are clearly observed. 1 The Gaussian filter has also been used −1 in numerical simulations employing the solution filtering technique; but it does −3 0.8 1.8 1.2 1.4 1.6 1.8 not work as well as does the Shuman Scaled Length (Arbitray Units) filter. Therefore, the presentation of Fig. 3 Comparison of numerical solutions on the numerical results with the Gauss- 512-point grids obtained using Shuman filter ian filter will be confined to only one (β = 20) with the exact solution. (a) Spaexample. Figure 4 shows some numer- tial distribution of u at τ = 0.3. (b) Spatial ical results obtained by employing the distribution of u at τ = 0.8. Gaussian filter in the numerical simulation procedure. The filter parameters 5 Analytical Solution Eq. (5) are λ = 4.0 and m = 3. Numerical simNumerical solution with filter ulations were also conducted with other 2 parameter values (λ = 3.5, m = 2; λ = 4, m = 10; λ = 5, m = 10, −1 and λ = 4, m = 5). The numerical results presented in Fig. 4 are the (a) −4 best obtained in these investigations. Analytical Solution Eq. (5) Numerical solution with filter These were computed on a 512-point 3 grid as were the Shuman filter results, 1 and two spatial distributions of u at τ = 0.3 and τ = 0.8 are shown. It is −1 observed that the numerical data fol(b) −3 low the large-scale motions of the ex0.8 1.8 1.2 1.4 1.6 1.8 act solutions in most areas. However, Scaled Length (Arbitray Units) there are more discrepancies apparent Fig. 4 Comparison of numerical solutions than was the case with the Shuman fil- on 512 grids obtained using Gaussian filter ter. Moreover, the Gaussian filter has (λ = 4.0 and m = 3) with exact solution two unknown parameters (viz., λ and Eq. (6) (M = 500 and α = 1.0). (a) Spam) that must be determined either the- tial distribution of u at τ = 0.3. (b) Spatial oretically or from experience, resulting distribution of u at τ = 0.8. in more difficulties for the solution filtering technique. Hence, the Gaussian filter is not recommended in the context of solving the N.–S. equations. The Fourier sharp cut-off filter was also tested; its performance was very poor in the context of the solution filtering technique. Thus, all further results presented herein will have been computed with the Shuman filter. To demonstrate the effect of spatial step size in the context of the solution filtering 5 0.8
1
1.2
1.4
1.6
1.8
1
1.2
1.4
1.6
1.8
4
3
2
1
0
-1
-2
u
-3 0.8
SOLUTION FILTERING TECHNIQUE FOR SOLVING BURGERS’ EQUATION
5
Analytical Solution Eq. (5) Numerical solution with filter
2
−1
u
technique, we present the numerical results on grids with Nx = 1024 and 2048 points, shown in Figs. 5 and 6, respectively. These figures show the spatial distributions of u at τ = 0.3 and τ = 0.8. The numerical results in Fig. 5 are obtained with β = 30 on a 1024-point grid while the results in Fig. 6 are computed with β = 15 on 2048 points. We have also employed β = 100, 40, and 2 to perform the simulations on both 1024 and 2048-points grids. It turns out that numerical results obtained with β = 15 to β = 100 exhibit no large differences. Only when β = 2 are more large scale motions removed in the numerical solution. Comparing Figs. 5, 6 with Figs. 2, 3 we can easily observe that, as the spatial step size decreases, more small-scale motions of Burgers’ equation are captured, and the differences of the largescale motions mentioned above are diminished resulting in more accuracy of the numerical results—as should be expected.
957
(a)
−4
Analytical Solution Eq. (5) Numerical solution with filter
3 1 −1 −3
(b) 0.8
1.8
1.2
1.4
1.6
1.8
Scaled Length (Arbitray Units)
Fig. 5 Comparison of numerical solutions on 1024-point grids obtained using Shuman filter (β = 30) with exact solution. (a) Spatial distribution of u at τ = 0.3. (b) Spatial distribution of u at τ = 0.8.
5
Analytical Solution Eq. (5) Numerical solution with filter
2
−1
u
The numerical simulations for different Reynolds number Re were con(a) −4 Analytical Solution Eq. (5) ducted by ranging Re between Re = Numerical solution with filter 3 7 10 and 10 . The simulated results 3 show that, as the Reynolds number 1 changes within the range investigated, neither the numerical results nor the −1 value of the filter parameter needed to (b) −3 obtain them changed significantly due 0.8 1.8 1.2 1.4 1.6 1.8 Scaled Length (Arbitray Units) to the fact that the exact solution remains the same, independent of the Fig. 6 Comparison of numerical solutions on value of Re. This was by design; we 2048-point grids obtained using Shuman filwere interested in focusing specifically ter (β = 15) with exact solution. (a) Spatial on the interaction of the filter with distribution of u at τ = 0.3. (b) Spatial distribution of u at τ = 0.8. aliasing of the computed solution. For the Navier–Stokes equations, the solution changes when Reynolds number changes, and the filter parameter should be changed to capture the maximum large-scale motions of the governing equations for a given number of grid points. In this case, more analysis is needed to establish the relationship between the filter parameter and Reynolds number; for details of this, readers are referred to [6]. To mimic simulation of the N.–S. equations in practical applications, computations were conducted with constant boundary and initial conditions (4), with values
TIANLIANG YANG AND J. M. MCDONOUGH
2.5 2.0
Filtered numerical solution on 512 point grid DNS results on 8192 point grid 3
1.5
u
of a and b the same as those in the first and second numerical simulations. Evidently, the exact solution in this case is not available. An accurate numerical solution is required to compare with the numerical results obtained by employing the solution filtering technique. To fulfill this requirement, DNS is conducted on a very fine grid system. The number of grid points is 8192 for this simulation, and the numerical result is taken as the most accurate solution of Eq. (1) under the constant boundary and initial conditions (4). The problem with this is that the DNS solution on 8192 grid points is still unstable if the nonhomogeneous function of P Eq. (3) uses M = 500 and α = 0.7 or α = 1.0. To avoid this problem, the nonhomogeneous function P is chosen to be Eq. (3) with M = 500 and α = 0.7, but divided by 2000. The calculations show that this smaller driving force is stable.
1.0 0.5
1
0
0.0 -2
−0.5 −1.5
-3
(a) 0.8
1
0.8
1.0
1.2
1.4
1.6
1.2
1.4
1.6
1.8
0.8
1.0
Scaled Length (Arbitray Units) 2.5
Filtered numerical solution on 512 point grid DNS results on 8192 point grid
1.5
u
958
0.5 −0.5 −1.5 −2.5
(b) 0.0
0.2
0.4
0.6
Scaled Time (Arbitray Units)
Fig. 7 Comparison of numerical solutions on 512-point grid obtained using Shuman filter (β = 100) with DNS results. (a) Spatial distribution of u at τ = 0.3. (b) Time series of u at x = 0.925.
Figure 7 compares the numerical results obtained by employing the solution filtering technique with the DNS results on an 8192-point grid. The filter parameter adopted is 10. The numerical simulations employing the filter technique are conducted on 512-point grid as before. The two parts of Fig. 7 illustrate the spatial distribution of u at τ = 0.3 and the time series at x = 0.925. It is observed that numerical solutions on the coarse grid are quite satisfactory, indicating that the solution filtering technique is successful also in this second case. 5. Concluding Remarks. A Solution filtering procedure for treating aliasing in the presence of under resolution of a discrete approximation to a nonlinear partial differential equation is tested through solving Burgers’ equation. In order to address the validity of this technique for solving the N.–S. equations, an exact solution of Burgers’ equation was designed so as to be similar to an actual turbulent velocity component as would occur for high-Re N.–S. flows. The numerical results of solution filtering were compared with the exact solution and found to be quite satisfactory. Three different filters were employed, and it was found that the Shuman filter provided results that were superior to those of either a Gaussian filter or a Fourier sharp cut-off filter. The influence of the filter parameter value was also investigated; it was discovered through numerical experiments that proper choice of this parameter is important, but once it is in the correct range quantitative features of computed results are not extremely sensitive to its value. Nevertheless, it is clear that an automatic procedure for setting the parameter value would be a significant advantage in implementing the solution filtering procedure. This is the topic of investigations to be reported later.
SOLUTION FILTERING TECHNIQUE FOR SOLVING BURGERS’ EQUATION
959
Acknowledgements The financial support from AFOSR under Grant #F49620–
00–1–0258 is gratefully acknowledged by the authors. Work of T. Yang has been partially supported also by the University of Kentucky Center for Computational Sciences. In addition, the authors are grateful to the University of Kentucky Computing Center for use of their HP N-4000 and HP SuperDome computers for all required calculations. REFERENCES [1] J. M. McDonough and R. J. Bywater, Large-scale effects on local small-scale chaotic solutions to Burgers’ equation, AIAA Journal (12) 24 (1986) 1924–1930. [2] M. D. Love, Subgrid modelling studies with Burgers’ equation, J. Fluid Mech. 100 (1980), 87–110. [3] J. M. McDonough, Y. Yang and E. C. Hylin, Modeling time-dependent turbulent flow over a backward-facing step via additive turbulent decomposition and chaotic maps, Proc. First Asian CFD Conf. Hui, Kwok & Chasnov (Eds.), Hong Kong University of Science and Technology, Hong Kong, (1995) 747–752. [4] M. Germano, Turbulence: the filtering approach, J. Fluid Mech. 238 (1992), 325–336. [5] J. Qian, Numerical experiments on one-dimentional model of turbulence, Phys. Fluids (8) 27 (1984), 1957–1965. [6] J. M. McDonough and T. Yang, Solution filtering technique for solving turbulent flow problems (in preparation). [7] W. F. Ames, “Numerical Methods for Partial Differential Equations,” Academic Press, New York, NY, 1977. [8] F. G. Shuman, Numerical method in weather prediction: smoothing and filtering, Mon. Weath. Rev. 85 (1957), 357–361.
Received September 2002; in revised March 2003. E-mail address:
[email protected]