SOLUTIONS TO PROJECT MANAGEMENT ASSIGNMENT PROBLEMS. 3.3.
Critical path is A–C–F–H. Time = 21 days. This is an AON network. 3.9 (a) AON ...
SOLUTIONS TO PROJECT MANAGEMENT ASSIGNMENT PROBLEMS
3.3
Critical path is A–C–F–H. Time = 21 days. This is an AON network.
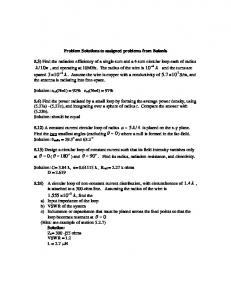
3.9
(a) AON Network
(b) AOA Network
3.14 (a)
Activity
a
m
b
Expected
Variance
A B C D E F G H I J K
3 2 1 6 2 6 1 3 10 14 2
6 4 2 7 4 10 2 6 11 16 8
8 4 3 8 6 14 4 9 12 20 10
5.83 3.67 2.00 7.00 4.00 10.00 2.17 6.00 11.00 16.33 7.33
0.69 0.11 0.11 0.11 0.44 1.78 0.25 1.00 0.11 1.00 1.78
(b,c) Activity A B C D E F G H I J K
Time 5.83 3.67 2.00 7.00 4.00 10.00 2.17 6.00 11.00 16.33 7.33
ES 0.00 0.00 0.00 2.00 9.00 13.00 13.00 23.00 15.17 2.00 29.00
EF 5.83 3.67 2.00 9.00 13.00 23.00 15.17 29.00 26.17 18.33 36.33
LS 7.17 5.33 0.00 2.00 9.00 13.00 15.83 23.00 18.00 20.00 29.00
LF 13.00 9.00 2.00 9.00 13.00 23.00 18.00 29.00 29.00 36.33 36.33
Slack Critical 7.17 No 5.33 No 0.00 Yes 0.00 Yes 0.00 Yes 0.00 Yes 2.83 No 0.00 Yes 2.83 No 18.00 No 0.00 Yes
The critical path is given by activities C, D, E, F, H, K. Average project completion time is 36.33 days.
(d)
Expected completion time for the project is 36.33 days.. Project variance Sum of variances of activities on critical path 0.11 0.11 0.44 1.78 1.00 1.78 = 5.22. Standard deviation = 2.28
3.17
a) Estimated (expected) time for C [8 (4 12) 16]/6 72/6 12 weeks 2
16 (16 8) (b) Variance for C is 9 1.78 6 (c) Critical path is A–C–F–H–J–K (d) Time on critical path 7.67 12 9.67 2 6.67 2.17 40.17 weeks (rounded) (e) Variance on critical path 1 1.78 5.44 0 1.78 0.03 10.03 36 40.17 (f) Z = = –1.32, which is about 9.6% chance 3.17 (.096 probability) of completing project before week 36. Note that based on possible rounding in part (d)—where time on critical path could be 40.3—the probability can be as low as 8.7%. So a student answer between 8.7% and 9.6% is valid.
Summary table follows: Activity
3.18
Activity Time
Early Start
Early Finish
Late Start
Late Finish
Slack
Standard Deviation
A B
7.66 9.66
0 7.66
7.66 17.33
0.0 8
7.66 17.66
0 0.33
1 3.66
C D
12 6.33
7.66 7.66
19.66 14
7.66 25
19.66 31.33
0 17.33
1.33 1
E F
2 9.66
17.33 19.66
19.33 29.33
17.66 19.66
19.66 29.33
0.33 0
0.33 2.33
G H I J K
3 2 6 6.66 2.16
19.66 29.33 29.33 31.33 38
22.66 31.33 35.33 38 40.17
28.33 29.33 32 31.33 38
31.33 31.33 38 38 40.17
8.66 0 2.66 0 0
0.33 0 0 1.33 0.17
Critical path C–E at 12 days. Activity
Maximum Crash
Daily Crash Costs $100 50 100 150 200
A B C D E
1 day 2 days 1 day 2 days 3 days
To crash by 4 days, from 12 days to 8 days:
Crash C by 1 day ($100) to 11 days total Now crash E by 1 day ($200) and A by 1 day ($100) to 10 days total. Now crash E by 2 days ($400) and D by 2 days ($300) to 8 days total. Total additional cost to crash 4 days $1,100.
3.25
(a)
Task
Project completion time = 14 weeks ES EF LS LF Time
A B C D E F G
3 2 1 7 6 2 4
0 0 0 3 2 1 10
3 2 1 10 8 3 14
0 2 11 3 4 12 10
Slack
3 4 12 10 10 14 14
0 2 11 0 2 11 0
(b) To crash to 10 weeks, we follow 2 steps: Step 1: crash D by 2 weeks ($150) Crash D and E by 2 weeks each ($100 150) Total crash cost $400 additional (c) Using QSB for Windows software, minimum project completion time 7. Additional crashing cost = $1,550.
A B C D E F G
Normal Time
Crash Time
Normal Cost
Crash Cost
3 2 1 7 6 2 4
2 1 1 3 3 1 2
1,000 2,000 300 1,300 850 4,000 1,500
1,600 2,700 300 1,600 1,000 5,000 2,000
Crash Crash Cost/Pd By 600 700 0 75 50 1,000 250
1 0 0 4 3 0 2
Crashing Cost 600 0 0 300 150 0 500
******