Chem. Res. Chin. Univ., 2017, 33(4), 648―654
doi: 10.1007/s40242-017-6493-3
Solvothermal Synthesis of Magnetic Fe 3O4 Nanospheres and Their Efficiency in Photo-Fenton Degradation of Xylenol Orange ZHENG Kai1, DI Mingyu1, ZHANG Jubo1, BAO Wenhui1, LIANG Daxin1* , PANG Guangsheng2, FANG Zhenxing2 and LI Chunyuan1 1. College of Materials Science and Engineering, Northeast Forestry University, Harbin 150040, P. R. China; 2. State Key Laboratory of Inorganic Synthesis and Preparative Chemistry, College of Chemistry, Jilin University, Changchun 130012, P. R. China Abstract Magnetic Fe 3O4 nanospheres with a average diameter of (201±0.5) nm were synthesized at 200 °C via a solvothermal method. The as-synthesized Fe3O4 nanospheres performed an efficiency in the Fenton degradation of xylenol orange with a degradation rate of 90%—95%. Additionally, the catalyst was easily recyclable and the recovery rate was greater than 90%. Moreover, the catalyst could be regenerated under an ultrasonic treatment, and the degradation performance remained essentially the same. More importantly, the degradation rate varied with respect to the amount of H 2O2 and the pH of the best reaction process. And the reaction efficiency was achieved with 1.5 mL of H2O2 in an acidic environment. Keywords Magnetic; Fe3O4 nanosphere; Fenton degradation; Solvothermal synthesis; Xylenol orange
1
Introduction
Magnetic materials have been widely investigated for their excellent performance in various applications. Among them, Fe3O4 has attracted considerable attention for its inverse spinel structure and face-centered cubic lattice[1]. Under mild conditions, the crystal faces of Fe3O4 grow and then disappear synchronously. As one of the most important magnetic materials, Fe3O4 has superparamagnetic magnetic and photocatalytic properties. Thus, Fe3O4 nanocrystals have been widely applied in photocatalysis[2,3], biomedicine[4], magnetic storage devices[5] and separation processes[6—8]. Industrial activities generate wastewaters involving a wide variety of contaminants, such as phenol, phenolic derivatives, hydrocarbons, halides, sulfides, nitrogen-containing organic compounds and heavy metals in the form of cyanides and other organic complexes[9]. Traditional treatment methods(physical adsorption, reverse osmosis, biodegradation, etc.) cannot degrade organic pollutants in an effective and economical manner. As a result, more and more new treatment methods have emerged and attracted broad research interest [10—12]. Recently, advanced oxidation processes have been considered as promising alternative strategies for wastewater treatment, especially for persistent and non-biodegradable contaminants[13,14].
The Fenton process is an advanced oxidation technique for the degradation of organic pollutants, especially organic dyes in wastewater[15—17]. Fenton catalysts containing Fe3O4 have significant advantages over traditional Fenton reagents, because they can be easily separated from the reaction system[13]. Consequently, Fenton degradation has now been adopted for a wide range of applications(e.g., organic dyes[18,19], or other organic pollutants[20,21]). Eqs.(1) and (2) describe the mechanisms for hydroxyl radical(HO•) generation from hydrogen peroxide(H2O2) by ferrous(Fe2+) ions via a complex reaction sequence[22,23]: H2O2 + Fe2+ → Fe3+ + HO• + OH− (1) Fe3+ + H2O2 → Fe2+ + HO• + H+ (2) The following equations[Eq.(3)—Eq.(9)] describe the mechanisms of photo-Fenton degradation. In the presence of an organic compound(R), HO• removes a hydrogen atom from R and an organic radical(R•) can be generated, which subsequently undergoes a series of chemical transformation to form various oxidation products. In principle, HO• can completely convert all organic compounds into CO2 and H2O[22]. However, the narrow pH range and the precipitation of iron limit the practical applications of Fenton systems [16]. Fe(OH)62+ + hν → Fe2+ + HO• (3) Fe(OH)63+ + hν → Fe2+ + HO• + H+ (4)
——————————— *Corresponding author. E-mail:
[email protected] Received December 16, 2016; accepted March 3, 2017. Supported by the National Natural Science Foundation of China(No.31400497), the Fundamental Research Funds for the Central Universities, China(No.2572017BB14), the Heilongjiang Postdoctoral Financial Assistance, China(No.LBH-Z13001), the General Financial Grant from the China Postdoctoral Science Foundation, China(No.2014M561311) and the Open Project of State Key Laboratory of Inorganic Synthesis and Preparative Chemistry, China(No.2016-24). © Jilin University, The Editorial Department of Chemical Research in Chinese Universities and Springer-Verlag GmbH
No.4
ZHENG Kai et al. •
H2O2 + hν → HO (5) H2O2 + HO• → •OH2 + H2O (6) RH + HO• → R• + H2O (7) (8) R• + O2 → RO2• • RO2 + H2O → Further reaction (9) The photo-Fenton system is an advanced oxidation process applied in the treatment of wastewaters containing a large variety of organic pollutants. And it has attracted global interest because of its high reaction rate, low toxicity, and high recovery rate[24]. The photo-Fenton system utilizes ultraviolet(UV) irradiation in the Fenton reaction, which can enhance the oxidation rate of organic compounds and enlarge the pH range of the oxidation medium[25]. Thus, less iron is needed for the wastewater treatment using a photo-Fenton process. The degradation rate of dyes can be considerably increased when the photo-Fenton system is irradiated with UV light[23,24]. The photo-Fenton process(Fe2+/H2O2/UV) involves the reaction between dissolved Fe 2+ and H2O2 in reaction system, leading to the oxidation of Fe2+ to Fe3+ and the production of HO•[26,27]. Additionally, it has shown the efficiency in minimizing the sludge formation and enlarging the pH range[28]. Recently, Fe3O4 nanocrystals have been used as a Fenton’s reagent, which have attracted increasing attention from researchers around the world. Fe3O4 nanocrystals can be synthesized by many methods, such as sol-gel method[29], hydrothermal method[30—32], micro-emulsion method[33,34] and solvothermal method[35,36]. Among those methods, solvothermal synthesis is adopted most frequently because of its good product dispersion[37]. Herein we intensively investigated the catalytic activities of the as-synthesized Fe3O4 nanospheres in the photo-Fenton reaction of xylenol orange(XO). The results indicate that the pH value, the amount of H2O2 in the reaction system, and the initial ratio of reactants all play important roles in the Fenton process. The degradation rate under optimized conditions can be over 90%. More importantly, the catalysts can be recycled with a high recovery rate and the degradation rate of the recycled catalysts is almost the same after recovery.
2
Experimental
2.1 Materials Ferric chloride hexahydrate(FeCl 3·6H2O) was purchased from Tianjin Cineng Guangfu Science and Technology Co., Ltd. Anhydrous sodium acetate(CH3COONa), XO and hydrogen peroxide(H2O2, 30%, mass frction) were purchased from Tianjin Kemiou Chemical Reagent Co., Ltd.(Tianjin, China). Ethylenediamine(NH2CH2CH2NH2), glycol, and anhydrous ethanol were purchased from Shanghai Fuyu Chemical Products Co., Ltd.(Shanghai, China). All the chemicals were of analytical reagent grade and used without further purification.
2.2 Synthesis of Fe3O4 Nanospheres All experiments were conducted in masked glass beakers
649
at room temperature(25 °C). In a typical synthesis, FeCl3·6H2O and CH3COONa were dissolved into 48 mL of glycol, followed by the adding of ethylene diamine(5 mL or 10 mL) with magnetic stirring until a clear orange solution was formed. Then, the solution was transferred and sealed in a Teflon-lined stainless steel autoclave and allowed to react at 200 °C for 6 h. The products were separated using a magnet, washed twice with distilled water and anhydrous ethanol, and then dried in vacuum at 70 °C for 1 h.
2.3
Photo-Fenton Process
The photo-Fenton activities for the as-synthesized Fe3O4 nanospheres catalysts were evaluated by photo-Fenton degradation of XO in aqueous solution under irradiation(Hg lamp, 100 W). Fe3O4 nanospheres(20 mg) were added to 200 mL of XO aqueous solution(20 mg/L) and stirred in the dark for 15 min; then, 1 mL of H2O2(30%) was added, and the reacting solution was collected every 10 min until an elapsed time of 150 min was achieved. After the degradation process, the catalysts were separated using a magnet, washed by distilled water twice with nhydrous ethanol, and then dried in vacuum at 70 °C for 1 h.
2.4 Optimization of Experimental Conditions The influencing factors for the catalytic activity during the degradation of XO were evaluated based on the initial ratio of reactants, the amount of H2O2 added(30%) and the pH of the reaction system.
2.5 Charaterization Methods The crystal structure of the as-synthesized sample was characterized by means of X-ray diffraction(XRD) on a Rigaku D/max 2200V/PC X-ray diffractometer(Cu Kα, λ=0.15418 nm). The X-ray photoelectron spectra(XPS) were obtained on a Thermo X-ray photoelectron spectrometer with Al Kα as radiation. The chemical bonds on the surface of the catalyst were detected by means of Fourier transform infrared(FTIR) spectroscopy on a Nicolet Magna-IR 560 spectrometer. The size and morphology of the samples were determined on a Hitachi H-7650 transmission electron microscope(TEM), operated at an accelerating voltage of 100 kV. The degradation of XO was evaluated on a Beijing Puxi TU-1901 UV-visible spectrophotometer.
3
Results and Discussion
3.1 XRD Analysis As shown in Fig.1, the characteristic peaks at 30.10°, 35.32°, 42.86°, 53.48°, 56.96° and 62.44° correspond to the crystal faces of (220), (311), (400), (422), (511) and (440) planes, respectively. These peaks are consistent with the reference data set(JCPDS No.75-0033[38]). Thus, the sample can be indexed to face-centered cubic Fe3O4(lattice parameter a=0.9000 nm and space groups Fd-3m[227])[39—41]. No peaks corresponding to impurities are present, indicating a
650
Chem. Res. Chin. Univ.
high-purity sample. The mean crystalline size of the Fe 3O4 nanostructures was calculated to be about 7.6695 nm based on the Scherrer-formula.
Vol.33
Furthermore, no satellite peaks around 719.0 eV can be identified, indicating the absence of γ-Fe2O3[43].
Fig.2 XPS spectrum of the as-synthesized Fe3O4 Fig.1 XRD patterns of samples synthesized with different initial reactant ratios m(FeCl3·6H2O):m(NH2CH2CH2NH2):m(CH3COONa): a. 1:10:3; b. 1:5:4; c. 1:10:4; d. 1:5:5.
3.2 XPS Analysis Fe3O4 has an inverse spinel structure similar to that of γ-Fe2O3; therefore, the XRD results cannot provide sufficient evidence to confirm the formation of Fe3O4[42]. As a result, XPS measurements were also performed. As shown in Fig.2, the peaks at 724.1 and 710.5 eV can be assigned to Fe 2p1/2 and Fe2p3/2, which are consistent with the reported data for Fe3O4.
Fig.3
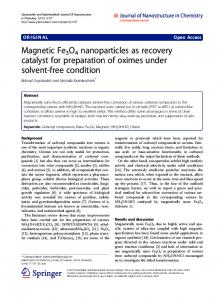
3.3 TEM Analysis The morphology and size distribution of the as-synthesized Fe3O4 nanospheres were investigated by TEM. Fig.3 shows that the as-synthesized Fe3O4 particles have a sphere-like morphology with diameters ranging from 140 nm to 240 nm[44] and an average diameter of (201.5±0.5) nm. The high-resolution TEM image[Fig.3(D)] shows that the distances between different crystal faces in the two directions are 0.2540 and 0.2976 nm, which correspond to the characteristic (311) and (220) peaks in the XRD pattern for cubic-Fe3O4 nanospheres. The size of the Fe3O4 nanospheres is consistent with the value calculated from the XRD results.
TEM images of the sample with low(A) and high(B) magnifications, distribution of sample particle sizes[average diameter: (201.2±0.5) nm](C) and high-resolution TEM image of the typical sample(D) (primary amine). The characteristic broad band at 3500 cm–1 is 3.4 FTIR Analysis attributed to O—H stretching, originated from the reactants containing glycol. However, FTIR spectra could not deterThe Fe3O4 nanospheres were further examined by FTIR mined if the as-synthesized Fe3O4 nanospheres were successspectroscopy(Fig.4). The strong absorption at 580 cm–1 fully modified with ethylene diamine. The FTIR results indi[45—47] indicates Fe3O4 . Two characteristic peaks at 1598 and cate that the hydrophilicity, inoxidizability, and monodispersity –1 770 cm are attributed to N—H vibrations(primary amine), of the Fe3O4 nanospheres are enhanced. –1 and the peak at 1210 cm is attributed to C—H vibrations
No.4
ZHENG Kai et al.
651
Fe3O4 nanospheres synthesized based on this reactant condition provide the best degradation efficiency. The total specific surface area of the Fe3O4 nanospheres is enhanced, increasing the possibility of contacting with dye molecules. In addition, the uniformity of the Fe3O4 nanospheres can be ensured homogeneous[43].
Fig.4 FTIR spectrum of the sample
3.5 Photo-Fenton Degradation of XO In our previous study, XO was hardly degraded after 150 min when only hydrogen peroxide and Fe 3O4 nanospheres were used without UV-irradiation, as shown in Fig.S1 and Fig.S2(see the Electronic Supplementary Material of this paper). Therefore, it can be confirmed that the degradation of XO can be due to the Fenton reaction. The UV-Vis spectra of the degraded XO aqueous solutions were measured. The degradation rate of XO with various reaction time was elucidated and the results are shown in Fig.5. It is clear that XO has been degraded by 90% when the photo-Fenton reaction proceeds for 10 min, and the high degradation rate remains constant during the first 30 min. The degradation rate of XO could reach 96.68% when the photo-Fenton reaction proceeds for 150 min.
Fig.5 Degradation rate of xylenol orange during the photo-Fenton process using the as-synthesized Fe3O4 nanospheres
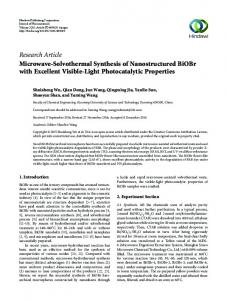
3.6 Influence of Initial Reactant Ratio on PhotoFenton Degradation of XO Initial reactants ratio has an important influence on the degradation of pollutants in heterogeneous photo-Fenton reaction process. As shown in Fig.S3(see the Electronic Supplementary Material of this paper), the degradation rate of XO can be over 80% after 150 min of photo-Fenton reaction in the presence of Fe3O4 nanospheres synthesized with all initial reactant ratios. Fig.6 indicates that the catalyst recipe significantly influences the degradation of XO. The catalyst provides the best XO degradation rate in the photo-Fenton reaction when m(FeCl 3·6H2O):m(CH3COONa):m(NH2CH2CH2NH2)=1:3:10. As shown in Fig.7, the particle size distribution and uniformity turn out to be the best when the initial mass ratio of reactants is FeCl3·6H2O:CH3COONa:NH2CH2CH2NH2=1:3:10. Thus, the
Fig.6 Variation of degradation rate during the photoFenton degradation of XO by Fe3O4 nanospheres synthesized based on different initial reactant ratios Initial mass ratio of FeCl3·6H2O:CH3COONa:NH2CH2CH2NH2: a. 1:3:10; b. 1:4:5; c. 1:4:10; d. 1:5:5.
Fig.7 SEM images of Fe3O4 synthesized based on by difference initial reactant ratios Initial mass of reactants FeCl3·6H2O:CH3COONa:NH2CH2CH2NH2: (A) 1:3:10; (B) 1:4:5; (C) 1:4:10; (D) 1:5:5.
3.7 Influence of H2O2 Concentration on Photo-Fenton Degradation of XO The effect of the H2O2 concentration on the degradation of XO was examined via varying the initial amount of H2O2 within the range of 1.0—1.7 mL and the results were evaluated using UV-Vis spectroscopy[Fig.S4(see the Electronic Supplementary Materials of this paper) and Fig.8]. As the amount of H2O2 in the reaction system increases from 1.0 mL to 1.5 mL, the degradation rate of XO increases from 70% to 90%. Nevertheless, the degradation rate decreases from 90% to 70% when the concentration of H2O2 is further increased. The increase of H2O2 in the reaction solution could generate more HO• radicals and thus enhance the degradation rate of XO.
652
Chem. Res. Chin. Univ.
Vol.33
•
However, coupling termination of HO radicals occurs when the amount of H2O2 is higher than 1.6 mL, resulting in the decrease of degradation rate. Simultaneously, a high H2O2 concentration acts as a scavenger of HO• radicals, forming less reactive species, such as •OOH. This effect reduces the probability of the attack of XO molecules by HO• radicals and can reduce the degradation rate[48]. As shown in Fig.8, this coupling effect becomes more noticeable at shorter reaction time.
3.9 Catalytic Activity Analysis Photo-Fenton degradations for organic pollutants are often described in terms of Langmuir-Hinshelwood model, which can be simplified to a pseudo-first-order reaction as follows[50]: r = – dc/dt=kc (10) where k refers to the corresponding r(reaction constant), t is the time, c is the sample concentration. Hence, the pseudo-firstorder reaction rate is: –ln(c/c0)=kt (11) where c0 is the initial concentration. As shown in Tables 1—3, the reaction constant matches the optimal reaction conditions. Table 1 Effect of initial reactant ratios on the photo-Fenton reaction of XO* Initial mass ratio of FeCl3·6H2O:CH3COONa:NH2CH2CH2NH2
102 k/min–1
1:3:10
10.09
1:4:5
6.62
1:4:10
6.58
1:5:5
4.80
Fig.8 Variation of the degradation rate during photo-Fenton degradation of XO with different initial amounts of H2O2 Initial amount of H2O2/mL: a. 1.0; b. 1.1; c. 1.2; d. 1.3; e. 1.4; f. 1.5; g. 1.6; h. 1.7.
* Reaction time: 10 min.
Table 2 Effect of amount of H2O2 added on the photo-Fenton reaction of XO*
3.8 Influence of pH on Photo-Fenton Degradation of XO The pH value has a significant influence on the degradation of XO in photo-Fenton reaction process. When pH≤3, the formation of H3O2+ occurs, which would enhance the activity of H2O2 and the HO• radicals have a greater effect on H+. Meanwhile, at pH≥3, the formation of HO• radicals slows down because of the hydrolysis of Fe2+, which would precipitate from the solution[49]. Fig.S5(see the Electronic Supplementary Material of this paper) and Fig.9 show the effect of different pH values on the degradation rate of XO in the presence of the catalyst at pH=1—5. As shown in Fig.S5, a lower pH value can reduce the time required for the reaction to reach equilibrium, and the degradation rate of XO reaches 75% even at pH=4 and 5 after 150 min. This indicates that Fe 3O4 nanospheres can overcome the drawbacks of a narrow pH range during the Fenton reaction, which makes them promising candidates for the degradation rate of XO in wastewater.
Variation of degradation rate during photoFenton degradation of XO at different pH values Initial pH value: a. 1; b. 2; c. 3; d. 4; e. 5.
102 k/min–1
1.0 1.1
2.67 3.12
1.2
4.87
1.3
5.27
1.4
5.82
1.5
11.89
1.6
2.46
1.7
2.32
* Reaction time: 10 min.
Table 3 Effect of pH value on the photo-Fenton reaction of XO* pH value
102 k/min–1
1
18.14
2
18.89
3
6.91
4
5.44
5
5.01
* Reaction time: 10 min.
3.10
Fig.9
V(H2O2 added)/mL
Recovery Efficiency
The recovery rates and degradation efficiencies of the recycled catalysts are shown in Table 4 and Fig.10. The recovery rates are greater than 85%. More importantly, the degradation rates of the recycled catalysts almost remain the same. As shown in Fig.S6(see the Electronic Supplementary Material of this paper), the crystal structure of samples after 10 recoveries remains the same as that of the freshly synthesized sample, which demonstrates that the Fe3O4 nanospheres play the role of a catalyst in the Fenton reaction process. This result confirms the high stability of the catalyst, which indicates its practical use for wastewater treatment. As shown in Fig.3 and Fig.6, the solvothermal synthesis
No.4
ZHENG Kai et al.
653
Table 4 Recovery rates and degradation efficiencies of the recycled catalyst
After the reaction
Recovery rate(%)
Absorbance of original XO solution/a.u.
Absorbance of photo-Fenton degradation reaction of XO for 150 min/a.u.
Degradation rate(%)
15.1 12.2
12.2 10.3
80.57 84.19
0.414 0.435
0.056 0.058
95.28 95.40
3
10.3
8.4
81.27
0.435
0.061
95.40
4
8.4
6.1
74.80
0.435
0.064
95.18
5
6.3
6.2
96.67
0.438
0.064
94.38
6
6.1
5.9
96.57
0.439
0.061
95.30
7
5.9
5.1
86.11
0.435
0.065
94.25
8
5.2
4.2
80.30
0.439
0.062
95.07
9
4.1
3.9
95.10
0.438
0.064
95.58
10
3.9
3.4
92.13
0.438
0.065
95.58
Mass of catalyst/mg
Number of cycle
Before the reaction
1 2
results
4
[50—52]
.
Conclusions
In this work, monodispersed magnetic Fe3O4 nanospheres with diameters of 200 nm were successfully synthesized via a solvothermal method. The as-syntheszed Fe3O4 nanospheres showed excellent photo-Fenton efficiencies for the degradation of XO with the degradation rates being above 90%. More importantly, the catalyst was easily recyclable using only a magnet and ultrasonic treatment with a recovery rate above 85%. After the intensive investigation, the highest degradation rate occurred when the initial mass ratio of the reactants for FeCl3·6H2O:CH3COONa: NH2CH2CH2NH2 was 1:3:10 with 1.5 mL of hydrogen peroxide at pH=1. The sample was also efficient at pH=1—5. Additionally the photocatalysis process had a high efficiency when less H2O2 was added to the reaction. The addition to the reactants was very inexpensive and the experimental operation was very simple. Thus, the as-synthesized Fe3O4 nanospheres are promising candidates for the practical degradation of XO in wastewater. Fig.10 Recovery rate of the catalyst(A) and the efficiency of the recycled catalyst(B) is adopted most frequently because of its convenient feature and the good dispersity of product. As shown in Fig.4, the as-synthesized Fe 3O4 nanospheres have been successfully modified using ethylene diamine. Therefore, the hydrophilicity, inoxidizability and monodispersity of the Fe 3O4 nanospheres are enhanced, which increases the adsorption possibility for XO molecules. As shown in Fig.S6, the crystal structure of the Fe3O4 nanospheres after 10 recoveries remains the same as that of the freshly synthesized sample, which demonstrates that the Fe3O4 nanopheres play the role of a catalyst in the Fenton reaction process. As shown in Table 5, the degradation efficiencies remain at 94.38% in the fifth cycle and 95.48% in the tenth cycle, which are much better than the previous Table 5 Degradation rate of as-synthesized Fe3O4 nanospheres compared to literature result Sample
Degradation rate(%) The first cycle
The fifth cycle
The tenth cycle
Fe3O4 nanospheres S2[51]
95.28 98.06
94.38 89.00
95.48 73.60
S3[52]
95.10
86.30
[50]
100.00
72.00
S4
Electronic Supplementary Material Supplementary material is available in the online version of this article at http://dx.doi.org/10.1007/s40242-017-6493-3.
References [1] Saldivar-Ramirez M. M., Sanchez-Torres C. G., Cortes-Hernandez D. A., Escobedo-Bocardo J. C., Almanza-Robles J. M., Larson A., Resendiz-Hernandez P. J., Acuna-Gutierrez I. O., Journal of Materials Science, Materials in Medicine, 2014, 25, 2229 [2] Ge Y., Xiang Y., He Y., Ji M., Song G., Desalination and Water Treatment, 2015, 57, 9837 [3] Wang Z., Yin L., Chen Z., Zhou G., Shi H., Journal of Nanomaterials, 2014, 2014, 1 [4] Kim J., Lee J. E., Lee S. H., Yu J. H., Lee J. H., Park T. G., Hyeon T., Advanced Materials, 2008, 20, 478 [5] Ding N., Yan N., Ren C. L., Chen X. G., Anal. Chem., 2010, 82, 5897 [6] Emadi H., Nemati Kharat A., Materials Research Bulletin, 2013, 48, 3994 [7] Yang C., Wu J., Hou Y., Chem. Commun., 2011, 47, 5130 [8] Liu X. D., Chen H., Liu S. S., Ye L. Q., Li Y. P., Materials Research Bulletin, 2015, 62, 217
654
Chem. Res. Chin. Univ.
[9] Bautista P., Mohedano A. F., Casas J. A., Zazo J. A., Rodriguez J. J., J. Chem. Technology & Biotechnology, 2008, 83, 1323 [10] Nguyen T. D., Phan N. H., Do M. H., Ngo K. T., J. Hazardous Materials, 2011, 185, 653 [11] Daud N. K., Hameed B. H., J. Hazardous Materials, 2010, 176, 938 [12] Daud N. K., Ahmad M. A., Hameed B. H., Chemical Engineering Journal, 2010, 165, 111 [13] Tian S. H., Tu Y. T., Chen D. S., Chen X., Xiong Y., Chemical Engineering Journal, 2011, 169, 31 [14] Liang D. X., Li J., Pang G. S., J. Mater. Sci., 2016, 51, 5412 [15] Santos M. S. F., Alves A., Madeira L. M., Chemical Engineering Journal, 2011, 175, 279 [16] Xiao J., Wang C., Lyu S., Liu H., Jiang C., Lei Y., Separation and Purification Technology, 2016, 169, 202 [17] Xu L., Wang J., Separation and Purification Technology, 2015, 149, 255 [18] Guo S., Zhang G., Yu J. C., Journal of Colloid and Interface Science, 2015, 448, 460 [19] Cheng H., Chou S., Chen S., Yu C., Journal of Environmental Sciences, 2014, 26, 1307 [20] Fu L., Zhao Z., Ma J., Hu X., Catal. Commun., 2015, 65, 96 [21] Tokumura M., Shibusawa M., Kawase Y., Chemical Engineering Science, 2013, 100, 212 [22] Bokare A. D., Choi W., J. Hazardous Materials, 2014, 275, 121 [23] Pignatello J. J., Oliveros E., MacKay A., Critical Reviews in Environmental Science and Technology, 2006, 36, 1 [24] Torrades F., García-Montaño J., Dyes and Pigments, 2014, 100, 184 [25] Sarrai A., Hanini S., Merzouk N., Tassalit D., Szabó T., Hernádi K., Nagy L., Materials, 2016, 9, 428 [26] Lipczynska-Kochany E., Kochany J., Chemosphere, 2008, 73, 745 [27] Malato S., Fernández-Ibáñez P., Maldonado M. I., Blanco J., Gernjak W., Catalysis Today, 2009, 147, 1 [28] Masomboon N., Chen C. W., Anotai J., Lu M. C., Chemical Engineering Journal, 2010, 159, 116 [29] Sun G., Dong B., Cao M., Wei B., Hu C., Chemistry of Materials, 2011, 23, 1587 [30] Zhang H., Zhu G., Applied Surface Science, 2012, 258, 4952 [31] Mukhopadhyay A., Joshi N., Chattopadhyay K., De G., ACS Applied Materials & Interfaces, 2012, 4, 142 [32] Hu A., Chen X., Tang Q., Zeng B., Ceramics International, 2014, 40, 14713
Vol.33
[33] Ni S., Lin S., Pan Q., Yang F., Huang K., He D., Journal of Physics D: Applied Physics, 2009, 42, 055004 [34] Hojati-Talemi P., Azadmanjiri J., Simon G. P., Materials Letters, 2010, 64, 1684 [35] Huang Y., Zhang L., Huan W., Liang X., Liu X., Yang Y., Glass Physics and Chemistry, 2010, 36, 325 [36] Zhang J., Yao Y., Huang T., Yu A., Electrochimica Acta, 2012, 78, 502 [37] Liang X., Shi H., Jia X., Yang Y., Liu X., Materials Sciences and Applications, 2011, 02, 1644 [38] Xing R., Xu F., Liu S., Niu J., Materials Letters, 2014, 134, 71 [39] Shariatinia Z., Nikfar Z., Inter. J. Biolog. Macro., 2013, 60, 226 [40] Yang Z., Huang R., Qi W., Tong L., Su R., He Z., Chemical Engineering Journal, 2015, 280, 90 [41] Pipit F., Shanty M., Ferry I., Rino R. M., Mikrajuddin A., Research and Development on Nanotechnology in Indonesia, 2014, 1, 23 [42] Zhu L. P., Xiao H. M., Wei D., Yang G., Fu S. Y., Crystal Growth & Design, 2008, 8, 957 [43] Daou T. J., Pourroy G., Bégin-Colin S., Grenèche J. M., Ulhaq-Bouillet C., Legaré P., Bernhardt P., Leuvrey C., Rogez G., Chemistry of Materials, 2006, 18, 4399 [44] Vereda F., Vicente J ., Segovia-Gutiérrez J . P., Hidalgo-Alvarez R., Journal of Applied Physics, 2011, 110, 063520 [45] Cheng Z., Gao Z., Ma W., Sun Q., Wang B., Wang X., Chemical Engineering Journal, 2012, 209, 451 [46] Mishra A. K., Ramaprabhu S., Journal of Materials Chemistry, 2011, 21, 7467 [47] Liu H., Wu J., Min J. H., Zhang X., Kim Y. K., Materials Research Bulletin, 2013, 48, 551 [48] Herney-Ramirez J., Vicente M. A., Madeira L. M., Applied Catalysis B: Environmental, 2010, 98, 10 [49] Guo S., Zhang G., Wang J., Journal of Colloid and Interface Science, 2014, 433, 1 [50] Xia J., Wang A., Liu X., Su Z. X., Applied Surface Science, 2011, 257, 9724 [51] Boruah P. K., Sharma B., Karbhal I., Shelke M. V., Das M. R., J. Hazardous Materials, 2017, 325, 90 [52] Ma J., Guo S., Guo X., Ge H. J., Applied Surface Science, 2015, 353, 1117