acta ethol (2000) 3:15–27
© Springer-Verlag and ISPA 2000
REVIEW
L.J. Fleishman · J.A. Endler
Some comments on visual perception and the use of video playback in animal behavior studies
Received: 10 November 1999 / Received in revised form: 22 February 2000 / Accepted: 2 March 2000
Abstract Video playback experiments are potentially powerful tools in behavioral research. A video screen mimics natural color, brightness, texture, and motion to humans (for which it was designed) because monitors stimulate human photoreceptors in approximately the same relative proportions as the stimuli that they mimic. Because most animals have vision that is very different from that of humans their cones may be stimulated very differently from ours, and an image that looks excellent to us may be unrecognizable to them, and vice versa. In this article we summarize how the simulation of a monitor works and the ways it can go wrong, using a bird and a fish model retina as examples. Finally we make some recommendations for minimizing some of these problems. Key words Video playback · Color vision · Behavioral experiments
Introduction In playback experiments the behavior of a live animal is mimicked by an artificial stimulus, and this is one of the most powerful tools in the study of animal behavior. Until recently the use of playback experiments to study visually based behavior has been hampered by the inherent complexity of visual stimuli and the difficulty of successfully capturing, reproducing, and manipulating visual stimuli – especially when motion is involved. In the last few years sophisticated and relatively inexpensive Communicated by R.F. Oliveira L.J. Fleishman (✉) Department of Biology, Union College, Schenectady, NY 12308-2311, USA e-mail:
[email protected] Tel.: +1 518-388-6332, Fax: +1 518-388-6429 J.A. Endler Department of Ecology, Evolution, and Marine Biology, University of California, Santa Barbara, CA 93106, USA
computer-graphic and video systems have become available, leading to a surge in the use of these techniques (reviewed in D’Eath 1998, Fleishman et al 1998, and other papers in this issue). The appeal and potential of video playback experiments is obvious. However video systems are designed to be viewed by humans and they take advantage of many features specific to human visual perception to produce images that resemble natural scenes. The visual systems of most animals differ from the human visual system in a number of ways, and these differences have the potential to cause a video image that appears realistic to a human viewer to be quite unrealistic to a non-human animal viewer. Most video playback experiments in animal behavior are based on the assumption that the viewing animal reacts to the video image in a manner similar to the way it reacts to a live animal. Thus, understanding differences in the appearance of the live and the video animal may be critical for design and interpretation of experiments. Many of these potential problems and their implications for design and interpretation of video playback studies of animal behavior have been discussed in a detailed review by D’Eath (1998). Similar issues have been raised in other recent papers, including Dawkins and Woodington (1997), Patterson-Kane et al. (1997), Fleishman et al. (1998), and articles in this issue. The aim of this article is to build on these earlier works and elaborate on some aspects of the problems associated with presenting video images to animals. This is not meant to be a complete review, and it is limited to certain aspects of the problem that we feel merit some further discussion.
Video and the perception of color In nature a perceived color pattern is a function of the ambient light reaching the visual stimuli, the reflectance spectra of the stimuli, the transmission spectrum of the medium between the stimuli and the eye, the eye optics, and the way the received light is captured and processed
16
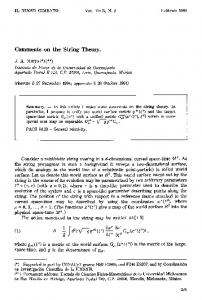
Fig. 1 Cone sensitivity functions as a function of wavelength for humans (A), starlings (B), and guppies (C). Includes optical absorbance of lens and macula for humans, and cornea, lens, and oil droplets for starlings. Cone absorbance functions from Stavenga et al (1993), peak cone absorbance and optical data from Wyszecki and Stiles (1982), Hart et al (1998), and Archer and Lythgoe (1990 and unpublished). For ease of comparison the spectra have been adjusted so that their maxima equal 1.0. Notice how the three species divide up the spectrum differently. Dotted line UV cone; dot/dashed line S (short wavelength) cone; dashed line M (medium wavelength) cone; solid line L (long wavelength) cone
by the viewer’s eyes. It is also influenced by light from the visual backgrounds and particles between the stimulus and the eye (Endler 1978, 1990, 1991, 1993; Lythgoe 1979). The light spectrum (intensity as a function of wavelength) captured by the eye is divided up by one or more photoreceptors, each sensitive to a different but overlapping part of the spectrum (Fig. 1). All visual information is based upon how these photoreceptors divide up the spectrum and their relative outputs (Lythgoe and Partridge 1989). For example, brightness (luminance) is encoded via the sum of the photoreceptor outputs (in vertebrates brightness is frequently only encoded by the long or long and medium cones), and color is encoded by the differences between signals from different kinds of photoreceptors. The most important point is that perceived color depends upon the relative stimulation of each photoreceptor class. Video monitors and photographic film work by stimulating the cones in roughly the same ratios as in real scenes. Because video and film work so well with human vision, we tend to forget that they mimic natural stimulation of our eyes rather than provide replicas of natural stimuli. Species differ in the number of different kinds of photoreceptors and their spectral sensitivity (Fig. 1), and this
Fig. 2 Sample reflectance spectra from live satin (A,B,D) and regent bowerbirds (C,E), and white paint (F; Endler, unpublished data). For ease of comparison the spectra have been adjusted so that their maxima equal 1.0. Human perceptions of these spectra under white light are (A) blue feathers; (B) “fluorescent blue” iris; (C) yellow feathers; (D) green feathers; (E) orange-red feathers; (F) “pure” white. Note that humans cannot detect light below about 400 nm (Fig. 1), so the left peak in C is not perceived and “white” paints (F) are not white at all. Pure white (e.g. BaSO4 powder) would be spectrally flat from 300 to 700 nm rather than dropping off below 400 nm
results in different species experiencing different cone outputs for the same stimulus. This is most easily seen by examples. Consider the six bowerbird feather, iris, and paint stimuli in Fig. 2. We can calculate the cone outputs for each of these spectra under known lighting conditions by multiplying the ambient light spectra times the reflectance spectra times the cone functions at each wavelength and integrating for each cone (Endler 1990, 1991; Chittka 1993; Vorobyev and Osorio 1998). For simplicity we will use white light (irradiance equal at all wavelengths) and have the cones light adapted (Chittka 1993; Vorobyev and Osorio 1998) to a neutral gray background (equal outputs for a white or gray object). The results for the eyes of humans, a bird (starling), and a fish (guppy) are shown in Fig. 3. As can be seen in Fig. 3, the cone outputs provide a crude spectral reproduction of each stimulus, and the relative outputs are characteristic of each stimulus. We will call the relative outputs “cone ratios” for brevity; these are the bases for color perception. Note that the cone ratios of a given stimulus are different among species (e.g. Fig. 3A). This is not surprising because the cones of different species gather different parts of the same spectrum (Fig. 1) so their relative outputs should be different. This will result in among-species differences in information transmitted to the brain as well as possible differences in perception of the same stimulus by different species. For example, the blue in Fig. 2A is coded as a set of declining ratios of the cones and the decline goes at different rates depending on the locations of the cones (Fig. 3). Differences among spe-
17
Fig. 3A–F Cone outputs from data in Figs. 1 and 2 under white light. A–F as in Fig. 2. Each group of bar charts gives the outputs of the cones of human (HU), starling (ST), and guppy (GU) cones. Within species the bars are arranged in the same order as the cone spectra in Fig. 1: U (UV, if present), S, M, and L cones. Calculations were made assuming that the cones were adapted to white light (equal cone outputs to a white or gray surface), and the reflectance spectra in Fig. 2 were first corrected to have the same total reflectance (each integrates to 1.0). Note the different ratios of cone outputs for different spectra for the same species and for the same spectra for different species. Note how humans cannot tell that spectrum (F) is not white
cies are more dramatic when the spectrum is more complex. The blue in Fig. 2B is coded as a relatively strong stimulation of the S (short-wavelength sensitive) and weak stimulation of the M (medium-wavelength) and L (longwavelength sensitive) cones in humans, a reduced S/M ratio in starlings, and a reversed S/M ratio in guppies (Fig. 3B). The presence of the UV cone in starlings and guppies makes the differences between the “blues” from Fig. 2A and B even more dramatic (Fig. 3A,B). To starlings and guppies these two stimuli would probably be perceived as very different hues whereas to humans they are perceived as only a difference between blues (Fig. 3A,B). For the stimulus in Fig. 2C, note how the lack of UV cone results in humans missing some of the spectrum; we could not tell this spectrum apart from a simple yellow without UV (Fig. 3C). As in Fig. 3B note the reversal in S/M ratio between the guppy and starling in Fig. 3C (probably resulting in different perceived hues) and the changes in M and L in Fig. 3D and E with increasingly shorter-wavelengthsensitive eyes. Note how the “orange-red” of Fig. 2E would be perceived as more “saturated” (higher chroma or higher cone ratios) in the starling, and even more so in the guppy (Fig. 3E). Finally, note how, although the stimulus in Fig. 2F is perceived as white by humans, it is probably more chromatic for a bird, and far from white to a guppy (Fig. 3F). Again, this results from the increasingly shortwavelength sensitivity going from humans to starlings and guppies. In general, different ratios of cone outputs are found for different spectra for the same species and for the same spectra for different species. It is these cone outputs
Fig. 4A–D Radiance spectra of the three phosphors of a computer monitor compared with cone sensitivity functions of humans, starlings, and guppies. A Phosphor radiances: blue channel (dashed line); green channel (dotted line), and red channel (solid line). B Phosphors with the human cone sensitivities (thin lines) in Fig. 1A. C Phosphors with the starling (thin lines) in Fig. 1B. D Phosphor radiances with the guppy (thin lines) in Fig. 1C. Note the excellent match between the phosphor radiance spectra and the human cone spectra (B). The red channel (solid line) has a very strong peak in the area where the human long (red) and medium (green) cones show least overlap. The match was designed so that the three human cones can be stimulated nearly independently, allowing most of the gamut of naturally perceived colors to be simulated on a monitor. Note the fortuitous match with the S, M, and L cones of starlings (C) and note that the starling UV cone cannot be stimulated independently of the starling S cone, if at all. Note the very poor match between the phosphors and guppies; the three channels cannot stimulate guppy cones independently. The lack of UV emission means that the UV cones of starlings or guppies cannot be stimulated at all, except weakly by the blue channel
that we try to simulate on a video screen. Differences between human and non-human vision can cause problems, as we discuss below.
Reproducing color on a video monitor The problem of the production of natural-appearing colors in video images has been discussed elsewhere (D’Eath 1998; Fleishman et al. 1998); here we will show examples of differences in perception of color monitor stimuli to humans, starlings, and guppies, and use this to illustrate some of the problems. In a computer or video monitor the images are made up of tiny pixels (picture elements), each composed of three differently colored phosphors [typically blue (B), green (G), and red (R)]. Typical phosphor radiance spectra are shown in Fig. 4A. To create natural-appearing colors the relative intensity of the phosphors in each pixel are adjusted so that the ratio of stimulation of each of the three classes of cone photoreceptors in the human retina is equivalent to what it would be for the natural color in that part of the image. This is most easily done if the phosphor radiances are set to stimulate one cone strongly and the other cones weakly, or independent stimulation.
18
Figure 4 shows the radiance spectra for the red, green, and blue channels of an SGI computer monitor in relationship to the cone functions of humans, starlings, and guppies. Figure 4B shows the monitor radiance spectra overlaid on the cone functions of humans (Fig. 1A), for which they were designed. Note how well matched the blue and green channels are to the S (blue) and M (green) cones. This means that changing the intensity of either channel causes a large change in the matching cone output and only a minimal change in output of the other two cones. Because of the proximity of the M and L (red) cones, the only way to stimulate the L cone independently of the other cones is to have a phosphor that strongly emits in the wavelengths where the L cone is strongly sensitive but the M cone is relatively insensitive, and this is just how the red phosphor works. Consequently, changes in the red channel cause large changes in the output of the L cones and minimal changes in the output of the M cones. As a result, the three channels stimulate the three human cones nearly independently, making it possible to simulate a very large number of colors on a monitor, at least for a human. Problems arise when the spectral sensitivity and/or number of the different classes of photoreceptors of a viewing animal are different from those of a typical human (Fleishman et al. 1998). Figure 4C shows the monitor radiance spectra overlaid on the cone functions of starlings (Fig. 1B). Fortuitously, there is a good match between the blue, green, and red channels and the S, M, and L cones. The longer short-wavelength tails of the L and M cones mean some loss of independence but nevertheless it should be possible to stimulate three of the four starling (and other passerine) cones roughly independently on a monitor. The major problem is that there is no way to stimulate the UV cones, so a large range of colors cannot be simulated at all on a monitor. Those colors that reflect in both the UV and the human-visible will appear abnormal or different to birds. Nevertheless, experiments intentionally involving spectra that are weak in the UV will probably work well. The first successful video playbacks involved chickens (Evans and Marler 1991), which have slightly different cone functions than the starling, but the match to monitor phosphors is still fairly good. Figure 4D shows the monitor radiance spectra overlaid on the cone functions of guppies (Fig. 1C). Here there is a very poor match between the three channels and the guppy cones. Both the red and green channels stimulate the guppy L cone, and the green channel only weakly stimulates the M cone. The blue channel is a strong stimulator of the M cone and a moderate stimulator of the S cone. There is no way to stimulate the UV cone. Not only are the cones stimulated non-independently, but two of the channels stimulate the same cone. Consequently it is very difficult to simulate natural spectra for guppies on a monitor, although a small subset of natural stimuli could probably be simulated with care. The effects of differences between species (Fig. 1) can be demonstrated by comparing what each species
Fig. 5A–F Output of the cones of humans, starlings, and guppies by the natural stimuli of Fig. 2 (light bars) and simulation of these stimuli on a computer monitor (black bars). This is equivalent to using a color video camera to record each of the stimuli in Fig. 2, displaying them on a monitor, and then calculating the cone outputs resulting from the monitor for each species (black bars). Note the small differences for humans (HU; a perfect model would show no differences), and the increasing differences for starlings (ST) and guppies (GU)
would perceive if viewing the sample stimuli (Fig. 2) directly (as in Fig. 3) with how they would perceive the same stimuli played back on a monitor (as if the stimuli were recorded on a video camera and played back on the monitor); this is shown in Fig. 5. As expected, the cone ratios of real and simulated stimuli are similar for humans (HU columns). In fact the differences between actual and simulated stimuli are probably more a matter of small errors in the model parameters than real differences. On the other hand the match is very poor for starlings and guppies (Fig. 5). Part of the mismatch is a result of not stimulating the UV cones. For example, the ratios in Fig. 5A–C differ among species because there is no UV component in the monitor, and the starling (ST) and guppy (GU) are increasingly short-wavelength sensitive. The UV peak in Fig. 2C is absent in the monitor, resulting in no or weak stimulation of the UV and S cones (ST, GU in Fig. 5C). However, even considering only the S, M, and L cones, there are some serious problems for starlings and guppies (Fig. 5). In some cases the ratios are altered to something that is not even remotely like the original stimulus, particularly for the more shortwavelength sensitive guppies (GU Fig. 5A–D, F). This would result in perceived colors of entirely different hues from the original stimuli, even though apparently nothing had been done to manipulate the stimuli. As in Fig. 3F, note the continuing problem that what is apparently “white” on a monitor is not white at all to the animal. Note that not all stimuli are distorted to the same degree, so some colors could be simulated successfully (Fig. 5E). Clearly we have to be careful about what stimuli we are actually presenting to an animal; this requires knowledge of the animal’s photoreceptor functions, the
19
monitor characteristics, as well as the natural stimulus parameters. A potential solution to the problem of color reproduction in animals is to calculate the phosphor intensities needed to stimulate the cones of the study species in the same ratios as they would be stimulated by natural stimuli and adjust them accordingly (Fleishman et al 1998). This requires knowledge of the absorption spectra of the photoreceptors and the transmission of the eye optics to get the photoreceptor functions (Fig. 1), the natural lighting spectra, the reflectance or radiance spectra of the natural stimuli and visual backgrounds, and the emission spectra of the monitor to be used in the experiments. However, the lack of UV and the non-independence of stimulation of non-human receptors (Fig. 4) means that it will only be possible to simulate a subset of all possible perceivable colors. Since publication of Fleishman et al. (1998), we have done further work with this problem and have found that, in fact, there are even more limitations than we suggested at the time. The problem that arises is that even where it is theoretically possible to adjust phosphor intensities to create natural-appearing colors for a non-human animal, (1) real monitors may lack the range of phosphor intensities required to make the match and (2) for some colors the theoretical solution may call for negative phosphor intensities (roughly equivalent to increasing the intensities of the other phosphors to amounts greater than possible for the monitor). For example, even for colors that have no ultraviolet, and thus stimulate only three classes of guppy cones, it turns out to be quite difficult to create natural-appearing colors for the guppy visual system; the combination of lack of independent stimulation and the available range of phosphor intensities is not great enough to allow the calculated adjustments to be carried out. In summary, simulation of colors appearing natural to animals with cone functions different from humans’ may be difficult or impossible for some species, whereas for others it may be possible to design some stimuli that appear realistic. The problem of perceived color does not disappear even if one uses a monochrome monitor that supposedly shows a black-and-white image. The phosphors on a monochrome monitor set to appear white to a human only appear white because they stimulate our three cones roughly equally (Fig. 5). The white parts of the image will not appear white to many other animals because the monitor lacks UV emission, and emission at other wavelengths will not result in equal stimulation of all the animal’s cones (Figs. 2, 3, 5). On the other hand, we have no trouble recognizing monochrome images in colors other than white (amber, sepia, etc.); it is conceivable that some experiments could be reliable even if the monochrome monitor image is not perceived as blackand-white. However, if an organism has strong preferences for orange, were it to see an orange-and-white image on the monitor, it may respond differently to different-sized orange stimuli than it would to different-sized green stimuli on a green-and-white monitor, making any general interpretation of the effect of stimulus size (such
as spot size on a guppy) impossible. Even with monochrome monitors, experiments must be designed with care. If an animal normally views objects and visual signals at low light intensity (e.g. crepuscular, nocturnal, or some cave-mouth species), then its vision may be scotopic, or dark adapted. In many vertebrates, this means that vision is dependent upon only a single photoreceptor rod with a peak sensitivity of about 500 nm (Lythgoe 1979). If one can be certain that only one photoreceptor class (e.g. rods) is being used, then the use of a monochrome monitor will probably yield good results. However, it still must be remembered that equal steps in the gray scale of the monitor may not correspond to equal luminance steps in the animal, so misleading results could still result. In this case, a study of how the animal perceives brightness steps should be made before the main experiment, and the contrast of the monitor and/or the software producing the picture adjusted so that the range and distribution of perceived luminances are the same as the animal normally experiences. Otherwise the image may appear normal to us but appear “overexposed”, “underexposed”, or otherwise distorted to the animal.
Brightness The term “intensity” refers to the strength of a light stimulus in objective physical units (either energy or photons). The term “brightness” refers to the perceived intensity of a stimulus and depends on the stimulus intensity and spectral composition, the spectral sensitivity of the viewer, and the conditions under which the stimulus is viewed. In general, animal visual systems are quite poor at estimating total intensity but rather respond to differences between adjacent areas of the visual field (Cornsweet 1970; Davson 1990; Chittka 1993; Vorobyev and Osorio 1998). In general the visibility of an object or location within a field of view depends primarily on the extent to which it contrasts with other parts of the scene. Although contrast in color appearance plays some role, for many animals the primary determinant of visibility is brightness contrast. The importance of brightness contrast in human visual perception is illustrated by the fact that humans can view monochrome images and have little trouble recognizing any objects in the scene. Thus, brightness contrast may carry a large proportion of the visual information in any scene for humans. In arthropods, however, color contrast may be more important than brightness contrast (Chittka 1993). In humans, if an object is viewed against a uniform background, the brightness (i.e. perceived intensity) of the object depends almost entirely on the ratio of the object’s intensity to the intensity of the background and is almost independent of the actual intensity of the object and background. In humans, brightness constancy holds over a range of three orders of magnitude of intensity roughly centered on the intensity to which the eye is
20
adapted (Cornsweet 1970). This phenomenon largely arises from the logarithmic relationship between stimulus intensity (e.g. number of quanta) and response found in retinal photoreceptors. This relationship has been demonstrated in a variety of vertebrate retinas (Dowling 1987; Vorobyev and Osorio 1998), suggesting that rules concerning brightness contrast that apply to the human visual system also hold for most vertebrate visual systems. For example, Persons et al. (1999) showed that the probability of an Anolis lizard detecting a moving stimulus flag is nearly directly proportional to the contrast in brightness between the stimulus and its background. These results have practical implications for the design of video playback experiments. If one is interested in creating viewing conditions that are a reasonable approximation of natural viewing conditions, the absolute intensity of a video screen may not be critically important, but the contrast (e.g. between the stimulus animal and its background) is very important. Contrast within the scene is very important, but absolute intensity cannot be totally ignored. If the radiances in the video image are very different from what the animal experiences in nature, the brightness constancy described above may break down. One must be especially careful to avoid experiments in which the video image is presented under scotopic conditions (i.e. relatively low intensity, rod-based vision) whereas the natural behavior is typically viewed under photopic conditions (i.e. relative high intensity, cone-based vision). Rods and cones have different spectral sensitivities and different contrast sensitivities, so that a given intensity contrast will produce a different perceived brightness contrast, depending on whether it is detected by rods or cones. In general it will be advisable to have absolute radiances on the video screen fall within the range of radiances in the natural habitat under natural light conditions. If one is careful to preserve intensity contrast ratios and to keep radiance levels within naturally occurring values, the perceived object–background contrast on the screen should match that for comparable objects and backgrounds in nature. One should be especially careful about matching absolute intensities on the screen to natural levels when using behavioral stimuli (e.g. courtship displays) that, in nature, occur under very specific lighting conditions, as is known for guppies (Endler 1991) and some birds (Endler and Théry 1996). The natural intensity range can make a big difference. For example, in vertebrates the switch from cone to rod vision is not instantaneous, and there are a range of relatively low light intensities over which the spectral sensitivity and contrast response may be influenced by both rods and cones and be quite sensitive to absolute light level. On the other hand, if the behavior of interest occurs during the middle of the day (photopic conditions) under a wide range of light conditions (e.g. cloudy skies, clear skies, etc.) then any absolute radiance values that fall within the natural range will probably be adequate. In addition to adjusting the screen to have the natural range of radiances, it is important to have the animal at
the appropriate state of light adaptation. We should expose the animal to the display screen with the visual background that will be used in the experiment for at least 30 min or so, so that the visual system can become light adapted to the presentation conditions. For example, in vertebrates, if visual displays normally take place under photopic (cone) vision the animal should be adapted to the appropriate photopic conditions, whereas if the animal displays under scotopic (rod) conditions it should be adapted under scotopic (darker) conditions. One wants to avoid a situation, for example, in which the photopically viewing subject is kept in a dark enclosure until immediately before the experiment begins. If the animal’s visual system is adapted to an intensity well below the average intensity of the video display, the intensity variations within the display may fall outside the region of brightness constancy. Furthermore, as light or dark adaptation takes place, experimental results will change with time, even with the same stimuli, causing spurious results. The best way to avoid this is to keep all conditions in holding and experimental areas as close to what the animal normally experiences as possible. Even if one simply videotapes a natural scene and plays it back to an animal one must pay considerable attention to the percent contrast of different portions of the scene. The contrast sensitivity of a video system (including the camera and display device) needs to be adjusted so that it accurately records contrast levels found in nature. This is best done with the use of grayscale or similar standards with known contrast levels, since cameras and display systems do not, in general, accurately record intensity contrast over all ranges of light intensity without adjustment (Ingliss 1993). Worse, many cameras have automatic gain control, which means that they are set to maximize contrast to a human eye when an entirely different relationship between light input and brightness output might apply to the study species. Problems can also arise if the spectral sensitivity of the animal for whom the video is to be shown differs by a great deal from the spectral sensitivity of the camera itself, since the relative brightness of different colors will not accurately be transferred from a natural scene to the video image. If possible one should try to obtain some estimate of the subject’s spectral sensitivity (for a task similar to that being tested) and compare it to that of the camera and display system, so that adjustments of brightness contrast can be made if needed. In summary, brightness contrast is a critical feature of any visual stimulus. If possible the contrasts within the video display should be typical and within the range of those found in nature. Even more critical is to be certain that contrast does not become altered from one stimulus presentation to the next, since this may alter the visibility and/or attractiveness of the stimulus. For example, motion detection depends to a large degree on brightness contrast (Schaerer and Neumeyer 1996; Anstis et al. 1998; Persons et al. 1999), so a small shift in the percent contrast between the stimulus and the background could
21
greatly alter the effectiveness of a moving stimulus in attracting the attention of a viewer.
Temporal response and motion If two stationary scenes are presented in rapid sequence to a human viewer a strong motion illusion is created if some objects in the second scene are displaced a short distance from their position in the first scene. If a series of such scenes are presented in rapid succession an illusion of smooth continuous motion is created. Many studies have been carried out on humans on the conditions required to produce this illusion (reviewed in Ramachandran and Anstis 1986; Sekuler et al. 1990). If the distance between objects in successive frames is small, sequential presentation of frames at a rate of 10–15 Hz is sufficient. As the displacement distance of objects in successive frames gets larger, higher frame rates are required, and if the distance is too great the motion illusion will break down even at framing rates of 30 Hz or higher (Foley et al. 1996). It is not known if all animals perceive the motion illusion just as humans do, but neurophysiologists have found motionsensitive cells in the brains of primates (Sekuler et al. 1990) and pigeons (Frost et al. 1988; Wang et al. 1993) that respond to apparent motion in the same way that they do to true motion. Anstis et al. (1998) were able to induce an optomotor response in guppies with an apparent motion stimulus. These results suggest that apparent motion stimuli work on at least some animals. In video and animated computer displays we need to distinguish between two rates, the “refresh rate” and the “presentation rate.” In most display devices the entire screen is flashed on and off (it is actually scanned, but the scan is so fast relative to the persistence of the screen phosphors that the screen effectively flashes on and off) at a regular rate, which is the refresh rate. The screen may be refreshed entirely at one time (“single scan”) or it may be refreshed in two alternate scans (each called a field to distinguish it from a frame in which all lines are scanned) involving every other line (“dual scan”). Most computer monitors are single scan, while standard video formats rely on dual scan. Liquid crystal diode (LCD) monitors are becoming increasingly common. These are of two types: passive matrix screens refresh like other computer monitors. Active matrix screens change only when there is a change in the image, so that their refresh rate depends on the rate at which new images are fed to the screen and is therefore variable. It is not necessarily the case that new images are presented with every refresh of a screen. For example, in computer animations, new scenes are presented at a rate determined by software, independent of the refresh rate. Here we define the rate at which the image on the screen is actually changed as the presentation rate, to distinguish it from the refresh rate. For example a typical computer animation might use a presentation rate of 15 Hz, but most computer monitors have refresh rates of 60 Hz or greater. In standard video formats the presentation rate
is equal to the field rate (i.e. 60 Hz for NTSC, 50 Hz for PAL or SECAM), as long as the images of interest are large relative to the individual lines of the display. Active matrix LCD screens have a refresh rate that is equal to the software-controlled presentation rate. If a motion illusion can be induced with a presentation rate as low as 10 Hz one may ask why refresh rates are generally so much higher. The answer is that high refresh rates are designed primarily to prevent the screen from appearing to flicker, by refreshing at a rate that is higher than the critical frequency of fusion (CFF). In the literature it has been mistakenly claimed that it is important for creating an illusion of motion that the presentation rate exceed the CFF. Obviously this is not the case. The maximum human CFF is approximately 50 Hz, but the illusion of smooth motion can easily be created with much lower presentation rates, particularly at low stimulus intensities. D’Eath (1998) reviewed in detail the issue of whether or not animals are likely to perceive screen flicker. The conclusion is that some animals – particularly diurnally active, flying birds and insects – probably can see standard video screens flickering on and off in many circumstances. It is not clear, however, how critical this problem is. Some of the most successful video playback studies have been carried out on chickens (e.g. Evans and Marler 1991), which have been shown to be able to perceive flicker rates of over 100 Hz. It seems likely that although flicker on a video screen might be distracting or annoying, it is unlikely to affect the illusion of motion created by video. Nevertheless D’Eath’s recommendation that screens with high refresh rates be employed with animals known to have a high CFF is probably good advice – both for suppression of flicker and for reasons described below. If smooth motion can be created with relatively low presentation rates (at least in humans), and one is creating computer-animated stimuli, is there any reason to use higher rates? We argue that the answer is yes. Capturing a natural motion pattern onto a series of still video frames represents a process of digitally sampling a continuous (analog) event. As with any such digitization procedure the accuracy with which the original timevarying pattern can be reconstructed by the viewing visual system depends on the sample rate. If one plots a stimulus versus time (e.g. the position of an object moving through space, or the light intensity of a single location through time) one can analyze the pattern with Fourier analysis. The Nyquist sampling theorem dictates that the highest Fourier frequency that can be accurately represented in a digitally sampled waveform is one half the sampling frequency. This means that if one displays a moving object at a presentation rate of 20/s the highest accurately represented frequency is 10 Hz. Any sampling rate that is less than the CFF represents a low-pass filtering of the natural motion (see Cowan 1983) that will eliminate the most rapid changes (rapid stops and starts) and may cause slight distortions in other motion components (aliasing). If the presentation rate is higher than the
22
CFF, the temporal resolution is equal to or greater than that of the visual system and no information about the natural motion will be lost since the stimulus over time should be indistinguishable from true motion. The effects of undersampling may be non-trivial. The loss of high frequency components in the motion will tend to smooth out rapid changes and accelerations. Jerky, sudden movements, characterized by high acceleration, are employed in many animal signals and it has been shown that such movements are much more likely to be seen by inattentive viewers than are smoother movements (Fleishman 1992). Moreover, rapid accelerations require the greatest amount of energy and coordination and may be very important to animals assessing the quality of conspecifics. Thus one should, in general, use the highest possible presentation rates in playback studies to avoid losing details of motion patterns. In computer animation one should certainly take advantage of the high temporal resolution of computer monitors and use presentation rates of 60 Hz or higher. Standard video output format has an effective presentation rate of 50 or 60 Hz, depending upon the AC power source. This should be high enough to capture most motion patterns accurately for animals that do not have exceptionally high temporal resolution. For flying animals, which have very high temporal resolution, rapid movements such as vibrations, or sudden jerky movements, may not be accurately represented in video. One should also be careful when digitizing video in order to manipulate it, and then presenting it either directly from the computer or converting it back into video. Many computer programs digitize video by combining two consecutive fields to create complete frames. The presentation rate of such a digitization will be the video frame rate, not the field rate. Computer-digitized sequences that are placed on video are typically created as full frames and when these are converted to fields, the two fields represent the scan of a single frame – that is, a single instant in time – which effectively makes the presentation rate equal to the frame rate, rather than the field rate. Since video frame rates are below the CFF for most animals there may be some temporal undersampling of very rapid or sudden movements. Many of these problems can be solved by using monitors with very rapid refresh rates and by creating animations with presentation rates that are 60 Hz or more, although undersampling problems may still occur when the viewer is a diurnal bird, dragonfly, or robber fly. Additional problems may occur in converting computer animations to video tape with different frame rates.
pending upon the local electric power system. If the refresh and/or presentation rates are slightly different from multiples of the fluorescent frequency then the image will appear to flicker at a slower rate than expected from the monitor because the two flickering light sources constructively and destructively interfere in time as they go in and out of phase. This is equivalent to “beat” notes in sound and Moiré patterns in visual space. (Moiré patterns are repeating bands or other patterns that occur when two regular patterns are superimposed and their scale of repeats is slightly different.) This can be avoided by not using fluorescent lights (which can interfere with behavior in other ways; Endler, unpublished) or tuning the monitor rates far from multiples of the fluorescent rates.
Spatial resolution and pixellation If animal viewers can resolve individual pixels in an image several problems may result. For color screens the image will dissolve into a mosaic of red, green, and blue dots. In addition it is doubtful that the image itself will be sensible. D’Eath (1998) summarized this problem and concluded that it was mostly a problem for work with animals whose spatial resolution greatly exceeds that of humans. However, the problem may arise for other animals as well, when the animal is close to the screen. The retinal size of any object increases exponentially as a viewer moves closer to the image. Thus even animals with rather modest spatial acuity may see a pixellated image when they view it from a few centimeters distance. For example, based on behavioral data from Long (1993) on guppy spatial resolution we calculated that adult guppies can easily distinguish the individual pixels on a typical television monitor (e.g. 0.2 mm in width) if viewed from a distance of 3–4 cm, which corresponds to the natural distance at which courtship occurs. As we describe later one cannot solve this problem simply by moving the monitor further away if the behavior of interest typically takes place at a certain distance because most animals can determine the distance to the screen, so that the courtship distance would no longer be typical. Solutions to this problem include the use of a high resolution monitor, design of the experiment so that the monitor does not need to be very close to the animal under study, or use of a video projector and a reducing lens to reduce the pixel spacing. A good rule of thumb to use for preventing pixellation is to design an experiment such that the angular separation of the pixels is considerably smaller than the minimum separable angle of the animal, or
Monitor and ambient light interaction
α=arctan(p/D)