Microbial diversity in archived agricultural soils
2
Alterra-rapport 916
Microbial diversity in archived agricultural soils The past as a guide to the future
J. Dolfing A. Vos J. Bloem P.J. Kuikman
Alterra-rapport 916 Alterra, Wageningen, 2004
ABSTRACT Dolfing, J., A. Vos, J. Bloem & P.J. Kuikman 2004. Microbial diversity in archived agricultural soils; The past as a guide to the future. Wageningen, Alterra, Alterra-rapport 916. 55 blz. 12 figs.; 1 tables.; 12 refs. Bacterial diversity and bacterially mediated processes are considered key to soil ecosystem functioning through decomposition and mineralization. However, there is a lack of understanding as to how activity and diversity of prokaryotic communities respond to changes in the environment. At present this issue is mostly addressed by real-time monitoring of long term field experiments, which is costly and slow. Using modern molecular methods we re-analyzed soil samples of up to 50 years old that have been stored in the Alterra soil archive TAGA. We showed that it is indeed possible to detect bacterial fingerprints in those samples and that fingerprints from different samples can be distinctly different, for example between fields that have or have not received organic amendments. These results are a promising first step towards unlocking the microbial information present in archived soil samples. This will help to assess the (likelihood of) changes in soil microbial diversity in response to environmental change (climate change) and human interference (fertilization) and to establish a reference condition and situation. This may further enable coupling to more functional assessments of soil functioning in standardized decomposition essays with the stored samples with known differences in diversity. Keywords: Soil; Microbial diversity; DGGE; Soil archive; TAGA; Manure; Soil organic matter; Soil management; Bacterial diversity; Heino; Pr168; Pr65. ISSN 1566-7197
This report can be ordered by paying € 26,- to bank account number 36 70 54 612 by name of Alterra Wageningen, IBAN number NL 83 RABO 036 70 54 612, Swift number RABO2u nl. Please refer to Alterra-rapport 916. This amount is including tax (where applicable) and handling costs.
© 2004 Alterra P.O. Box 47; 6700 AA Wageningen; The Netherlands Phone: + 31 317 474700; fax: +31 317 419000; e-mail:
[email protected] No part of this publication may be reproduced or published in any form or by any means, or stored in a database or retrieval system without the written permission of Alterra. Alterra assumes no liability for any losses resulting from the use of the research results or recommendations in this report.
4
Alterra-rapport 916 [Alterra-rapport 916/februari/2004
Contents
Preface
7
Summary
9
1
Introduction 1.1 Rationale for the use of bulk soils to study biodiversity 1.2 Objectives of the current study
11 12 12
2
Experimental approach 2.1 DGGE analysis of bacterial soil communities 2.2 Analysis of DGGE community profiles 2.3 Selection of samples from TAGA
13 13 13 14
3
Exploratory experiments
15
4
Sample selection
17
5
DGGE profiles 5.1 DGGE profiles from a sandy soil. Effects of manure 5.2 Effect of crop and secondary crops 5.3 Replicates 5.4 Effect of soil type 5.5 Effect of manure and compost on a sandy soil
19 19 22 23 24 25
6
Discussion
27
7
Conclusions
29
8
Recommendations
31
Literature
Appendixes 1 2 3 4 5
Samples analyzed in the present study DGGE profiles of soil samples analyzed in the present study. Dendrograms of the DGGE gels presented in Appendix 2 Quantitative Principle Component Analysis of the gels presented in Appendix 2 Qualitative Principle Component Analysis of the gels presented in Appendix 2
33
35 37 43 45 51
Preface
The present project was carried as part of Alterra’s Strategic Research Program (SEO). One of the objectives of this program is to strengthen the expertise of Alterra through exploring innovations through research and improving understanding in today’s scientific challenges and so better support our clients. The objectives of the research that is presented here were: • to find out it is possible with modern molecular techniques to detect “microbial fingerprints” of samples stored in Alterra’s soil archive TAGA, and if so, • whether a comparison between samples with a different history would yield meaningful differences, as this would provide a way to study microbial diversity in archived soils, and thus would greatly increase the value of TAGA. Key words: microbial diversity; biodiversity, soil microbiology; soil archive; DGGE; denaturing gradient gel electrophoresis; TAGA; Alterra; manure; soil organic matter.
Alterra-rapport 916
7
Summary
Bacterial diversity and bacterially mediated processes are considered key to soil ecosystem functioning through decomposition and mineralization of organic material. Biodiversity, i.e. biological diversity, is presently receiving much attention from both researchers and policy makers. The recognition of the importance of biodiversity stems from the recognition that an increasing number of species becomes extinct, the objective to protect species and importance given to diversity for a healthy functioning of ecosystems. It is important to be aware that the benefits of biodiversity are produced by populations of organisms in communities living in a specific abiotic environment. However, there is a lack of understanding as to how the activity and diversity of prokaryotic communities respond to long term changes in the environment. We do know that soil biodiversity is changing fairly slowly despite rapid changes in rhizospheres on an annual basis. This would require long term experimental trials to relate changes as they occur to environmental pressures. At present, this issue is mostly addressed by real time monitoring of long term field experiments. Such experimentation is costly and requires long term commitment of researchers and funding and years and years pass before results may provide hints for human interference. At that stage interference may be more costly or conditions may not be reversible anymore. We therefore sought a more rapid approach, and asked whether existing soil archives with historic soil materials from long-term field trials in the past could be useful in identifying effects of environmental parameters on microbial diversity. Alterra has a soil archive (TAGA) with actual air-dried soil samples that are up to 120 years old. The objective of the present research was to find out if 16S-based PCRDGGE analysis of soil samples archived in TAGA would provide an indication of microbial diversity. DGGE, which stands for denaturing gradient gel electrophoresis, is a technique that is frequently used to detect changes in microbial diversity. One of the characteristics of PCR-DGGE is that it overcomes the necessity to cultivate organisms before characterizing them. Thus the method should be ideally suited to detect bacteria in stored soil samples as it avoids the necessity to “wake them up from hibernation”. Our research shows that it is indeed possible to obtain DGGE profiles from samples that have been stored for more than 50 years. Drying of the soil may a have affected the composition of the community that can be detected by PCR-DGGE, but exploratory experiments gave no indication for a change in the number of bands that was detected. Nevertheless, further work is needed to evaluate exactly how drying and grinding of the soil affects the PCR-DGGE profile that subsequently can be retrieved. Another encouraging result of the present research is that our data-set shows distinct differences between profiles from soils that have received manure (organic amendments) and soils that have not received such amendments. Apparently
Alterra-rapport 916
9
environmental factors that were active 50 years ago can still be detected in those samples. The present results should be regarded as a first step towards unlocking the microbial information present in archived soil samples. More specific methods (including sequencing of PCR amplified DNA from those samples) will undoubtedly provide more specific information on the type of organisms present in those samples.
10
Alterra-rapport 916
1
Introduction
Bacterial diversity and bacterially mediated processes are considered key to soil ecosystem functioning through decomposition and mineralization of organic material. Biodiversity, i.e. biological diversity, is presently receiving much attention from both researchers and policy makers (EU Soil Strategy). Current policies in agriculture include set-aside, extensification and restoration management and optimizing the application of ecological principles (in Dutch “ecologisering”). The recognition of the importance of biodiversity stems from the recognition that an increasing number of species becomes extinct, the objective to protect species and importance given to diversity for a healthy functioning of ecosystems. It is important to be aware that the benefits of biodiversity are produced by populations of organisms in communities living in a specific abiotic environment. By signing the Convention on Biological Diversity, as formulated in 1992 in Rio de Janeiro at an international conference under auspices of the United Nations, the Netherlands has taken the responsibility to protect biodiversity existing within its borders. The implementation of policies to achieve this goal is still in its infancy. Biodiversity in soils is extremely large. Indeed soil has been labeled “poor man’s tropical rain forest”. In spite of the crucial role that soil communities play in the global elemental cyles, there is a lack of understanding as to how the activity and diversity of prokaryotic communities respond to changes in the environment. We do know that soil biodiversity is changing fairly slowly despite rapid changes in rhizospheres on an annual basis (Smalla et al. 2001). This would require long term experimental trials to relate changes as they occur to environmental pressures. At present, this issue is mostly addressed by real time monitoring of long term field experiments. Such experimentation is costly and requires long term commitment of researchers and funding and years and years pass before results may provide hints for human interference. We therefore sought a more rapid approach for assessing the rate of change in soil microbial diversity, and asked whether existing soil archives with historic soil materials from long-term field trials in the past could be useful in identifying effects of environmental parameters on microbial diversity. Alterra as many other research institutes has a soils archive (TAGA) with samples that are up to 120 years old. The objective of the present research was to find out if 16S-based PCR-DGGE analysis of soil samples archived in TAGA would provide an indication of microbial diversity. DGGE is a technique that is frequently used to detect changes in microbial diversity (Smit et al. 2001). One of the characteristics of PCR-DGGE is that it overcomes the necessity to cultivate organisms before characterizing them. Thus the method should be ideally suited to detect bacteria in stored soil samples as it avoids the necessity to “wake them up from hibernation”.
Alterra-rapport 916
11
1.1
Rationale for the use of bulk soils to study biodiversity
Soil microorganisms carry out essential processes in soil such as decomposition and mineralization of organic matter. Only a fraction (max 20%) of the total microbial population in soil is culturable and can be studied by traditional cultivation methods. Even in the rhizosphere, only part of the microbial population is culturable. Yet, the rhizosphere and the deposition of substrates here, is the major driving force for any changes in the soil microbial diversity. Rhizospheres are only a fraction of the total soil environment (10% at the most) but foster the larger part of soil activity (at least 90%). The rhizosphere is more an actual use of that potential and may very well have a lower biodiversity than the bulk soil. In this sense, rhizospheres reflect the present, whereas bulk soils, non-rhizosphere, reflect the past and contain accumulated information over time. It is the bulk soil that will reveal the true microbial potential and show whether losses of biodiversity and function have occurred over time.
1.2
Objectives of the current study
The objective of the current study was to answer the following questions: 1. Can we obtain DGGE profiles from soil samples stored in TAGA, and if so 2. Are DGGE profiles obtained from a series of similar soils similar and series from dissimilar soils dissimilar, i.e. are patterns internally consistent?
12
Alterra-rapport 916
2
Experimental approach
The assessment of soil microbial diversity should ideally be based on methodologies that are non-selective and can thus be best supported by non-cultivation methods. One such method is DGGE (Denaturing Gradient Gel Electrophoresis). Critical steps in this methodology concern the extraction of DNA or RNA from soil and the amplificability of the extracted nucleic acids. Results so far are promising and the method was successfully used to indicate and monitor minor changes in microbial diversity in contaminated soils and in soils with heavy organic amendments (Bloem and Breure, 2003; Dilly et al. 2004).
2.1
DGGE analysis of bacterial soil communities
Denaturing gradient gel electrophoresis of PCR1-amplified fragments of genes encoding for 16S rRNA (Muyzer et al. 1993) is a widely used method to evaluate microbial diversity in soils (Torsvik and Ørser, 2002). The method is routinely performed in our laboratory (Griffiths et al. 2001; Bloem and Breure, 2003; Dilly et al. 2004). One of the advantages of using PCR-DGGE is that the organisms have not to be cultivated before they can be analyzed: A disadvantage is that DGGE is not specific, and not necessarily quantitative, but as a first screening method DGGE is still the method of choice. In the present research PCR was used to amplify the variable V3 region of 16S rRNA gene sequences of eubacterial DNA from archived soil samples (see below). Materials and methods of PCR amplification and DGGE analysis as performed in our laboratory have been published before (Dilly et al. 2004).
2.2
Analysis of DGGE community profiles
Quantitative analysis of DGGE community profiles is routinely done with densitometric methods. Images of gels were made using a UV 300 transilluminator (Fotodyne, Hartland, USA)) and an Image Point Cooled CCD video camera (Photometrics LTD., Tucson, USA)). The video images were acquired with Leica QWin image processing and analysis software (Leica, Cambridge, UK) and stored as TIFF files. Banding patterns were analyzed using GelCompar II software (Applied Maths, Sint-Martens-Latem, Belgium). Background intensity was subtracted (10%), DNA bands were identified interactively and the position and mass (intensity) of each band was measured. The data were used for principal component analysis (PCA) in GelCompar to evaluate differences between the DNA profiles. Both quantitative and qualitative PCA (for the latter the presence but not the intensity of the bands) was performed. For qualitative PCR only the presence of the bands was taken into account, for quantitative PCR also the intensity of the bands was taken 1
PCR: polymerase chain reaction.
Alterra-rapport 916
13
into consideration. Dendrograms were constructed in GelCompar on the basis of intensity of the bands.
2.3
Selection of samples from TAGA
TAGA is an archive of soil, crop and manure samples of the former research Institute of Soil Fertility in Haren and its predecessor the National Agricultural Research Service in Groningen (Ehlert et al. 2002). The archive contains about 250 000 soil samples from experiments performed in the period 1879-1998, plus data and information on the experiments from which the samples were taken. The source of the samples is diverse. Most of the samples are from fields experiments, some of which lasted for 50 to 80 years. Access to TAGA and the information contained in TAGA is not (yet) computerized. The samples all have a unique code (number) and are stored in numerical (chronological) order. The challenge is to find the description of the experiment from which the samples under consideration were taken, or, vice versa, to find samples from the experiment of choice. The codes of the samples have to be found by manually searching old ledgers. Ledgers are filed in boxes. Each box contains the files of one or a few distinct experiments. The experiments all have a unique code. Limited information on these experiments has recently been transferred to a digital database, but searching TAGA in its present format is still rather time-consuming (de Willigen et al. 2001). For the current project four series of samples were selected. Selection criteria included: • The age and duration of the original experiment: the older and longer the better; • The age of the samples: the older the better; • The objectives of the original experiment (effects of manure/organic amendments); • The possibility to sample the site again; • The soil type; both sandy soils and clay should be included in the analyses.
14
Alterra-rapport 916
3
Exploratory experiments
To be stored in TAGA soil samples are dried for two days at 40 0C and then ground. This procedure may change the soil microbial community. The microbial community may (also) undergo changes during storage. Therefor a series of exploratory experiments was done to evaluate (i) how drying and grinding of soils affects bacterial community fingerprints as revealed by DGGE, (ii) how these fingerprints change during storage, (iii) whether the original community fingerprints may be restored by rewetting dried and ground soils, and (iv) whether DGGE analysis of archived soils gives reproducible bacterial community fingerprints. The results of these experiments (Kuikman et al. 1999) are to be published elsewhere (Naumova et al. in preparation). Briefly, the outcome of these experiments was that drying and grinding of soils results in a dramatic decrease in the numbers and biomass of the bacteria present in the soil. The effect of drying and grinding on the DGGE profiles was less clear, and appeared to be different in different soils. The major conclusion from this exploratory work was that it was indeed possible to detect DGGE fingerprints in archived soils from TAGA and that different patterns were observed for different soils. This encouraging result led us to focus in subsequent work on analyzing a series of soil samples from TAGA to see whether different patterns would be observed in samples that had a different history. From our exploratory work we know that these profiles are most likely not identical to profiles that would have been obtained from fresh samples, but the fact remains that differences between different samples are interesting and may give clues on the effect of certain treatments or changes in environmental variables on the microbial diversity of the soils under study.
Alterra-rapport 916
15
4
Sample selection
Samples from four experiments were used in the present project. The oldest sample was from 1932, i.e. more than 70 years old. Most of the samples were form the 1940s and 1950s (experiments Pr 65 and Pr 168) and 1960s and 1970s (experiment Pr168). Table 1 gives the TAGA codes and a brief description of the experiments from which samples were analyzed. Tables A1 to A5 in Appendix 1 give the TAGA codes of the samples. The tables are organized per experiment from which the samples were taken. Experiment Pr 109 was permanent grass on clay. All other experiments had a crop rotation on sand. The samples were chosen in such a way that effects of variety of treatments (with and without manure) and crops (oats, rye, potatoes) could be evaluated over longer periods of time (up to 24 years). Table 1. TAGA experiments from which samples were analyzed TAGA code Pr 65 Pr 109 Pr 168 Pr 927
Period 1927-1957 1930-1951 1940-1975 1946-1965
Alterra-rapport 916
Soil type sand heavy clay sand sand (dalgrond)
Experimental variables manure, compost, N, P, K manure/no manure plus fertilizers manure straw at various N-gifts
17
5
DGGE profiles
In this chapter the results of a series of DGGE analyses of PCR-amplified DNA from samples stored in TAGA will be presented. The emphasis is on the effects of manure on the DGGE profiles. Other effects that will be presented are the effects of crop type and the effects of soil type. It should be kept in mind (i) that all samples were from the bulk soil, and not specifically from the rhizosphere, and (ii) that all samples were from one time point per year (after the harvest of the crop), and results may have been different when the samples had been taken at a wetter or drier point in time.
5.1
DGGE profiles from a sandy soil. Effects of manure
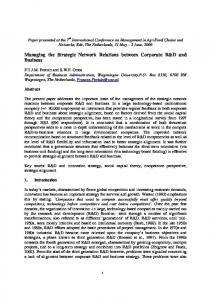
Pr 168 is a well described and documented field experiment with farmyard manure on a humic sandy soil in Heino (Wisselink, 1961; Kortleven 1963). The experiment was started in 1940 with the lay-out of 10 field plots receiving ten different treatments. The objective was to test the effect of stable manure and of nonleguminous secondary crops [harvested as well as ploughed in] on the fertility of an old arable sandy soil. The topsoil is a typical “esgrond”, i.e. a soil which in the prefertilizer era received regularly heather-sod compost from sheep-barns. For the present project two series of samples were analyzed. One series was from a field plot that had received only chemical fertilizer, no animal manure. The other series was from a field plot that had received animal manure at a rate of 70 ton per 3 years. The samples were from the 1950s to 1970s, taken in the fall after cultivation of rye. The results of the DGGE analysis of both series of samples are presented in Figure 1.
Figure 1. DGGE analysis of samples from experiment Pr168. Lanes 1, 8 and 15 are markers. Lanes 2, 4, 6, 9, 11 and 13 are with manure, lanes 3, 5, 7, 10, and 12 are with inorganic fertilizer (for details see Table 4a)
Alterra-rapport 916
19
densitometric units
200 180 160 140 120 100 80 60 40 20 0
140
manure
100
1971 1965
60
1962
40
1956
20
1950
100
200
300
1971
80
1968
0
inorganic fertilizer
120 1974
1968 1965 1962 1956
0
400
0
100
distance from origin (pixels)
200
300
400
distance from origin (pixels)
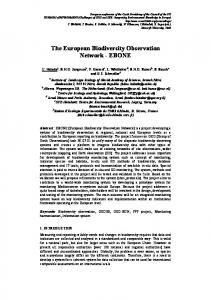
Figure 2. Densitometric profiling of the DGGE gels of samples from Pr168 from plots that had received manure (left panel) or inorganic manure (right panel) since 1940
With the naked eye it is not easy to see differences between the individual samples. This may be taken to suggest that there is a large, stable population of microorganisms present in the soils and that the effect of adding manure was relatively minor. Densitometric profiling of the data however shows that differences are apparent between the DGGE profiles of the two series (Fig. 2). A more detailed impression of differences between profiles from samples taken in the same year but from different treatments is given in Figure 3, while Figure 4 shows a comparison between two samples from the same treatment but from different years. 30
1968
20 10 0 0
50
100
150
200
250
300
350
400
-10 -20 -30 distance from origin (pixels)
Figure 3. Density difference between DGGE profiles from samples taken in 1968 from field plots that had received manure or inorganic fertilizer since 1940 manure
30 20
20
10
10
0 -10
inorganic fertilizer
30
0 0
50
100
150
200
250
-20
300
350
400
-10
0
50
100
150
200
250
300
350
400
-20
-30
-30 distance from origin (pixels)
distance from origin (pixels)
Figure 4. Density difference between DGGE profiles from samples taken in 1965 or 1968. Left panel: samples from plots that had received manure since 1940. Right panel: samples from plots that had received inorganic fertilizer since 1940
20
Alterra-rapport 916
Pearson correlation [0.0%-100.0%]
100 71
77
100 98 89
63
100 96 64 100
100
98
96
94
92
90
88
86
84
82
80
78
DGGE
lane 04
field 09
1956
lane 06
field 09
1962
lane 02
field 09
1950
lane 13
field 09
1971
lane 14
field 09
1974
lane 11
field 09
1968
lane 09
field 09
1965
lane 07
field 10
1965
lane 12
field 10
1971
lane 10
field 10
1968
lane 03
field 10
1956
lane 05
field 10
1962
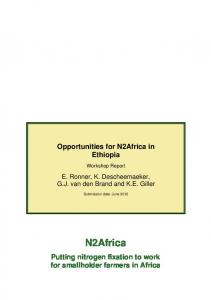
Figure 5. Dendrogram of DGGE patterns from samples of field plots that had received animal manure (brown squares) or inorganic fertilizer (green squares) since 1940
A dendrogram based on a comprehensive comparison of all the results (Fig. 5) shows that the samples within one treatment series are more related to each other than to the samples from the other treatment. Thus DGGE analysis of the two series of samples has revealed consistent differences between them: apparently it is possible to detect a effect of a treatment (in this case the use of manure versus the use of inorganic fertilizer) on the microbial community profile in samples that had been stored in TAGA for between 25 and 50 years. Cluster analysis (Figure 6) confirms that the samples of the soils that had received no manure formed a distinct group.
1965 1956 1971 1962
1950
1968
1974
1962 1968
1956
1965
1971
Figure 6. Quantitative principle component analysis of DGGE profiles from field plots that had received animal manure (brown dots) or inorganic fertilizer (green dots) since 1940
Alterra-rapport 916
21
5.2
Effect of crop and secondary crops
In the above analysis the effect of manure versus chemical fertilizer for series of samples that had been taken after cultivation of rye was evaluated. In a subsequent analysis more variables were introduced, viz. (i) three different crops rather than rye only, and (ii) a third treatment, viz. a secondary crop. Again, analysis of the DGGE gels with the naked eye revealed no clear-cut differences between the various profiles (Fig. 7).
Figure 7. DGGE analysis of samples from experiment Pr168 (for details see table 4b; lanes 1, 8 and 15: markers)
A dendrogram of the data after densitometric profiling however revealed distinct clusters (Figure 8). Much to our surprise however the clustering was not along the lines observed in the previous experiment, or between different crops, or years. The culprits for this unexpected (see above) result were the samples from the soils on which potatoes had been cultivated. If we leave these samples out of the dendrogram the result resembles the result described above. This suggests that the effects of oats
22
Alterra-rapport 916
and rye on the soil microflora are very similar. The effect of potatoes is not equivocal, and the potato samples do not form a cluster by itself.
Pearson correlation [0.0%-100.0%]
100
98
96
94
92
90
88
86
84
82
80
78
DGGE
100 94 97 97
100
78 96 75 75
100
lane 09
oats
1972
lane 05
rye
1971
lane 14
potatoes 1973
lane 03
potatoes 1958
lane 02
potatoes 1958
lane 11
oats
1972
lane 10
oats
1972
lane 13
potatoes 1973
lane 12
potatoes 1973
lane 07
rye
1971
lane 06
rye
1971
Figure 8. Dendrogram of DGGE patterns from samples of field plots that had received animal manure (brown), inorganic fertilizer (green), or animal manure plus a secondary crop (purple). The plots had been sampled in the year indicated after the harvest of the indicated crop
5.3
Replicates
In the two analytical series described above no replicates were included. We had elected to direct all analytical energy (read: space on the DGGE gels) towards analyzing as many samples as possible in short time. In a subsequent experiment however two sets of two replicates were included to get an impression of the variability of the analytical procedure. Replicates in this case were PCR-DGGE replicates, i.e. DGGE was performed on duplicate PCRs of the same DNA extracts. Densitometric profiling of the DGGE banding patterns thus obtained revealed similarities of 98.5 and 95.7 % respectively for the two sets of duplicates.
Alterra-rapport 916
23
5.4
Effect of soil type
The above replicates were part of an analytical series in which the DGGE profiles of two sets of soils were compared on the same gel (Fig. 9). One soil was a clay soil, the other one was a sandy soil. With the naked eye there were clear-cut differences between the two sets of banding patterns from the different soils. A dendrogram of the profiles indeed gave a distinct clustering per type of soil (Figure 10). Principal component analysis also indicated that the samples of the two soils formed two separate clusters (Fig. 11).
Figure 9. DGGE analysis of samples from a sandy soil and a clay soil
Pearson correlation [0.0%-100.0%]
100
98
96
94
92
90
88
86
84
82
80
78
DGGE
100 97 91 100
89
100 76 100 68 100 78 100
lane 14 field 02 sand
1965
lane 17 field 02 sand
1965
lane 12 field 01 sand
1965
lane 13 field 02 sand
1947
lane 16 field 02 sand
1947
lane 02 field 01 clay
1932
lane 03 field 03 clay
1942
lane 09 field 19 clay
1942
lane 10 field 19 clay
1950
lane 04 field 03 clay
1950
lane 05 field 04 clay
1932
lane 06 field 04 clay
1942
lane 07 field 04 clay
1950
Figure 10. Dendrogram of DGGE patterns from samples of field plots on a sandy soil (red) and a clay soil (blue)
24
Alterra-rapport 916
Figure 11. Quantitative principle component analysis of DGGE profiles from a sandy soil (red dots) and a clay soil (blue dots)
Among the samples from the sandy soil those taken in 1947 were somewhat different from those taken in 1965 (Fig. 10). In the series from the clay soil there were distinct differences between some of the samples, but a distinct pattern could not be distinguished.
5.5
Effect of manure and compost on a sandy soil
In a last screening a series of soil samples from experiment Pr 65 was analyzed. This experiment was started in 1927. It concerns an arable field on sand. The ten treatments applied to this soil are given in Table 2. Thirty samples from three different years (1948, 1954 and 1955) were analyzed. Because of the high number of samples for gel analysis the series had to be split in two sub-series. The sub-series were run on different gels, with one of the samples being run on each of these gels as a sort of internal standard. Following the results described above for the samples from soils that had or had not seen animal manure for many years, our hypothesis for the screening of the samples from experiment Pr 65 was that the samples from treatments 1 and 2 and possibly 5 would be clearly separated from the other samples that had not received organic amendments. The dendrogram presented in Figure 12 shows that this was indeed largely the case. With only one exception (six out of seven) the samples that had not received organic amendments clustered apart from the samples that had received organic amendments. All these samples had been run on the same gel to make a proper comparison possible. On the second gel 14 more samples from plots that had not received organic amendments were analyzed, plus
Alterra-rapport 916
25
one sample from a plot that had received manure. Again this sample was clearly separated from the samples that had not received manure (see Appendix). Within the series of samples that had not received organic amendments some large differences were observed between some groups of samples. The logic behind this grouping is presently not clear. The year of sampling (or the type of crop) cannot be distinguished as a major factor, and neither can the type of fertilizer regime be distinguished as a clear factor. Pearson correlation [0.0%-100.0%]
100 91 91 92 100 93
100 90
89 100 70 82 97 100
100
95
90
85
80
75
70
65
60
55
50
45
40
35
30
25
DGGE
.lane 04
field 1
1948
.lane 05
field 2
1948
.lane 07
field 5
1948
.lane 12
field 5
1954
.lane 10
field 2
1954
.lane 14
field 2
1955
.lane 15
field 3
1955
.lane 16
field 5
1955
.lane 02
field 1
1955
.lane 13
field 6
1954
.lane 17
field 6
1955
.lane 11
field 3
1954
.lane 08
field 6
1948
.lane 03
field 4
1955
.lane 06
field 3
1948
Figure 12. Dendrogram of DGGE gels from samples of field plots that had received organic amendments (brown) or inorganic fertilizer only (green)
26
Alterra-rapport 916
6
Discussion
We have shown that it is possible to obtain DGGE profiles from samples that have been stored for more than 50 years. This is very encouraging as it opens up new avenues for studying the effects of gradual environmental changes on changes in the microbial diversity in soils. Despite that we were able to obtain DGGE profiles from these soil samples, we can not exclude that the population before drying has indeed been affected and changed as a result of drying and storage. In the testing we have done, drying of fresh samples was included. From this we anticipate minor changes during drying and storage. On the other hand, this drying may have benefits as well: by drying one may very well exclude the dominant groups of transient microorganisms present in the rhizosphere at the moment of sampling. Further work is needed to evaluate exactly how drying and grinding of the soil affects the PCRDGGE profile that subsequently can be retrieved. Another encouraging result of the present research is that our data-set shows distinct differences between profiles from soils that have received manure (organic amendments) from soils that have not received such amendments. Environmental factors indeed influence the soil microbial diversity to such an extent that these changes can still be quantified 50 years later. These changes are therefore highly likely to stay and certainly not transitory. Per se it is not unexpected that a long-term practice of giving organic supplements affects the composition of the soil microbial diversity in the soil. Indeed one of the objectives of the long term experiments from which these sample series were taken was to evaluate the effect of the long term gift of especially animal manure on the organic matter content of the soil, and one of the conclusions was that such gifts result in the accumulation of organic matter in the soil. Organic matter is known to affect the microbial composition of the soil, either directly by serving as a slowly degradable substrate, or indirectly by affecting the environmental conditions (water content, O2 diffusivity etc.) of the soil. For the present research we used universal primers for the PCR procedure. In future work it will be interesting to use more group specific primers to evaluate the effect of environmental and management conditions on specific groups of bacteria or archea in the soil. Our results give some indication of the rate with which long term changes in soil microbial diversity may occur. Experiment Pr 168 was started in 1940 and the first samples analyzed were from 1956. In those samples the treatment effect was already clearly visible. Thus within 16 years the flora had responded. Experiment Pr 65 had started in 1927 and the first samples analyzed were from 1948. Here effects were again clearly visible, i.e. effects were visible within 21 years. Obviously one of the challenges for future work will be to find and analyze time series on the effect of organic amendments where samples are also available for the years immediately following the start of the experiment. Presently searching time series in TAGA is time consuming and not very user friendly. It would be a major improvement to have
Alterra-rapport 916
27
a searchable database on which samples from which experiments are available in TAGA. The strategy employed in the present research was rather opportunistic. Originally the idea was to select a few old time series from a sandy and a clay soil that had or had not received manure for a series of years, and that were used to grow various crops in rotation or were under grass. Finding such series proved to be relatively time consuming. A subsequent setback was that the older experiments were run without replication. Thus strictly speaking it is not possible to conclude from e.g. the results of experiment Pr 168 that the observed effect is caused by the treatment imposed, especially (but not only) since no samples were available from time zero to check (proof) that at time zero the material was identical. In the present research this obstacle was at least partially neutralized by using parallel treatments that were almost identical. Furthermore the trend was observed in samples from various independent experiments. TAGA gives access to approximately 250,000 soil samples from a range of experiments, soil types and locations and land use. Especially land use changes may be interesting to check for changes in microbial diversity and probing whether these changes are reversible.
28
Alterra-rapport 916
7
Conclusions
We have shown in a series of experiments that it is possible to obtain DGGE banding patterns as an indicator of microbial diversity from soil samples that have been stored for more than 50 years. This opens up the possibility to re-analyze soils that have been stored for sequential influence of environmental changes. Such analyses may provide an answer as to the degree of vulnerability of soil functioning and microbial diversity to gradual human induced environmental changes such as climate change and agricultural intensification. The banding patterns observed in our analyses appear indeed to be influenced by the history of the soil sample analyzed. Thus it is possible to obtain information from archived soil samples on the history of the soil sample and hence on the effect of environmental parameters on the soil microflora at the time the sample was taken. If microbial diversity would change swiftly in response to warmer and drier summers (climate change) from year to year, this might be observed with DGGE. However, if such changes occur more slowly or not at all they may remain invisible. Further research is needed to assess the effect of storage (including drying and grinding of the sample) on the DGGE banding pattern obtained from those samples. The present results should be regarded as a first step towards unlocking the microbial information present in archived soil samples. More specific methods (including sequencing of PCR amplified DNA from those samples) will undoubtedly provide more specific information on the type of organisms present in those samples.
Alterra-rapport 916
29
8
Recommendations
The present project was carried as part of Alterra’s Strategic Research Program (SEO). One of the objectives of this program was to strengthen Alterra’s market position by exploring innovative areas of research. The present research obviously fits within this scope. The results have increased the value of TAGA as a source of information on long term trends in the quality of agricultural soils, and they have opened avenues for scientific research on microbial diversity in soils. To fully cash in on TAGA’s potential and to explore these scientific avenues more research is needed. The recommendations to achieve these objectives include: • • • • •
Apply PCR-DGGE on TAGA with other primers (e.g. for nitrifiers, archea, fungi) to assess additional microbial functions; Perform additional research on the effects of drying and grinding on soil samples as stored in TAGA to identify any further artifacts; Apply PCR-DGGE on series of TAGA samples with replicate treatments; Perform other microbiological tests on TAGA samples (e.g. Biolog™) or measures of biological activity with specific soil relevant substrates to assess any changes in potential activity ; Make TAGA information more accessible.
Alterra-rapport 916
31
Literature
Badalucco, L., & P.J. Kuikman, 2001. Mineralization and immobilization in the rhizosphere. In: The Rhizosphere: Biochemistry and Organic Substances at the Soil-Plant Interface (R. Pinto, Z. Varanini & P. Nannipieri, editors), pp. 159-196. Bloem, J. & A.M. Breure, 2003. Microbial indicators. In: Bioindicators/Biomonitors – Principles, Assessment, Concepts (B.A. Markert, A.M. Breure & H.G. Zechmeister, editors), pp. 259-282. Elsevier, Amsterdam. Dilly O., J. Bloem, A. Vos & J.C. Munch, 2004. Bacterial diversity during litter decomposition in agricultural soils. Applied and Environmental Microbiology 70: Ehlert P., E. Leeters & A. Olsthoorn, 2002. Integratie en operationalisatie van strategische archieven binnen Alterra, TAGA-, BIS- en Dorschkamparchief. Alterra-rapport 485, Wageningen. Griffiths, B.S., K. Ritz, R. Wheatly, H.L. Kuan, B. Boag, S. Christensen, F. Ekelund, S.J. Sørensen, S. Muller & J. Bloem, 2001. An examination of the biodiversity-ecosystem function relationship in arable soil microbial communities. Soil Biology and Biochemistry 33: 1713-1722. Kortleven J., 1963. Kwantitatieve aspecten van humusopbouw en humusafbraak.. Verslagen van landbouwkundige onderzoekingen nr 69.1. Pudoc, Wageningen. Kuikman, P.J., N. Naumova, A. Vos, & J. Bloem. 1999. Backtracking changes in soil microbial biodiversity: Impact of land-use and land-use change. Abstracts Bodembreed, Lunteren, the Netherlands, page1. Muyzer G., E.C. de Waal, & A.G. Uitterlinden, 1993. Profiling of complex microbial populations by denaturing gradient gel electrophoresis analysis of polymerase chain reactionamplified genes coding for 16S rRNA. Applied and Environmental Microbiology 59, 695-700. Smalla K., G. Wieland, A. Buchner, A. Zock, J. Parzy, S. Kaiser, N. Roskot, H. Heuer, & G. Berg, 2001. Bulk and rhizosphere soil bacterial communities studied by DGGE: plant-dependent enrichment and seasonal shifts revealed. Applied and Environmental Microbiology 67: 4742-4751. Wieland G., R. Neumann. & H. Backhaus, 2001. Variation in microbial communities in soil, rhizosphere, and rhizoplane in response to crop species, soil type, and crop development. Applied and Environmental Microbiology 67: 5849-5854. Willigen P. de, P.F.A.M. Römkens & P.A.I. Ehlert, 2001. Datamining TAGA voor achtergrondgehalten zware metalen. Alterra-rapport 261, Wageningen.
Alterra-rapport 916
33
Wisselink G.J., 1961. Een vijftienjarige proef met stalmest en stoppelgewassen op humeuze zandgrond te Heino. Verslagen van landbouwkundige onderzoekingen nr. 66.17. Pudoc, Wageningen.
34
Alterra-rapport 916
Appendix 1 Samples analyzed in the present study Table A1. Samples analyzed from Pr 65. The samples were run on gel D974. Code A162489 A162492 A7631 A7632 A7633 A7635 A7636 A147409 A147410 A147412 A147413 A162490 A162491 A162493 A162494
DGGE lane 2 3 4 5 6 7 8 10 11 12 13 14 15 16 17
Treatment manure +P NPK manure +P manure + P NPK compost + P no additions manure + P NPK compost + P no additions manure + P NPK compost + P no additions
Field code 1 4 1 2 3 5 6 2 3 5 6 2 3 5 6
Year of sampling 1955; oats 1955; oats 1948; potatoes 1948; potatoes 1948; potatoes 1948; potatoes 1948; potatoes 1954; oats 1954; oats 1954; oats 1954; oats 1955; oats 1955; oats 1955; oats 1955; oats
Table A2. Samples analyzed from Pr 65 continued. The samples were run on gel D980. Code A162489 A162492 A7634 A7637 A7638 A7639 A7640 A147414 A147415 A147416 A147417 A162495 A162496 A162497 A162498
DGGE lane 2 3 4 5 6 7 8 10 11 12 13 14 15 16 17
Treatment manure +P NPK NPK NPK PK NK NP NPK PK NK NP NPK PK NK NP
Field code 1 4 4 7 8 9 10 7 8 9 10 7 8 9 10
Year of sampling 1955; oats 1955; oats 1948; potatoes 1948; potatoes 1948; potatoes 1948; potatoes 1948; potatoes 1954; oats 1954; oats 1954; oats 1954; oats 1955; oats 1955; oats 1955; oats 1955; oats
Table A3. Samples analyzed from Pr 109. The samples were run on gel D963, i.e. on the same gel as the samples from Pr 927 described in Table A6. Code 32246 245697 A65771 32240 245698 A65772 245713 A65787
DGGE lane 2 3 4 5 6 7 9 10
Treatment no manure, ammonium manure*, saltpeter manure*, saltpeter no manure, no nitrogen manure*, no nitrogen manure*, no nitrogen no manure, ammonium no manure, ammonium
Field code 1 3 3 4 4 4 19 19
Year of sampling 1932 1942 1950 1932 1942 1950 1942 1950
*: manure was given in 1934 and 1939.
Alterra-rapport 916
35
Table A4. Samples analyzed from experiment Pr 168 after cultivation of rye. Analysis was on gel D967. Code 72664 181502 181501 282501 282500 327196 327195 353748 353747 377339 377338 403718
DGGE lane 2 3 4 5 6 7 9 10 11 12 13 14
Treatment Manure N, P, K Manure N, P, K Manure N, P, K Manure N, P, K Manure N, P, K Manure Manure
Field code 9 10 9 10 9 10 9 10 9 10 9 9
Year of sampling 1950 1956 1956 1962 1962 1965 1965 1968 1968 1971 1971 1974
Table A5. Samples analyzed from experiment Pr 168. Analysis was on gel D959. Code A215512 A215511 A377339 A377338 A377330 A387896 A387895 A387887 A398698 A398697 A398689
DGGE lane 2 3 5 6 7 9 10 11 12 13 14
Treatment no manure or secondary crop manure no manure or secondary crop manure manure plus secondary crop no manure or secondary crop manure manure plus secondary crop no manure or secondary crop manure manure plus secondary crop
Field code 10 9 10 9 1 10 9 1 10 9 1
Year of sampling 1958; potatoes 1958; potatoes 1971; rye 1971; rye 1971; rye 1972; oats 1972; oats 1972; oats 1973; potatoes 1973; potatoes 1973; potatoes
Table A6. Samples analyzed from Pr 927. The samples were run on gel D963, i.e. on the same gel as the samples from Pr 109 described in Table A3. Code A314681 479930 A314682 479930 A314682
DGGE lane 12 13 14 16* 17*
Treatment straw, low N no straw, no N no straw, no N no straw, no N no straw, no N
Field code 1 2 2 2 2
Year of sampling 1964; oats 1947; beans 1964; oats 1947; beans 1964; oats
*: samples analyzed on lanes 16 and 17 were replicates of samples analyzed on lanes 13 and 14 respectively.
36
Alterra-rapport 916
Appendix 2 DGGE profiles of soil samples analyzed in the present study Code D967 D959 D963 D974 D980
experiment Pr168: effect of animal manure Pr168: effect of animal manure and secondary crops Pr109 and Pr 927: effect of soil type; similarity of replicates Pr65: effect of organic amendments Pr65: effects of organic amendments (continued)
Figure A1. DGGE profile D967
Alterra-rapport 916
37
Figure A2. DGGE profile D959
38
Alterra-rapport 916
Figure A3. DGGE profile D963
Alterra-rapport 916
39
Figure A4. DGGE profile D974
40
Alterra-rapport 916
Figure A5. DGGE profile D980
Alterra-rapport 916
41
Appendix 3 Dendrograms of the DGGE gels presented in Appendix 2
Pearson correlation [0.0%-100.0%]
100
95
90
85
80
DGGE
100 71
77
100 98 89
63
100 96 64 100
...04
.veld 09
SEO 27
..stalmest + 1956
..
...06
.veld 09
SEO 29
..stalmest + 1962
..
...02
.veld 09
SEO 25
..stalmest + 1950
..
...13
.veld 09
SEO 35
..stalmest + 1971
..
...14
.veld 09
SEO 36
..stalmest + 1974
..
...11
.veld 09
SEO 33
..stalmest + 1968
..
...09
.veld 09
SEO 31
..stalmest + 1965
..
...07
.veld 10
SEO 30
..stalmest -
1965
..
...12
.veld 10
SEO 34
..stalmest -
1971
..
...10
.veld 10
SEO 32
..stalmest -
1968
..
...03
.veld 10
SEO 26
..stalmest -
1956
..
...05
.veld 10
SEO 28
..stalmest -
1962
..
Pearson correlation [0.0%-100.0%]
100
98
96
94
92
90
88
86
84
82
80
78
DGGE
100 94 97 97
100
78
96 75 75 100
...09
...haver
stalmest - stop. gewas -
1972
...05
...rogge
stalmest - stop. gewas -
1971
...14
...aardappelen
stalmest + stop. gewas +
1973
...03
...aard
stalmest +
1958
...02
...aard
stalmest - stop. gewas -
1958
...11
...haver
stalmest + stop. gewas +
1972
...10
...haver
stalmest +
1972
...13
...aardappelen
stalmest +
1973
...12
...aardappelen
stalmest - stop. gewas -
1973
...07
...rogge
stalmest + stop. gewas +
1971
...06
...rogge
stalmest +
1971
Pearson correlation [0.0%-100.0%]
100
98
96
94
92
90
88
86
84
82
80
78
DGGE
100 97 91 100
89
100 76 100 68 100 78 100
Alterra-rapport 916
.14
veld 02
SEO-24
klei
proef 927 1965 314682
.17
veld 02
SEO-24
klei
proef 927 1965 314682
.12
veld 01
SEO-22
klei
proef 927 1965 314681
.13
veld 02
SEO-23
klei
proef 927 1947 479930
.16
veld 02
SEO-23
klei
proef 927 1947 479930
.02
veld 01
SEO-13
zand proef 109 1932 32246
.03
veld 03
SEO-14
zand proef 109 1942 245697
.09
veld 19
SEO-19
zand proef 109 1942 245713
.10
veld 19
SEO-20
zand proef 109 1950 65787
.04
veld 03
SEO-15
zand proef 109 1950 65771
.05
veld 04
SEO-16
zand proef 109 1932 32240
.06
veld 04
SEO-17
zand proef 109 1942 245698
.07
veld 04
SEO-18
zand proef 109 1950 65772
43
Pearson correlation [0.0%-100.0%]
100
90
80
70
60
50
40
30
DGGE
100 91 91 92 100 93
100 90
89 100 70 82 97 100
...04
.....1
17-08-1948
..
...05
.....2
17-08-1948
..
...07
.....5
17-08-1948
..
...12
.....5
21-10-1954
..
...10
.....2
21-10-1954
..
...14
.....2
30-08-1955
..
...15
.....3
30-08-1955
..
...16
.....5
30-08-1955
..
...02
.....1
30-08-1955
..
...13
.....6
21-10-1954
..
...17
.....6
30-08-1955
..
...11
.....3
21-10-1954
..
...08
.....6
17-08-1948
..
...03
.....4
30-08-1955
..
...06
.....3
17-08-1948
..
Pearson correlation [0.0%-100.0%]
100 63 100 63 100 74
80
91
100
95
100 99
97
100
44
100
95
90
85
80
75
70
65
60
55
50
45
40
35
30
25
DGGE
.. .08 ....10
17-08-1948 ..
.. .11 ....8
21-10-1954 ..
.. .07 ....9
17-08-1948 ..
.. .10 ....7
21-10-1954 ..
.. .12 ....9
21-10-1954 ..
.. .13 ....10
21-10-1954 ..
.. .15 ....8
30-08-1955 ..
.. .04 ....4
17-08-1948 ..
.. .05 ....7
17-08-1948 ..
.. .06 ....8
17-08-1948 ..
.. .14 ....7
30-08-1955 ..
.. .17 ....10
30-08-1955 ..
.. .16 ....9
30-08-1955 ..
.. .02 ....1
30-08-1955 ..
.. .03 ....4
30-08-1955 ..
Alterra-rapport 916
Appendix 4 Quantitative Principle Component Analysis of the gels presented in Appendix 2 D967 Stable manure - green Stable manure + brown
1965 1956 1971 1962
1950
1968
1962
1974 1968
1956
1965
1971
Alterra-rapport 916
45
D959 Stable manure – secondary crop – Stable manure + secondary crop + Stable manure + secondary crop –
green yellow brown
1973 1971
1972 1972
1972 1973
1971 1973
1971
1958 1958
46
Alterra-rapport 916
D963 Pr109 Location 1 Location 3 Location 4 Location 19
light green red lila yellow
(1x) (2x) (3x) (2x)
Location 1 Location 2 Location 2
light blue dark blue brown (replicates of dark blue)
(1x) (2x) 1947a en 1965a (2x) 1947b en 1965b
Pr927
1947a
1947b
1965b
1965a
Alterra-rapport 916
47
D974 Treatment 1 Treatment 2 Treatment 3 Treatment 4 Treatment 5 Treatment 6
light green red lila yellow light blue dark blue
1955 1954
1948
1954 1948 1948
1955 1948 1954+1955
1955 1954 1955 1948
1955
48
Alterra-rapport 916
D980 Treatment 1 Treatment 4 Treatment 7 Treatment 8 Treatment 9 Treatment 10
light green yellow brown dark purple dark green grey
1955
1948 1954 1948 1948
1948 bruin 1948 paars
1955 1948 1954 1948 1955
1955
1955 1955
Alterra-rapport 916
49
Appendix 5 Qualitative Principle Component Analysis of the gels presented in Appendix 1 D967 Stable manure - green Stable manure + brown
1962 1971 1971
1962
1965
1956 1968
1950
1956 1974 1968
1965
Alterra-rapport 916
51
D959 Stable manure – secondary crop – Stable manure + secondary crop + Stable manure + secondary crop –
green yellow brown
1973
1973
1973 1971
1958
1972
1972 1958 1972
1971 1971
52
Alterra-rapport 916
D963 Pr109 Location 1 Location 3 Location 4 Location 19
light green red lila yellow
(1x) (2x) (3x) (2x)
Location 1 Location 2 Location 2
light blue dark blue brown (replicates of dark blue)
(1x) (2x) 1947a en 1965a (2x) 1947b en 1965b
Pr927
1947b
1947a
1965a
1965b
Alterra-rapport 916
53
D974 Treatment 1 Treatment 2 Treatment 3 Treatment 4 Treatment 5 Treatment 6
light green red lila yellow light blue dark blue
1955
1955 1955
1948
1954
1955
1954
1954
1948 1954
1955
1948
1948 1948
1955
54
Alterra-rapport 916
D980 Treatment 1 Treatment 4 Treatment 7 Treatment 8 Treatment 9 Treatment 10
light green yellow brown dark purple dark green grey
1955
1954 1948 1948 1955 1948 1948
1954
1955 1955
1954 1955
1948
1954
1955
Alterra-rapport 916
55