Some Operators from Mathematical Morphology for the Visual Analysis of Georeferenced Data ´ Fabio Dias and Luis Gustavo Nonato ICMC - USP
[email protected],
[email protected]
Abstract The framework of Mathematical Morphology was recently extended to graphs and other digital structures. However, its operators are almost exclusively used for image processing applications. Our main research objective is to explore the operators from mathematical morphology for Visual Analysis. The main objective of this work is to explore mathematical morphology as a tool for visualization of graph-based georeferenced data, through visual programming. 1. Introduction Our research objective is to expand the applications of the framework of mathematical morphology to a more general context. In this work, we start by exploring some operators on graphs to explore georeferenced data. In particular, we explore granulometry-based operators and the watershed algorithm. 2. Visual Programming and Mathematical Morphology
(a)
(b)
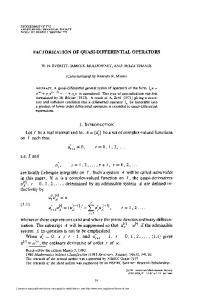
Figure 3: Data filtering example. (a) Coarse patterns of average income; (b) Regions in which the average income is lower than its neighbors.
To offer the full flexibility of the framework to the user, we provide the operators through visual programming [1], allowing the user to combine the available operators. This approach is interesting because several operators of the framework of mathematical morphology are defined by combining existing operators, therefore, by offering a basic set of operators, we can indeed offer most of the existing operators to the user.
Figure 1: Example of the visual programming interface showing a visual program that computes one of the morphological gradients. We provide dilation, erosion, opening and closing operators, following the definition of integer operators from Cousty et. al [2], along with the watershed operator, providing both the classic algorithm with markers, e.g. [4] and the watershed cut [3]. We also included some additional tools such as absolute value, minimum, maximum, difference, normalization, percentage and threshold.
Figure 4: Results of the watershed cuts, representing regions of influence of local minima. (a) Considering the original data; (b) After smoothing filtering.
3. Results
4. Conclusion
We consider the census information from the Brazilian Institute of Geography and Statistics [5], that provides both the geographical regions and indicators from the 2010 Brazilian census. Using the geographical data, we created a graph where each municipality is represented as a node, and two nodes are linked by an edge if they share borders. The graph has 5, 565 nodes and 15, 960 edges. Two different portions of this graph are depicted in 2, also illustrating the difference in the areas and connectivity of the municipalities.
In this work we explored the framework of mathematical morphology for visual analysis of graph-based, georeferenced information. While our objective was to illustrate that the tools provided by this framework are suitable to such applications, we do believe that new and interesting developments can be made by further research in this topic. Acknowledgments Grant #2014/12815 − 1, FAPESP. The views expressed are those of the authors and do not reflect the official policy or position of FAPESP. References
(a)
(b)
Figure 2: Portions of the graph structure, illustrating the difference between the geographical distance and the graph distance. (a) Large municipalities around Manaus; (b) Small municipalities in the northeast coast. As illustrated in figure 3, the data filtering operators, can reveal both coarse and fine patterns in the data, including to reduce the over segmentation in the watershed results, as depicted in figure 4.
[1] Google. Blockly. [Online]. Available: https://developers.google.com/blockly/ [2] J. Cousty, L. Najman, F. Dias, and J. Serra, “Morphological filtering on graphs,” Computer Vision and Image Understanding, vol. 117, no. 4, pp. 370–385, 2013. [3] J. Cousty, G. Bertrand, L. Najman, and M. Couprie, “Watershed cuts: Minimum spanning forests and the drop of water principle,” IEEE Transactions on Pattern Analysis and Machine Intelligence, vol. 31, pp. 1362–1374, 2009. [4] L. Najman and H. Talbot, Mathematical Morphology.
Wiley, 2010.
[5] IBGE. Censo 2010. [Online]. Available: http://censo2010.ibge.gov.br/en/censo-2010
WVIS 2015, 6th Workshop on Visual Analytics, Information Visualization and Scientific Visualization - SIBGRAPI 2015 - Conference on Graphics, Patterns and Images, 26-29 August 2015, Salvador, Brazil.