Some Problems in Application of Information Spectrum Method and Resonant Recognition Model for Cross-spectral Analysis of DNA/RNA Sequences Vladimir B. Baji´c1 and Ivan V. Baji´c2 Centre for Engineering Research, Technikon Natal, P.O.Box 953, Durban 4000, South Africa E-mail:
[email protected] 2 University of Natal, Department of Electronic Engineering, King George V Avenue, Durban 4001, South Africa 1
It is shown why, in the opinion of the authors, the ISM (RRM) will virtually always produce misleading results. The discussion is supported by two examples.
Abstract - The Information Spectrum Method (ISM) and the Resonant Recognition Model (RRM) represent a methodology based on signal processing that analyses characteristic spectral motifs in DNA/RNA and protein sequences. Some inconsistencies have been reported recently with regard to the spectral characterization of speciÞc biological sequences utilizing the ISM (RRM) and this motivated examination of the basics of the ISM (RRM). This note provides some discussions on the methodology on which the ISM and RRM are based and shows a potential reason why the ISM and the RRM produce inaccurate and unreliable results. Two examples are given to backup the analysis and discussion. I.
II.
ISM and RRM
The ISM (RRM) considers biological sequences (DNA/RNA and proteins) as Þnite length signals. DNA/RNA are sequences composed of only 4 different types of nucleotides, while proteins are sequences composed of 20 different types of aminoacids. Hence, in their conversion to the form suitable for the application of signal processing, speciÞc numbers are allocated to each of the nucleotides and each of the amino-acids. This is normally done by means of the so-called Electron-Ion Interaction Potential (EIIP) which correlates some physical characteristics of nucleotides and amino-acids and some biological properties of organic molecules [7]. These numerical values are precalculated and can be found in [4]. After assigning the relevant EIIP values to the elements of biological sequences, they become simply numerical sequences of Þnite length. From this point on, the extraction of the spectral informational content of a selected group of biologically related sequences may be considered to be an engineering problem. The ISM (RRM) theory is aimed at Þnding the spectral characterization, the so-called consensus spectrum, of a group of sequences that have the same or similar type of biological functions. It is not known yet what are all the factors that determine the biological function of a particular sequence. However, it is generally considered that the structure of the sequence is one of the most important factors. Our interest here will be focused only on the structure of the sequence. The basis of the ISM (RRM) is the classical crossspectral analysis. Because the sequences from one functional group, say promoters, normally have dif-
Introduction
In the last 13 years a conceptually interesting methodology for the analysis of DNA/RNA and protein sequences, named initially the Information Spectrum Method (ISM) [1], [2], [3], has been developed. In order to better correspond to the hypothetical selective resonant interaction of biomolecules, and after some further development, it was later renamed the Resonant Recognition Model (RRM) [4], [5]. This theory treats biological sequences as Þnite length digital signals and attempts to apply methods of signal processing to extract relevant spectral information from these signals. Utilizing the methodology proposed for the ISM (RRM), some inconsistencies have been reported in [6] with regard to the spectral characterization of speciÞc biological sequences. This gave rise to interest in examining the foundation of the ISM (RRM) which relates to signal processing and to Þnd possible reasons for the discrepancy in results. In this note discussion of the background of the ISM (RRM) related to the utilization of spectral analysis is given. 1
ferent lengths, the shorter sequences are extended to the length of the longest one in the examined group in order to enable the calculation of cross-spectrum. For this we cite [1], p.338, : ”Comparison of sequences of different length is done by padding out the shorter sequences with zeros to the length of the longest sequence before comparing the DFT. The padding operation may cause error in deÞning peak frequencies. It is interesting that in almost any group of biologically related sequences, the length of sequences do not vary by much. In the case of the great varying length of signals, component spectra are of a shape such that there is only a minor error resulting by padding operation.” The authors of this note are of the opinion that this is not correct in the context of the cross-spectral analysis of biological sequences. In what follows we will restrict our consideration only to the DNA/RNA sequences. For this reason we will refer to the biological sequences as genetic sequences. We point out that the analogous consideration holds for protein sequences. For some more details on the ISM and the RRM we will explain the process of signal processing used in these methods. Let us consider a group Γ of s numerical sequences, Γ = {yi } , i = 1, 2, ..., s, which relate to one speciÞc biological function. These sequences are Þrstly detrended, so that a new set ΓD of detrended sequences {xi } is obtained. Let the longest sequence in ΓD be xL with the length N . Due to different lengths of xi -s all those sequences xi that are shorter than xL are padded by zeros up to the length of xL in order to make a set of sequences of the same length so as to provide the possibility of calculating their cross-spectrum. Then the discrete N points Fourier transform (DFT) is computed for each of the sequences. If Xi (n), n = 0, 1, ..., N − 1, is the DFT of xi , then the consensus magnitude spectrum of all sequences from ΓD is obtained as s Y |Xi (n)| . The consensus spectrum is norS(n) =
sus spectrum contains only one sufficiently signiÞcant characteristic frequency component, which is unique for the group, but differs from group to group. In the ISM and the RRM a frequency component with the magnitude M is considered signiÞcant if M ≥ m, where m is the mean value of components in the consensus spectrum [4]. The ISM (RRM) theory proposed is attractive and, if proved, will lead to the interesting implication that many of the biological functions are characterized by one speciÞc frequency each in the normalized spectrum. However, applying this methodology in [6] to a group of promoter sequences, it was found that different subsets of the same promoter region set have mutually different characteristic frequencies, which were also different from the characteristic frequency of the whole group. This necessitated the examination of the basics of the ISM and the RRM, the results of which are shown in the next sections. III.
Problem background
The signals (numerical sequences) obtained from the genetic sequences are discrete, have Þnite length, and the magnitudes of signal components take values from two well deÞned sets Sn and Sa with Þnite number of elements each (the set Sn has 4 elements representing the values of EIIP for nucleotides, while the set Sa has 20 elements representing the EIIP values for amino acids). The domain D of deÞnition of a genetic sequence s is Þnite and strictly discrete and is deÞned by D = {kd} , where k = 1, 2, ..., n, and d is the distance between the nucleotides in DNA/RNA (or the distance of neighboring amino acids in proteins). In the cross-spectral analysis of DNA/RNA sequences, one of the main problems is that of comparing the spectra of two Þnite-length sequences of different lengths. Consider the sequences x1 (n), n = 0, 1, . . . , N1 − 1, of length N1 and x2 (n), n = 0, 1, . . . , N2 − 1, of length N2 , such that N1 < N2 . If X1 (k) and X2 (k) are the DFTs of x1 and x2 , respectively, then their respective domains of deÞnition in the normalized spatial frequency domain, are given by S1 = {k/N1 | k = 0, 1, . . . , N1 − 1} S2 = {k/N2 | k = 0, 1, . . . , N2 − 1}
i=1
malized with regards to frequency by assuming that the distance between the nucleotides in DNA/RNA is constant with the distance of d = 1 in suitably deÞned units, so that the range of the normalized frequencies of non-redundant components in the spectrum is [0, 0.5]. The spectrum is also normalized with regards to the spectral components magnitude, so that the maximal magnitude is of size 1. We will discuss only the magnitude consensus spectrum since it is considered relevant for the ISM (RRM) cross-spectrum calculation. After analyzing a number of functional groups of biological sequences by the above mentioned procedures, it is hypothesized in [1], [4], [5], for a number of such groups, that each group in its consen-
To make a meaningful comparison of the two spectra possible, as well as to compute the cross-spectrum of these two sequences, the sets S1 and S2 have to be the same. One possible way to achieve this is by extending the shorter sequence x1 by adding N2 −N1 components to its end, i.e. to create a sequence ½ x1 (n), n = 0, 1, . . . , N1 − 1 (e) x1 (n) = e(n), n = N1 , . . . , N2 − 1 2
where e(n) denotes the extension. Suitable choice of (e) e(n) will ensure that x1 retains all the signiÞcant characteristics of x1 while at the same time minimizes the errors introduced by extension. Several forms of extension, such as periodic, zero-padding, symmetric, etc., are widely used in various Þelds of signal processing [11]. However, with any such extension we also introduce (implicitly) the assumption that the new sequence will retain the same biological function. Otherwise, Þnding the crossspectrum to characterize a group of functionally related sequences would lose meaning. Although our problem is analysis in the spectral domain, the alterations that may be introduced to the form of the original sequence, to make the spectral analysis more convenient, are not allowed if the interpretation of the biological functionality of the sequence is to be retained. Any assumption about the nature (behavior) of the biological sequence s out of the original domain D of its deÞnition, which includes also the points in between the known signal components, is not correct. If we assume that the genetic sequence s is altered in any way by adding to it new components for whatever reason, this implies the change of the domain D of deÞnition of the sequence. However, as soon as the original domain D of the sequence is changed, its original biological function is not guaranteed, i.e. it is most probable that the new sequence will not have the same or even similar biological function, or it may not have any particular biological function at all. ISM (RRM) methodology proposes the zeropadding extension of the shorter sequence, i.e. e(n) = 0, n = N1 , . . . , N2 − 1, using the argument that the value of the EIIP is indeed zero outside of the original biological sequence. While this argument might seem to be plausible for isolated biological sequences such as proteins (although it may be questioned in view of the protein’s changing environment), it certainly cannot hold for segments of the DNA/RNA sequence, as they are not isolated from the rest of the DNA/RNA. We will show that there would be no use in making zero-padding for shorter sequences, since errors introduced by this operation might signiÞcantly modify the Þnal result of the cross-spectral analysis. IV.
the length of x1 . However, due to the fundamental limitations summarized in the uncertainty principle of Fourier analysis [12], zero-padding by itself cannot improve the quality of the spectral estimate. It merely provides a way of interpolation in the frequency domain and, in the absence of any knowledge about the behavior of the signal outside its original domain of deÞnition (as in our case), we cannot determine whether or not the interpolation is done on the correct curve. Examples are given in [13] and [14] to show that zero-padding cannot help resolve two frequency components whose separation in the frequency domain is less than the limit set by the physical resolution, implying that in such cases it is of little use. The problem is further complicated by the fact that spectra obtained by zero-padding the shorter sequences in ISM (RRM) analysis are being multiplied in the calculation of the cross-spectrum. Since zero-padding enforces the frequency domain convolution of the original frequency components with the rectangular window function WR , it creates signiÞcant ’noise’ sidelobes in regions between the original spectral components (the term ’noise’ is used in the context of the previous paragraph, to indicate that we cannot determine the exact shape of the spectrum in these regions). In the example of the previous section, each component of X1 (k), when convolved with WR , would add some ’noise’ to each of the intervals (k/N1 , (k+1)/N1 ), k = 0, 1, . . . , N1 −2. ’Noise’ contribution from each speciÞc component of X1 (k) may be relatively insigniÞcant, but the combined effect of ’noise’ produced by all original spectral components may easily result in the creation of ’noise’ components that are of the same order of magnitude or higher than the average of X1 (k), as will become obvious from the example in the following section. All of these newly created spectral ’noise’ components, for whose existence there is no support in the original spectrum of the signal x1 , now enter the process of cross-spectral multiplication, and become candidates to be recognized as frequency components common to signals x1 and x2 . Eventually this may lead to obtaining a characteristic frequency of a genetic sequence that is a product only of the spectral ’noise’ components.
Effects of zero-padding
V.
Zero-padding operation is usually used to improve the visual (or computational ) resolution of the spectrum. It enables the evaluation of the DFT at a greater number of points in the frequency domain than is allowed by the original length of the signal. In view of the discussion in the preceding section, it would allow the calculation of the spectrum of the signal x1 with resolution of 1/N2 instead of 1/N1 , which is the physical resolution dictated by
A.
Examples
Example 1
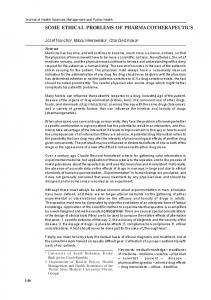
Let us assume that we want to Þnd the frequency that characterizes the common biological function of a group of sequences that include only sequences whose length is at most 32. Let us also assume that two hypothetical biological sequences, x1 and x2 , each of length 32, whose respective spectra are given in Fig.1, belong to the group. Each spectrum in 3
Fig.1 has only 3 non-zero components. It is easy to Þnd that the cross spectrum of x1 and x2 is identically zero, and thus the cross-spectrum of the whole group will yield only components of zero magnitude. Consequently, the frequency to characterize the common biological function of these sequences cannot be found (or, in the worst case, one of the sequences x1 or x2 does not possess the expected biological function of the group). Let us now assume that a new sequence x3 of the length 512 is found that has the same biological function as the sequences in the examined group. If it was known before that such a sequence exist it would be included into the cross-spectrum calculation. So, we repeat the process of cross-spectrum determination and consider only the cross-spectrum of x1 , x2 and x3 . According to the ISM (RRM), zero-padding of x1 and x2 has to be done up to the length of 512 and the new sequences obtained in this way are denoted as x1p and x2p . The envelope of the respective spectra for x1p and x2p , as well as the envelope of their cross-spectrum are given in Fig.2. As can be expected, the cross-spectrum of zero-padded sequences produced a lot of spectral components that did not exist in the original cross-spectrum of x1 and x2 . These new components can inßuence signiÞcantly the Þnal cross-spectrum. Moreover, the strongest spectral components in the cross-spectrum in Fig. 2 are not on the frequency positions of the non-zero components of the spectra for x1 and x2 given in Fig. 1. Thus the inconsistency.
1 0.8 Magnitude spectrum of x1 0.6 0.4 0.2 0 0
0.05 0.1
0.15 0.2
0.25 0.3
0.35 0.4
0.45 0.5
0.15 0.2 0.25 0.3 0.35 0.4 Normalized spatial frequency
0.45 0.5
1 0.8 0.6
Magnitude spectrum of x2
0.4 0.2 0 0
0.05 0.1
Figure 1 — Magnitude spectra of sequence x1 and x2
1.5
Spectrum of the sequence x1p
1
B.
0.5 0 0
0.05 0.1
0.15 0.2
0.25 0.3
0.35 0.4
0.45 0.5
0.35 0.4
0.45 0.5
A set of 40 human promoter sequences was extracted from GenBank and EMBL databases. Promoter region lengths varied from 87 to 606. The sequences were then divided into several groups according Table 1. Groups A and B are distinct subsets of the original set of sequences, sorted according to length. Group C was formed by combining some of the sequences from group A with some of the sequences from group B, while group D was formed by combining all of the sequences from groups A and B. In groups B, C and D the longest sequence is of length 606. We applied the ISM (RRM) procedure to groups B, C and D from Table 1. The resulting consensus spectra are shown in Figs. 3-5. Results are summarized in Table 2.
1 Spectrum of the sequence x2p 0.5
0 0
0.05 0.1
0.15 0.2
0.25 0.3
0.2 0.15
Cross-spectrum of x1p and x2p
0.1 0.05 0 0
0.05 0.1
0.15 0.2 0.25 0.3 0.35 0.4 Normalized spatial frequency
Example 2
0.45 0.5
The results obtained show that the calculated fRRM varies signiÞcantly depending on the selection of sequences included in the analysis. Characteristic frequencies fRRM obtained for different groups of sequences differ by an amount much larger than the computational resolution of the spectrum in each
Figure 2 — Magnitude spectra of zero-padded sequences x1p and x2p , and their cross-spetrum obtained with 512 points DFT
4
Group A B C D
Length ≤ 200 200 − 650 < 650 < 650
RRM consensus spectrum
1
Rounded av. length 141 348 300 265
0.9 0.8
Normalized amplitude
No. of seq. 16 24 10 40
Table 1. Four groups of sequences from the original set of 40 sequences
0.7 0.6 0.5 0.4 0.3 0.2
Group B C D
fRRM 0.0604 0.0858 0.0099
SNR 141.24 85.96 151.68
Comp. res. 1.65 × 10⁻³ 1.65 × 10⁻³ 1.65 × 10⁻³
0.1 0 0
Normalized amplitude
0.8 0.7 0.6 0.5 0.4 0.3 0.2 0.1
0.05
0.1
0.15
0.2 0.25 0.3 0.35 Normalized spatial frequency
0.4
0.45
0.15
0.2 0.25 0.3 0.35 Normalized spatial frequency
0.4
0.45
0.5
particular case. SNR in each group is found to be much larger than 20, which is the minimal value considered to be signiÞcant. Moreover, in each of the groups examined shorter sequences are zero-padded to the length of 606 what is the length of the longest sequence in the group. Thus, any of the frequencies obtained can, according to the ISM (RRM), be considered as a characteristic RRM frequency for the selected set of sequences. The problem, however, is that all these fRRM are different and hence unusable for the characterization of the selected group. Hence obvious discrepancy appears and the authors are of the opinion that it is due to the effects on the spectral content of spectra of individual zero-padded sequences.
RRM consensus spectrum
0.9
0 0
0.1
Figure 5 — RRM consensus spectrum for sequences in group D
Table 2. Results of ISM (RRM) analysis for three groups of sequences
1
0.05
0.5
Figure 3 — RRM consensus spectrum for sequences in group B C. RRM consensus spectrum
1
Our examples are made only for the illustration purpose to directly point out some problems in crossspectrum calculation if its determination is based on zero-padding of shorter genetic sequences. We also recall our opinion on the request that the original domain of genetic sequence deÞnition must not be altered due to the demands for the convenience of cross-spectral analysis.
0.9
Normalized amplitude
0.8 0.7 0.6 0.5 0.4
The conclusion based on these examples is that the other techniques have to be developed to handle the problem of cross-spectrum calculation for genetic sequences in a consistent and physically interpretable manner. One such technique based on the concept of ’blurred’ spectrum that is suitable for the analysis of biological sequences has been proposed in [10], [8], and has been successfully applied to the problem of promoter region recognition in [8] and [9].
0.3 0.2 0.1 0 0
0.05
0.1
0.15
0.2 0.25 0.3 0.35 Normalized spatial frequency
Comments
0.4
0.45
0.5
Figure 4 — RRM consensus spectrum for sequences in group C
5
VI.
Conclusions
[9] V. B. Baji´c, I. V. Baji´c and W. Hide, Spectral characterization of human promoters, to appear in Proceedings of the International Systems, Signals, Control, Computers (SSCC’98) Conference, Durban, South Africa, 1998.
The examples presented show without doubt that the concept of padding by zeros of shorter sequences in the ISM (RRM) method for the convenience of calculation of the cross-spectrum of different length sequences produces results that may be misleading. At the same time, the biological interpretation of the zero-padded sequences is destroyed. For this reason, such technology of cross-spectrum determination for genetic sequences cannot be accepted.
[10] V. B. Baji´c and I. B. Baji´c, Spectral methods for analysis of DNA/RNA and protein sequences, Technical Report, Technikon Natal, 1998. [11] G. Strang and T. Nguyen, Wavelets and Þlter banks, Wellesley-Cambridge Press, Wellesley, MA, USA, 1996.
References ´ c, B. Dimitrijevi´c and D. [1] V. Veljkovi´c, I. Cosi´ Lalovi´c, Is It Possible to Analyze DNA and Protein Sequences by the Methods of Digital Signal Processing, IEEE Transactions on Biomedical Engineering, Vol. BME-32, No. 5, pp. 337-341, May 1985.
[12] A. Papoulis, Signal Analysis, McGraw-Hill Book Company, New York, 1977. [13] J. G. Proakis and D. G. Manolakis, Digital Signal Processing: Principles, Algorithms and Applications, Second Ed., Macmillan Publishing Company, New York, 1992
´ c, D. Neši´c, M. Pavlovi´c and R. Williams, [2] I. Cosi´ Enhancer binding proteins predicted by informational spectrum method, Biophys. Biochem. Res. Comm., Vol. 141, pp. 831-839, 1986.
[14] S. J. Orfanidis, Introduction to Signal Processing, Prentice Hall, Upper Saddle River, New Jersey, 1996.
´ c, M. Pavlovi´c and V. Vojisavljevi´c, Pre[3] I. Cosi´ diction of ’hot spots’ in interleukin-2 based on informational spectrum characteristics of growth regulating factors, Biochimie, Vol. 71, pp. 333-342, 1989. ´ c, Macromolecular Bioactivity: Is It Res[4] I. Cosi´ onant Interaction Between Macromolecules ? Theory and Applications, IEEE Transactions on Biomedical Engineering, Vol. 41, No. 12, pp. 1101-1114, December 1994. ´ c, The Resonant Recognition Model of [5] I. Cosi´ Macromolecular Bioactivity - Theory and Applications, Birkhäuser, 1997. [6] V. B. Baji´c, I. V. Baji´c and W. Hide, Application of Resonant Recognition Model to a set of human promoters: A word of warning, to appear in Proceedings of the International Systems, Signals, Control, Computers (SSCC’98) Conference, Durban, South Africa, 1998. [7] V. Veljkovi´c and I. Slavi´c, General models of pseudo-potentials, Phys. Rev. Lett., Vol. 29, pp.105-108, 1972. [8] V. B. Baji´c, I. V. Baji´c and W. Hide, Advantages and drawbacks of spectral analysis of DNA sequences, Plenary Lecture, to appear in Proceedings of The First International Conference on Bioinformatics of Genome Regulation and Structure, (BGRS’98) Novosibirsk, Russia, 1998 6