Proceedings
Soot Particle Classifications in the Context of a Resistive Sensor Study † Adrien Reynaud 1,*, Mickael Leblanc 1, Stéphane Zinola 1, Philippe Breuil 2 and Jean-Paul Viricelle 2 IFP Énergies Nouvelles, Rond-Point de l’échangeur de Solaize, BP 3, 69360 Solaize, France;
[email protected] (M.L.);
[email protected] (S.Z.) 2 Mines Saint-Étienne, Univ Lyon, CNRS, UMR 5307 LGF, Centre SPIN, F-42023 Saint-Etienne, France;
[email protected] (P.B.);
[email protected] (J.-P.V.) * Correspondence:
[email protected]; Tel.: +33-043-770-3120 † Presented at the Eurosensors 2018 Conference, Graz, Austria, 9–12 September 2018. 1
Published: 7 December 2018
Abstract: Since 2011, Euro 5b European standard limits the particle number (PN) emissions in addition to the particulate matter (PM) emissions. New thermal engines equipped vehicles have to auto-diagnose their own Diesel particulate filter (DPF) using on-board diagnostic (OBD) sensors. Accumulative resistive soot sensors seem to be good candidates for PM measurements. The aim of this study is to bring more comprehension about soot micro-structures construction in order to link the response of such a sensor to particle size and PN concentration. The sensor sensitivity to the particle size has been studied using successively an electrostatic and an aerodynamic classification, showing the same trend. Keywords: soot; sensor; electrostatic classification; aerodynamic classification
1. Introduction The nano-sized soot particle emission from thermal engines has a harmful impact over human’s health. Their small size allows them to deeply penetrate through our organism and then release the carcinogenic chemical compounds that they carry [1]. In 2011, Euro 5b standard introduced a restriction concerning PN concentration for Diesel vehicles and it has been extended to gasoline vehicles in 2014 by Euro 6b norms. The on-board diagnostic (OBD) of the Diesel particle filter (DPF) is also mentioned. The resistive soot sensors present several advantages in the OBD context: they are cheap and easy to integrate on the exhaust line. For now, a PM threshold can be detected [2]. The aim of this work is to study if a PN threshold detection could be performed by the resistive soot sensor. The resistive soot sensors measure the conductance of the soot microstructures that link the interdigitated platinum electrodes of the sensor. In the past, several studies have been conducted over a wide range of experimental parameters, such as the polarization voltage and the chemical nature of the soot particles [3], the particle mass flux [2], the sensor nose design [4,5] or the impact of the thermophoresis [6,7]. The aim of this study is to improve our comprehension of the soot capture phenomenon. In order to evaluate the impact of the size of soot particles over the sensor response, two experimental set-up have been used. First, the classification has been performed using a Differential Mobility Analyzer (DMA 3775, TSI, Shoreview, USA). Then, an Aerodynamic Aerosol Classifier (AAC, Cambustion, Cambridge, UK) was used.
Proceedings 2018, 2, 987; doi:10.3390/proceedings2130987
www.mdpi.com/journal/processes
Proceedings 2018, 2, 987
2 of 5
2. Materiel and Methods 2.1. Experimental Set-Up Overview The test bench (cf. Figure 1) is composed of a mini-CAST (Combustion Aerosol STandard, Jing Ltd., Zollikofen, Switzerland) that generates a poly-disperse soot aerosol of concentration C1 = 108 #/cm3 at the temperature T1 = 70 °C (1). The aerosol is diluted 10 times by a clean, dry air in a VKL 10 (Palas GmbH, Karlsruhe, Germany) in order to avoid any condensation and to reach the temperature and concentration compatible with the inlet conditions of the DMA (T2 = 28 °C and C2 = 107 #/cm3) (2). The classification is operated by either the DMA or the AAC (T3 = 28 °C and C3 = 104 #/cm3 to C3=105 #/cm3 depending on the classification technique) (3). Finally, the mono-disperse aerosol is driven to the 12 mm diameter soot sensor chamber, heated by a tubular oven at the temperature of T4 = 180 °C, which leads to a Reynolds number Re = 50 (4). The flow is drained by a Gilair pump at 1.5 L/min, protected by a HEPA filter.
Figure 1. Schematic view of the experimental bench. A CPC 3022A, TSI (Condensation Particle Counter) has been used to measure the distribution size function of the soot aerosol.
2.2. Resistive Soot Sensor In a previous study [3], a resistive soot sensor has been developed. A polarization tension (Vpol = {30; 70; 85; 100} V) applied between two platinum interdigitated electrodes helps to the construction of bridge-like structures, which are responsible of the conductance increase. The construction time of the first bridge linking the electrodes is called percolation time. As well as the electrodes, a heater is printed on the back of the alumina substrate in order to perform active regenerations of the soot to clean the sensor up (700 °C). 2.3. Size Distribution Function The mini-CAST is based on a propane-air diffusion flame quenched by a nitrogen flux. The air, nitrogen and propane flux can be modified to produce aerosol of different size distributions and chemical natures. The criterion for choosing among the operating points was the amount and the size of generated soot particles. Based on the Grondin et al. [3] study, it led to the operating point: QC3H8 = 3.6 L/min, Qair,oxydation = 93 L/min, QN2,mix = 450 L/min, QN2,quench = 9 L/min. The size distribution function were measured by the AAC and the DMA (Figure 2). 2.4. Electric Classification by a DMA (Differential Mobility Analyzer 3775, TSI) Inside the DMA, soot particles are carried between two concentric electrodes by an air flow (sheath flow). The aerosol is then submitted to both the Coulomb force and the drag induced by the sheath flow. By changing the electric field or the sheath flow, the electrical mobility diameter of the outlet mono-disperse aerosol can be modified. After their neutralization by a RX-neutralizer (TSI) it is assumed that the number of charges carried by any particle follows the Boltzmann equilibrium distribution: =
×
−
,
(1)
Proceedings 2018, 2, 987
3 of 5
where N0 is the number of neutral particles, d the mobility diameter of the particles, KB the Boltzmann constant and T the temperature of the particles. Consequently, a low number of particle carries charges. Consequently, according to Equation (1), only a small amount of classified particles are transmitted to the outlet of the DMA i.e., 20% for the mobility diameter of d = 70 nm.
Figure 2. Size distribution functions. (a) Mobility diameter measured by the DMA (for different times after the mini-CAS T start-up); (b) Aero dynamic diameter measured by the AAC.
2.5. Aerodynamic Classification by an AAC (Cambustion) The aerodynamic classification has been performed with the AAC (Cambustion). Because of their injection between two rotating cylinders, soot particles are submitted to both an aerodynamic flow (sheath flow) and their own centrifugal force. Thus, particles are classified according to their aerodynamic diameter da which is the diameter of a sphere with standard density that settles at the same terminal velocity as the particle of interest [8]. Since this method does not classify them according to their charge, a higher amount of particles is transmitted to the mono-disperse aerosol. Moreover, we could suppose that the global charge of the aerosol has an impact over its sensitivity to electrophoresis, leading to different deposit phenomena, probably more realistic than the previous technique. 3. Results and Discussion 3.1. Response to an Electrostatically Classified Soot Aerosol The response of the sensor to the DMA classified aerosol is composed of rare and random conductance steps (Figure 3a), probably due to the soot bridge constructions. The low PN concentration makes those events infrequent, leading to a relatively low reproducibility concerning the percolation time (Figure 3b). Nevertheless, studying several mobility diameters, a correlation had been identified with the percolation time with the exception of the 100 nm points, due to lower PN concentration (roughly half the value of other points because of the Gaussian shaped size distribution). Indeed, both the concentration and the mobility diameter have an impact over the percolation time. It can be seen that the percolation time increases when the particle size decreases.
Proceedings 2018, 2, 987
4 of 5
Figure 3. Electrostatic classification (DMA). (a) Typical soot sensor response to DMA classified aerosols (in this case, a 60 nm aerosol); (b) Overview of the percolation times for different size-concentrations.
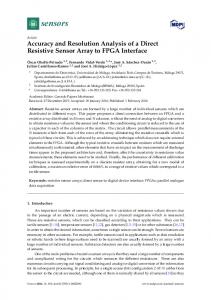
3.2. Response to an Aerodynamically Classified Soot Aerosol As mentioned before, the AAC classified aerosols have a ten times higher PN concentration compared to the DMA classified aerosols (7.4 × 10⁴ #/cm3 vs. 7.2 × 10⁵ #/cm3). This leads to more continuous sensor responses, probably because of the numerous soot bridge construction events occurring at higher PN concentration. Another benefit of this technique is the reproducibility of the results (Figure 4). On Figure 4, it can be seen that the aerodynamic diameter has an impact over the response of the sensor. Indeed, 70 nm mono-disperse aerosols present a lower percolation time and a higher slope than the 50 nm ones. Finally, we can dismiss the impact of the concentration because 70 nm aerosols have a concentration slightly lower than 50 nm aerosols (Figure 2b).
Figure 4. Soot sensor responses for two AAC classified aerosols: 50 nm and 70 nm (two tests for each aerosol).
4. Conclusions This study shows that the resistive soot sensor is sensitive to particle size, even at a low PN concentration (DMA classification). Two techniques have been used with the same objective and the AAC classification showed best results considering the reproducibility of the signal, due to the higher concentration involved. Further studies concerning the impact of the concentration over the signal and the phenomenology of the bridge-like soot structures could bring more information. Acknowledgments: The authors would like to acknowledge the companies Cambustion and Intertek for lending of the Aerodynamic Aerosol Classifier (AAC).
Proceedings 2018, 2, 987
5 of 5
References 1.
2. 3. 4. 5. 6.
7.
8.
Sassi, A.; Rohart, R.; Belot, G. Post-traitement des émissions polluantes des moteurs thermiques à combustion interne. In Moteur à Allumage par Compression; Techniques de l’ingénieur: Paris, France, 2011; Volume 2, pp. 1–24. Brunel, O.; Duault, F.; Lavy, J.; Creff, Y.; Youssef, B. Smart soot sensor for particulate filter OBD. SAE Int. J. Passeng. Cars Electron. Electr. Syst. 2013, 6, 307–327. Grondin, D.; Westermann, A.; Breuil, P.; Viricelle, J.-P. Influence of key parameters on the response of a resistive soot sensor. Sens. Actuators B Chem. 2016, 236, 1036–1043. Ochs, T.; Schittenhelm, H.; Genssle, A.; Kamp, B. Particulate matter sensor for on-board diagnostic (OBD) of Diesel particulate filters (DPF). SAE Int. J. Fuels Lubr. 2010, 3, 61–69. Husted, H.; Roth, G.; Nelson, S.; Hocken, L.; Fulks, G.; Racine, D. Sensing of particulate matter for on-board diagnosis of particulate filters. SAE Int. J. Engines 2010, 5, 235–247. Feulner, M.; Hagen, G.; Muller, A.; Schott, A.; Zollner, C.; Bruggemann, D.; Moos, R. Conductometric sensor for soot mass flow detection in exhausts of internal combustion engines. Sensor 2015, 15, 28796– 28806. Malik, A.; Abdulhamid, H.; Pagels, J.; Rissler, J.; Lindskog, M.; Nilsson, P.; Bjorklund, R.; Jozsa, P.; Visser, J.; Spetz, A.; et al. A potential soot mass determination method from resistivity measurement of thermophoretically deposited soot. Aerosol Sci. Technol. 2011, 45, 284–294. DeCarlo, P.F.; Slowik, J.G.; Worsnop, D.R.; Davidovits, P.; Jiminez, L.J. Particle morphology and density characterization by combined mobility diameter measurements. Part 1. Aerosol Sci. Technol. 2004, 38, 1185–1205. © 2018 by the authors. Licensee MDPI, Basel, Switzerland. This article is an open access article distributed under the terms and conditions of the Creative Commons Attribution (CC BY) license (http://creativecommons.org/licenses/by/4.0/).