Ke Xiao and David G. Grier. Department of .... power of the laser beam powering the trap, and c is the ...... A. M. Branczyk, N. R. Heckenberg, and H. Rubinsztein-.
Sorting colloidal particles into multiple channels with optical forces: Prismatic optical fractionation Ke Xiao and David G. Grier Department of Physics and Center for Soft Matter Research, New York University, New York, NY 10003 (Dated: October 3, 2010) Brownian particles drifting through a periodically structured force landscape can become entrained by the landscape’s symmetries. What direction a particular particle takes can depend strongly on subtle variations in its physical properties. Consequently, a homogeneously structured force field can sort a mixture of particles into spatially separated fractions, much as an optical prism refracts light into its component wavelengths. When the force landscape is implemented with structured light fields, such continuous multi-channel sorting may be termed prismatic optical fractionation. We describe experimental and numerical studies of colloidal spheres’ transport through periodic arrays of optical tweezers, which reveal an important role for three-dimensional motion in determining a drifting particle’s fate. These studies also demonstrate sorting on the basis of statistically locked-in transport, in which Brownian fluctuations contribute to direction selection.
I.
BIASED DIFFUSION IN PERIODIC FORCE FIELDS
The motion of a driven Brownian object in a periodic force field has been studied extensively for half a century [1], not only because of its intrinsic interest, but also because of its close relationship to such disparate physical phenomena as charge transport in Josephson junctions and the kinetics of chemical reactions. Most studies have focused on biased diffusion in one-dimensional systems, the tilted washboard problem providing the archetype for the field. Even this much-studied model continues to yield surprises, with giant enhancement of thermal fluctuations recently having been discovered for particles that are marginally trapped by the washboard [2–7]. Higher-dimensional systems have a substantially richer phenomenology because the driven particle enjoys the additional freedom of selecting its course through the force landscape. The force field itself can have a richer variety of characteristics including multidimensional symmetries [8–16] and solenoidal components that give rise to interesting non-equilibrium effects [17, 18]. Because the particle can move around obstacles, the force landscape can even consist of impenetrable barriers [16, 19]. How a Brownian particle finds its way through such structured terrains remains incompletely understood. One comparatively recent observation is that Brownian particles can be deflected by their interaction with a periodic force field away from the direction of a driving force and into another direction dictated by the landscape’s symmetries [8, 9, 16, 20]. Directional mode locking can take place in the deterministic limit where thermal fluctuations are negligible [9, 11, 16, 21, 22]. In this case, a particle’s interaction with one potential energy well or barrier deflects it into the domain of the next, and so on through the landscape. Thermal fluctuations can modify this process, enabling trajectories to become statistically locked-in to high-order symmetries of the landscape even when they are not microscopically accessible [12, 16]. What direction a particle takes through a particular landscape has been predicted [11, 16, 21] and recently
demonstrated [22, 23] to depend with exquisite sensitivity on the particle’s properties. The most recent of these experimental studies [23] furthermore confirmed the prediction [9, 12] that a homogeneously periodic landscape can deflect different types of objects into several distinct directions simultaneously, with each of the fractions following a specific crystallographic symmetry of the landscape. These experiments were performed using holographic optical traps [24–26] to create landscapes consisting of arrays of discrete optical tweezers [27] through which colloidal particles are driven by flowing fluid. Colloidal sorting in periodic light fields has come to be known as optical fractionation [10, 21], and we recently have suggested that the multi-channel variant should be termed prismatic optical fractionation by analogy with a prism’s ability to disperse different wavelengths of light into different directions. This Article explores prismatic optical fractionation both as an archetypal realization of two-dimensional biased Brownian motion in a periodic force landscape, and also as a practical method to sort colloidal particles that offers unparalleled resolution and previously unavailable sorting modalities. Through a combination of theoretical, simulational and experimental studies, it demonstrates design criteria for optical landscapes that implement specific sorting protocols and reveals ramifications of practical departures from idealized models. Section II specifies the model for transport in two-dimensional force landscapes upon which our theory for prismatic optical fractionation is based. Section II F describes how Brownian trajectories can become kinetically locked-in to symmetry-defined directions through an optical landscape, both in principle and also through simulational studies. These studies emphasize the important role that thermal fluctuations can play, not only in smearing out transitions between deterministically locked-in states, but also in providing access to microscopically inaccessible directions through the process of statistically locked-in transport [12]. Experimental realizations of the predicted transport phenomena, presented in Section III, make use of holographic video microscopy [28–31] to both
2 track and characterize colloidal particles flowing through holographic trapping arrays. These experiments agree in quantitative detail with predictions based on idealized models for transport through two-dimensional periodic force landscapes. Indeed, the agreement is far better than might be expected given the model’s relatively crude approximations.
A.
Transport in a Potential Energy Landscape
A particle driven through such a potential energy landscape by the Stokes drag of a fluid of viscosity η flowing at velocity v experiences a maximum force of F 0 (ap ) = 6πηap v,
II. MOTION IN TWO-DIMENSIONAL POTENTIAL ENERGY LANDSCAPES
Recent experimental studies [32–34] have drawn attention to the nonconservative optical forces that act on particles trapped within optical tweezers [32–35] and to the resulting nonequilibrium effects that they engender [32, 33]. Because such effects generally are quite subtle [32–34], however, an optical trap may be modeled with reasonable accuracy as a (conservative) potential energy well for a colloidal particle. The optical forces experienced by a colloidal sphere moving through a nonuniform light field depend on the particle’s radius ap and refractive index np . Following previous studies [11, 21], we model the j-th optical trap in an array of traps as a three-dimensional Gaussian well, � � r2 V (r|ap , np ) = −V0 (ap , np ) exp − 2 , (1) 2σ (ap ) whose depth [11, 36], V0 (ap , np ) =
nm a3p σ 2 (ap ) c
�
m2 − 1 m2 + 2
� p,
(2)
depends on the strength of a particles’ interaction with the focused light beam, and whose range depends on the particle’s size [21] through σ 2 (ap ) = a2p +
�
0.61λ NA
,
(3)
N 2
W (r|ap , np ) =
in the direction of the flow. If this driving force is smaller than the maximum restoring force that a trap can exert, a particle will become localized in the first trap it encounters. To ensure that the particle moves continuously through the landscape, we therefore require F0 (ap ) >
V0 (ap , np ) √ . σ(ap ) e
(6)
Small particles also are influenced by random thermal forces that tend to help them to escape from traps. Such thermally activated processes can be used to sort microscopic objects, albeit quite slowly. The influence of thermal fluctuations can be minimized by ensuring V0 (ap , np ) > kB T
(7)
at absolute temperature T . This, together with Eq. (6) describes particles moving rapidly through an array of traps, which is the appropriate limit for high-throughput sorting. The particle’s most likely trajectory then can be computed with deterministic equations of motion. Even in this limit, thermal fluctuations can influence a particle’s trajectory, as will be discussed in Sec. II E.
�2
where NA is the numerical aperture of the lens that brings the light to a focus. Here, m = np /nm is the refractive index of the particle, np , relative to that of the medium, nm , for light of vacuum wavelength λ, p is power of the laser beam powering the trap, and c is the speed of light in vacuum. An array of N identical traps centered at positions r j therefore creates a landscape −1 X
(5)
V (r − r j |ap , np ),
(4)
j=− N 2
with a total laser power P = N p whose structure depends not only on the distribution of projected light, but also on the properties of the particle passing through it.
B.
Transport Through a Line of Traps
The driving force may be oriented at angle ∆θν with respect to a symmetry direction x ˆν through the landscape, labeled by index ν. If the particle hugs the landscape and moves along x ˆν rather than following the applied force, it is said to be kinetically locked-in to that direction. For this to happen, the particle must be deflected enough by its interaction with one trap to enter into the potential energy well of the next. In particular, the total force exerted by the traps must be large enough to compensate for the driving force along yˆν , the direction perpendicular to x ˆν . If we assume that the traps are arranged periodically, r j = jbν x ˆν with lattice constant bν , then the transverse force,
3
! � � NX 2 2 −1 yν yν2 V0 (xν − jb) + F0 (ap ) sin ∆θν , exp − 2 exp − Fy = − σ(ap ) σ(ap ) 2σ (ap ) 2σ 2 (ap ) N j=−
(8)
2
must vanish for the particle to remain kinetically locked-in at deflection angle ∆θν . The maximum deflection angle therefore satisfies ! � � NX 2 2 −1 V0 (ap , np ) yν yν2 (xν − jbν ) sin ∆θν ≤ exp − 2 (9) exp − σ(ap )F0 (ap ) σ(ap ) 2σ (ap ) 2σ 2 (ap ) N j=−
This is an underestimate for the maximum deflection angle because it does not include contributions from more distant traps. For an infinite array, r V0 (ap , np ) 2π < sin ∆θν ∼ × bν F0 (ap ) e � �� � 2π 2 σ 2 (ap ) π ϑ3 − , exp − , (11) 2 b2ν where ϑ3 (. . . ) is an elliptic theta function, always exceeds the prediction of Eq. (10). Furthermore, yν = σ may not be kinematically accessible at the midline between the traps because no periodic trajectory reaches there. In that case, particles would remain kinetically locked-in to the x ˆν direction at steeper angles without falling through the ‘holes’ between the traps. On the other hand, the derivation of Eq. (10) does not account for thermal fluctuations [11, 13–16] or randomness in the position and depth of the traps [37], both of which help particles to break free of locked-in trajectories. Stably locked-in transport therefore might be limited to angles smaller than predicted by Eq. (10). C.
Two-Dimensional Kinetic Lock-in
Although Eq. (10) was derived for transport along onedimensional arrays of traps, it provides useful insights also into transport through two-dimensional arrays. A given lattice of traps possesses symmetry directions described by Miller indexes ν = [ij]. These directions are
1.0 [11]
0.8
[43] [32]
0.6
tan θ
along the entire trajectory r(t) = (xν (t), yν (t)) observed in the (ˆ xν , yˆν ) frame. The deflection angle is limited by the maximum transverse force that the landscape can apply, which occurs at yν = σ(ap ). Particles must remained locked-in, furthermore, along the entire length of the array, including the midpoints between the traps which are its weakest points. If we assume that the transverse force is dominated by the two nearest traps, we recover the result originally reported in Ref. [21], � � V0 (ap , np ) 2 b2 √ exp − 2 ν sin ∆θν ≤ . (10) σ(ap )F0 (ap ) e 8σ (ap )
2
[21]
0.4
[31] [41]
0.2 [10]
0
0.2
0.4
0.6
0.8
1.0
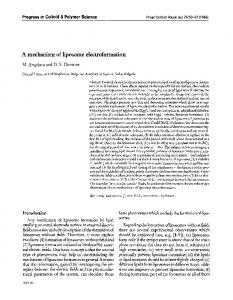
a p/b FIG. 1: (Color) Locked-in directions as a function of particle size for a sphere of fixed refractive index np moving under a constant force F 0 (ap , np ) at angle θ through a square array of traps. Shaded regions indicate predictions of Eq. (11) for the conditions under which a sphere of radius ap becomes kinetically locked-in to particular lattice directions indicated by their Miller indices. Overlapping regions indicate opportunities for statistically locked-in transport, with higher-index directions becoming accessible as random sequences of lowerindex jumps. Unshaded regions indicate conditions under which the particle freely follows the direction of the driving force. The horizontal dashed line indicates the different fates of particles with different sizes moving through a square lattice at fixed orientation tan θ = 0.41. The vertical dashed line indicates the lock-in transitions that a particle of radius ap = 0.4b will experience as the driving direction is rotated from θ = 0◦ to θ = 45◦ .
oriented at angles θν with respect to the array’s principal [10] lattice direction. The driving force F 0 is oriented at angle θ with respect to the [10] axis. The particle’s trajectory then passes through the array at an angle that we label φ. The challenge in describing colloidal transport through two-dimensional arrays is to determine how φ depends on the properties of the particle and the array for a given driving direction θ. A particle should become locked-in to direction ν if the driving force is oriented within ∆θν of θν . The maximum deflection angle, ∆θν , depends on the array’s geom-
4 etry through the inter-trap separation, bν . For example, a square p array with lattice constant b has separations bν = b i2 + j 2 . The range of locked-in angles around a given direction θν therefore falls off rapidly with increasing index ν. Figure 1 depicts this transport characteristic for a few illustrative directions through a square array as a function of particle size for a fixed refractive index and laser power.
D.
Lock-in Transitions
A particle driven at an angle θ that falls into one of the unshaded regions in Fig. 1 is not locked in to any direction according to Eq. (10). Consequently, it is not systematically deflected by the array and travels along the driving direction with φ = θ. If, on the other hand, the particle falls into the lockedin domain around symmetry direction θν , its trajectory is deflected away from the driving direction θ and the particle travels instead along φ = θν . The vertical dashed line in Fig. 1 therefore maps out the fate of a given size and composition of particle as a function of driving direction. For a given driving direction, the particle either is locked-in to nearest symmetry of the lattice or else escapes from the lattice and travels in the direction of the driving force.
E.
Statistically Locked-in Transport
The situation is different for larger particles that interact more strongly with the lattice. In this case, the locked-in domains predicted by Eq. (11) can overlap. The higher-index directions in such overlapping regions are not microscopically accessible because particles will encounter and interact preferentially with traps along lower-index directions. Under these conditions, the particle may principally follow one direction with occasional excursions in another. The net result is a mean travel direction φ that reflects the influence of all overlapping symmetry directions. What direction the particle travels depends on the relative probability for jumps in microscopically accessible directions [12] which may require a full two-dimensional treatment to determine. The overlap in the one-dimensional results still has predictive power in that it signals a cross-over from deterministically locked-in transport along the low-index direction to statistically locked-in transport along another direction. This becomes still more complicated when locked-in domains for multiple lattice directions overlap. The resulting competition between candidate locked-in directions at least qualitatively explains the fairly complicated pattern of locked-in plateaus that have been reported experimentally for colloidal transport through square arrays of traps [9, 12].
F.
Prismatic Optical Fractionation
Although the angles θν are defined solely by the geometry of the array, the ranges ∆θν depend also on the size and refractive index of the particle. For a given driving orientation θ, therefore, different objects may travel in different directions φ(ap , np ) through the array. This effect may be used to sort objects into spatially separated fractions on the basis of their physical properties [9, 10, 21], a process known as optical fractionation. Previous realizations of optical fractionation have sorted samples into two fractions [10, 21] usually distinguished by whether or not particles were locked in to a particular direction. Sorting into more fractions or more refined fractions then relied on passing samples through multiple gradated stages of optical force fields [47]. The possibility that different objects might become kinetically locked-in to different directions in a uniform, static landscape has been proposed [9, 11, 12] as a means to implement multi-channel optical fractionation. How this might be accomplished in practice was not specified. The horizontal dashed line in Fig. 1 indicates one strategy for sorting into multiple fractions by size with a single pass through a uniform array of optical traps. Particles too small to be locked in to any lattice direction travel through the array undeflected, with φ = θ. Other somewhat larger particles satisfy θ ≤ ∆θ[10] and become kinetically locked in to φ = 0◦ . Still larger particles become statistically locked in to φ = θ[21] and are deflected in the opposite direction to φ = 27◦ . The sample thus is divided by size into three distinct fractions whose physical separation scales linearly with the size of the optical trapping array. The size ranges in each fraction can be tuned through the driving angle and the array’s lattice constant. Such simultaneous sorting into multiple distinct channels distinguishes prismatic optical fractionation from other modes of operation. Optical fractionation of spheres sorts on the basis of (complex) refractive index as well as size. Equation (10) may be recast to differentiate those particles that can become locked in to a particular direction at a specific driving angle from those that cannot: s A(ap ) + 2Bν (θ) nν (ap ) = nm , where (12) A(ap ) − Bν (θ)
A(ap ) =
� � � a �2 � b �3 b2 p exp − 2 b σp 8σp
(13)
depends on particle size through the ratio ap /b, and √ e 6πη v c b sin (θ − θν ) . (14) Bν (θ) = 2 nm P Particles satisfying np ≥ nν (ap ) can become locked-in to the lattice direction at angle θν , and those with np < nν (ap ) should escape.
(a)
(b)
laser illumination
input
a b
input
output
[01] [11] [10]
side
apex
sample objective lens SLM relay
(c) dichroic mirror holographic imaging
holographic trapping
side
5
flow direction
5 µm
FIG. 2: (Color) (a) Schematic representation of the combined holographic optical trapping (HOT) and holographic video microscopy (HVM) instrument. The hologram encoding the optical tweezer array is imprinted onto a laser beam with a spatial light modulator (SLM) and relayed to the objected lens with a dichroic mirror. A second collimated laser beam illuminates the sample, and the resulting in-line holograms are collected by the same objective lens, magnified, and relayed to a video camera. (b) Image of an array of optical tweezers in the microscope’s focal plane obtained by replacing the sample with a front-surface mirror. The four superimposed traces are the measured trajectories of two particles (squares) that were locked in to the array’s [10] direction and another two (circles) that were locked in to [11]. Dashed boxes indicate the region from which particles flow into the array (input) and the two detection regions downstream of the array (apex and sides). (c) Typical holographic snapshot of the same field of view showing colloidal spheres interacting with the array of traps. Scale bar indicates 5 µm. Inset: Fit of the indicated image to Lorenz-Mie predictions.
In considering these results for practical applications, some account should be taken of the underlying approximations. Even if the more comprehensive Eq. (11) is substituted for Eq. (10), the forms for V0 (ap , np ) and σ(ap ) in Eqs. (2) and (3) are fairly crude, particularly for particles comparable in size to the wavelength of light or larger.
2000). This sample is mounted on the stage of an inverted optical microscope (Nikon TE2000U) outfitted with a 100× oil-immersion objective (Nikon Plan Apo, NA = 1.4). This objective lens is used to project arrays of optical tweezers [27] into the midplane of the sample using the holographic optical trapping technique [24–26, 38]. Figure 2(b) shows the measured intensity of a typical optical trap array recorded in the microscope’s focal plane, each discrete optical tweezer appearing as a point of light. This optical trap array is powered by a frequencydoubled solid state laser (Coherent Verdi 5W) operating at a vacuum wavelength of λ = 532 nm whose beam is imprinted with computer-generated holograms [26] using a liquid crystal spatial light modulator (SLM) (Hamamatsu X8267-16). The hologram then is relayed to the objective lens’ input pupil with a dichroic mirror. The sample also is illuminated with the collimated beam from a HeNe laser (Uniphase 1103P) operating at a vacuum wavelength of 632.8 nm. Light scattered by the colloidal spheres interferes with the unscattered portion of the beam in the focal plane of the objective lens. The interference pattern is imaged by the objective lens and a video eyepiece onto a video camera (NEC TI-324IIA) that records its intensity at 30 frames/s. This system has an effective magnification of 0.091 µm/pixel. Figure 2(c) shows a typical holographic snapshot of colloidal spheres interacting with the optical trap array in the same field of view as Fig. 2(b). We fit each sphere’s holographic image to predictions of the Lorenz-Mie theory of light scattering [39–41] using the MPFIT implementation [42] of the LevenbergMarquardt nonlinear least-squares fitting algorithm. Each fit yields a sphere’s three-dimensional position with nanometer resolution and also its radius with nanometer resolution and its complex refractive index to within one part in a thousand [29, 31]. A typical fit is shown in the inset to Fig. 2(c). This approach to holographic video microscopy therefore provides the time-resolved tracking and characterization data required to assess the efficacy of arrays of optical tweezers to sort fluid-borne particles through kinetically and statistically locked-in transport.
A. III.
EXPERIMENTAL RESULTS
Despite its shortcomings, the theory outlined above performs remarkably well in describing and predicting the outcome of experimental studies. Our experimental implementation is shown schematically in Fig. 2. Colloidal spheres dispersed in deionized water flow through a 2 cm long microfluidic channel with a 1 mm × 30 µm rectangular cross-section. The channel is cast in poly(dimethyl siloxane) (PDMS) and bonded to a no. 1.5 glass cover slip and the constant flow is maintained with a syringe pump (Harvard Apparatus PHD
Mixed Silica Colloidal Particles
The data in Fig. 3(a) show results obtained with a mixture of two populations of monodisperse colloidal silica spheres, one 1.0 µm in diameter (Duke Scientific Catalog #8100, Lot #21024) and the other 1.5 µm in diameter (Duke Scientific Catalog #8150, Lot #30158) at 1:1 stoichiometry. This mixed dispersion was flowed at v = 24 ± 8µm/s, through an optical trap array of the type shown in Fig. 2(b) with inter-trap separation of b = 2.025 µm along the [10] direction and a = 3.27 µm along the [01] direction. The [10] direction is inclined at θ = 30◦ with respect to the flow. The laser power per trap is estimated to be P = 2.0 ± 0.3 mW/trap
6
(a)
1.48
1
input
sides
apex
ρ (a p, n p)
1.46 1.44
np 1.42
nc(a p)
1.40 1.38
(b)
0 0.5
0.6
0.7
0.8
0.5
0.6
0.7
0.8
0.5
0.6
0.7
0.8
1.430
1
input
sides
apex
1.420
np 1.415
nc(a p )
1.410 1.405
(c)
ρ (a p, n p)
1.425
0 0.68 0.70
0.72 0.74
0.68 0.70
0.72 0.74
0.68 0.70
0.72 0.74
1.65
1
input
sides
apex
ρ (a p, n p)
1.62 1.59
np 1.56 1.53 1.50
nc(a p) 0.46 0.48
0.50 0.52
a p [µ m]
0.46 0.48
0.50 0.52
a p [µ m]
0.46 0.48
0
0.50 0.52
a p [µ m]
FIG. 3: (Color) Experimental tests of prismatic optical fractionation. (a) Bisdisperse silica sample: (left) input distribution, (center) fraction deflected to the sides along the [11] directions, (right) fraction deflected to the apex along the [10] directions. (b) Monodisperse silica sample. Symbols plotted in the center and right panels indicate the particles whose trajectories are plotted in Fig. 2(b). (c) Monodisperse polystyrene sample. Dashed curves are predictions of Eq. (12) for kinetic lock-in along [10].
based on imaging photometry of images such as the one in Fig. 2(b). The dense silica spheres tend to settle to the lower wall of the channel, as confirmed by three-dimensional holographic particle tracking. They thus approach the trap array more slowly than the peak flow rate along the channel’s midplane because of the Poiseuille flow profile. Once they encounter the traps, however, they are drawn to the midplane by optical forces, and move through the array in the peak flow. This focusing of the colloidal flow by optical forces was overlooked in previous studies [9, 10, 21, 22] and helps to explain why an idealized two dimensional analysis might be successful at explaining transport through a complex highly structured threedimensional optical field.
Under these conditions, Eq. (12) predicts that the larger spheres will be locked-in to the [10] direction while the smaller spheres will be statistically locked-in to [21].The dividing line based on this prediction is plotted as a dashed curve in the np (ap ) plane in Fig. 3(a) and passes cleanly between the two populations. A random sample of 2500 particles passing through the input region (indicated in Fig. 2(b)) was characterized by Lorenz-Mie scattering theory. These particles radii, ap , and refractive indexes, np , were compiled with a nonparametric density estimator [43] into the relative probability distribution ρ(ap , np ) plotted in Fig. 3(a). This clearly resolves the two populations of silica spheres, the larger of which is slightly less dense than the smaller. The marked anticorrelation between size and refractive index
7 in the individual monodisperse populations appears to be a normal feature of particles synthesized by emulsion polymerization [29, 31] and is not seen in samples of known uniform density such as fluid droplets [30]. This input distribution passed through the array of optical tweezers an into the two analysis regions indicated in Fig. 2(b), one at the apex at the array and the other comprised of the two side regions. These two output distributions, plotted in Fig. 3(a) show that the large particles are preferentially deflected to the apex of the array whereas the smaller particles are preferentially deflected to the sides. A small proportion of the large spheres did not become locked-in to the [10] direction or otherwise leaked through the array and so appear in the side distribution. Similarly small particles that entered the array near its midline were not deflected and passed through to the apex. A larger proportion of small spheres thus contaminates the distribution analyzed at the apex. Even so, the two populations were sorted with better than 90% efficiency in the side distribution and better than 80% efficiency at the apex. Previous studies [10, 21, 44] have demonstrated optical fractionation of bidisperse colloidal mixtures with such easily distinguishable characteristics. Theoretical studies [11, 13–16, 21] suggest that optical fractionation can have exquisitely fine resolution for sorting by size, and perhaps by refractive index. Although these predictions have been tested indirectly through transport studies on monodisperse samples [22], Lorenz-Mie characterization [29, 31] has fine enough resolution for particle size and refractive index to enable direct tests.
B.
Monodisperse Silica Colloidal Particles
Figure 3(b) shows comparable results in the same optical tweezer array for a monodisperse sample of colloidal silica spheres with a nominal radius of 0.75 ± 0.04 µm (PolySciences Catalog #24327, Lot #600424). LorenzMie characterization reveals the actual sample-averaged radius to be somewhat smaller and more sharply distributed than the manufacturer’s specification, with ap = 0.715 ± 0.021 µm. The measured refractive index of np = 1.418 ± 0.004 also is significantly lower than the nominal range for 1.43 to 1.46 for colloidal silica spheres, suggesting that these spheres are somewhat porous. This sample was flowed with a slightly lower speed, v = 22 ± 5 µm/s, than in the previous example so that the predicted condition for locked-in transport along [10] cuts through the middle of the sample’s range of properties. The results in Fig. 3(b) show that smaller particles with lower refractive index are systematically deflected into the side areas, their mean deflection indicating statistically locked-in transport along [21]. The larger higher-index particles, by contrast, are kinetically locked-in along [10] and are deflected to the apex of the array. These distributions were obtained with 6,000 randomly selected particles. The discrete points plotted in
the center and right panels of Fig. 3(b) indicate the properties of the four particles whose trajectories are plotted in Fig. 2(b). Although the mean radius of the particles deflected to the apex is only slightly greater than that of the other fraction (0.716 ± 0.021 µm versus 0.710 ± 0.027 µm), the difference is found to be statistically significant at the 99.9 percent level with a Wilcoxon rank-sum test. A far more substantial distinction is observed in the refractive indexes of the sorted populations. The spheres at the apex have a mean refractive index of 1.420 ± 0.003 whereas the side fraction has a mean refractive index of 1.416 ± 0.003. These two populations again differ with better than 99.9 percent confidence according to the Wilcoxon rank-sum test. Not only do these results agree quantitatively with the predictions of Eq. (12) for kinetic lock-in along the [10] direction, they also agree with the heuristic model of Sec. II E for the onset of statistical lock-in. The initially monodisperse sample is thereby divided into two spatially separated fractions with resolution for refractive index approaching the part-per-thousand resolution of LorenzMie characterization. To the best of our knowledge this is the finest resolution for fractionation by refractive index reported for any technique. It is achieved, moreover, despite the inevitable imperfections in the optical trap array and fluctuations in the fluid velocity. As in the previous example, the efficiency for sorting exceeds 95% in both samples. C.
Monodisperse Polystyrene Colloidal Particles
The data in Fig. 3(c) were obtained under comparable conditions with a monodisperse samples of polystyrene spheres with a nominal radius of 0.50 ± 0.02 µm (Duke Scientific Catalog #5100A, Lot #27527) and a nominal refractive index of 1.59 at 589 nm. Unlike silica spheres, polystyrene spheres are only 5% more dense than water. Consequently, they fill the channel as the flow toward the array of traps. Their comparatively high refractive index, moreover, renders them more susceptible to radiation pressure and thus less strongly trapped by optical tweezers [45, 46, 48, 49]. Rather than being drawn by optical forces toward the cell’s midplane, consequently, these spheres predominantly are pushed toward the upper glass wall and creep along the surface in the slowest part of the Poiseuille flow. To compensate for the observed axial displacement, we refocus the optical trap array so that the particles continue to pass through in the plane of best focus. We furthermore modify Eq. (5) to account for the spheres’ hydrodynamic coupling to the wall at distance h from their centers: ( )!−1 a3p 9ap F0 (h) = 6πη ap 1 − +O v. (15) 16h h3 At a measured height of h = (1.2 ± 0.1) ap , the particles move down the channel at v = 7.7 ± 2.5µm/s.
8
The data in Fig. 3(c) were amassed from the trajectories of 2,000 randomly chosen particles. Despite complications arising from the less easily trapped sample, the prediction of Eq. (12) still quantitatively agrees with the measured distributions in the two output fractions, the nominally monodisperse sample being separated into even more finely resolved fractions along the curve nc (ap ). The mean radius of the particles in the apex region, 0.497±0.017 µm, is substantially larger than in side regions, 0.478 ± 0.014 µm, demonstrating sorting by radius with a resolution finer than 20 nm. The difference in size between the two fractions is found to be statistically significant at the 99.9 percent level with a Wilcoxon rank-sum test. Although the two fractions also differ slightly in mean refractive index (1.576 ± 0.016 versus 1.589 ± 0.019), this difference is only significant at the 95% confidence level. The polystyrene particles thus indeed are sorted mainly by their sizes.
IV.
SIMULATION RESULTS
The Langevin equation of motion for a colloidal sphere moving in flowing fluid through an optical trap array is
ξ
dr(t) = −∇ W (r) + F 0 + Γ(t), dt
(16)
where ξ is the sphere’s viscous drag coefficient, and where Γ(t) describes random thermal fluctuations. The stochastic force satisfies hΓ(t)i = 0 and hΓ(t) · Γ(t + τ )i = 2 ξ kB T δ(τ ) at temperature T , where δ(τ ) is the Dirac delta function. We integrated this equation of motion with the stochastic fourth-order RungeKutta algorithm [50–52] to obtain simulated trajectories, r(t), that are analogous to the experimental data presented in the previous Section. Particles with sizes and refractive indexes drawn at random from a desired distribution were released at random into the force and flow fields described by Eqs. (4) and (5) respectively, and their in-plane motions compiled into distributions comparable to those obtained experimentally.
(a)
(b)
input
1.430 1.425 1.420
np 1.415 flow
1.410
direction 1.430
(c)
sides
(d)
apex
1.405 1
1.425
ρ (a p, n p)
Given these considerations, a trap array resembling that in the previous examples was created with lattice parameters b = 2.5 µm and a = 2.72 µm and powered with a laser power of P = 2.2 ± 0.2 mW/trap. The resulting threshold for kinetic lock-in to the [10] direction is plotted in Fig. 3(c). This array was designed so that the fastest of the most strongly interacting particles would remain kinetically locked-in. Unlike the previous demonstration of sorting of silica spheres, this array was designed to emphasize sorting by size. The slope of nc (ap ) can be adjusted with the accessible control parameters to achieve a desired balance between sorting by size and refractive index.
1.420
np 1.415 1.410
nc(a p)
1.405
0 0.68 0.70 0.72 0.74
0.68 0.70 0.72 0.74
a p[µ m]
a p[µ m]
FIG. 4: (Color) Simulation of the experimental conditions in Fig. 3(b). (a) Computed probability density of particles flowing from left to right through the array. (b) Distribution of refractive indexes and radii of the spheres in the input region, chosen to mimic the experimentally observed sample. (c) Output distribution in the side regions. (d) Output distribution in the apex region.
A.
Comparison with Experimental Results
The data in Fig. 4 show results of such simulation designed to mimic the experimental conditions in Fig. 3(b). Particle properties, ap and np were selected at random from a elliptical Gaussian distribution fit to the measured input distribution in Fig. 3(a). Each particle then was released at a random position within the input region indicated in Fig. 2(b) and its subsequent trajectory recorded. Figure 4(a) shows the probability distribution of particle positions for 5,000 such simulated trajectories. The specific distribution of input properties is plotted in Fig. 4(b) to permit direct comparison with the experimental size and refractive index distribution obtained with holographic video microscopy in Fig. 3(b). The dashed curve in this figure is the predicted lock-in condition for the [10] direction through the simulated array of traps, using the experimentally determined parameters. Figures 4(c) and (d) show the simulated output distributions in the apex and side collection areas indicated in Fig. 2(b). As for the experimental results in Fig. 3(b), the simulated trajectories yield well-sorted output fractions with the larger, more strongly interacting particles being preferentially deflected to the apex of the trapping array and the smaller more weakly interacting fraction either passing through the array or else being deflected to the side regions. As in the experimental case, the division between output fractions falls closely along the curve predicted by Eqs. (12) through (14). These observations lend support to our suggestion that the idealized one-dimensional model developed in Sec. II
9 (a)
[10]
(b)
111111 000000
flow direction
1.48
[31]
1.46
np
[21]
[10]
1.44 [21]
[31] [21]
1.42 [31]
1.40 unlocked
[10]
1.38 0.4
0.5
0.6
0.7
a p [µ m]
0.8
0.9
FIG. 5: (Color) Prismatic optical fractionation. (a) Computed probability density of particles colored by locked-in direction of trajectory through the optical trap array. The output was divided into four categories: [10], [21], [31] and undeflected. Individual traps appear as local probability maxima. (b) Map of particle properties ap and np colored by mean transport direction through the array. Red: [10], Green: [21], Cyan: [31], Blue: undeflected.
quantitatively predicts the trajectories of particles moving through two-dimensional arrays of traps, including capturing the transition to statistically locked-in transport. They also suggest that the experimental results in Sec. III were correctly interpreted within this model. Similarly good agreement between experiment, simulation and theory are obtained for the other experimental realizations as well.
B.
Optimized Prismatic Fractionation
Although prismatic optical fractionation in inclined arrays of optical tweezers is demonstrably effective in sorting colloidal spheres by size and by refractive index, the mode of operation that we have demonstrated is not the most effective. In particular, the selected fraction at the apex is mixed with a small population of particles that were not deflected at all. This defect is obvious in the results presented in Fig. 3. This can be overcome at the cost of slight additional complexity, as we now demonstrate with Brownian dynamics simulations. The problem of spheres leaking through the array can be mitigated by reversing the flow direction and confining the incoming stream of particles to a comparatively narrow stream within the bulk flow, as shown in Fig. 5(a). In practice, particles can be confined in this way with hydrodynamic flow focusing [53] in a microfluidic chip. Figure 5(a) shows the probability density for finding a particle at a given position in the plane. Individual traps in the array are visible as local probability maxima. Regions are colored according to the mean direction of the trajectories passing through. Trajectories kinetically locked-in to the [10] direction are colored red. Statistically locked-in trajectories in the [21] and [31] directions are colored green and cyan, respectively. Undeflected trajectories are colored blue. Output bins are defined as
indicated in Fig. 5(a) for each of these four categories. Particles in these simulations were selected with the broad range of radii and refractive indexes indicated in Fig. 5(b). Each point in this map is colored by the mean transport direction taken by particles with those properties, using the same color-coding scheme as in Fig. 5(a). The space is clearly divided into bands of color, with the largest, most strongly interacting particles being lockedin to the [10] direction and the smallest, least strongly interacting particles passing through the array undeflected. The dashed curves in Fig. 5(b) indicate the predictions of Eq. (12) for kinetically locked-in transport along [10], and statistically locked-in transport along [21] and [31]. These dashed curves agree reasonably well with the observed fates of the particles. The success of Eq. (12) at predicting the transitions to and between statistically locked-in states is quite remarkable considering its derivation from a semi-quantitative one-dimensional model. This simulation also demonstrates the possibility and potential utility of prismatic optical fractionation to sort heterogeneous samples into multiple spatially separated fractions simultaneously and continuously.
V.
SUMMARY AND DISCUSSION
We have demonstrated that a homogeneous periodic force landscape can be used to sort microscopic spheres into spatially separate fractions with extremely fine resolution for size or refractive index. Although the basis for designing such multidimensional separations, Eq. (12), was obtained using limiting arguments for a one-dimensional array, it has proved quantitatively accurate for predicting the transport of colloidal spheres through two-dimensional arrays of traps both in simulation and also experimentally. This success is observed not only for kinetically locked-in transport along microscopically accessible sites, but also for statistically locked-in transport along directions that are not microscopically accessible. We have experimentally demonstrated the use of prismatic optical fractionation to select two fractions from a heterogeneous sample and to deflect them in opposite directions. Our simulations of the inverted geometry suggest that fractionation into multiple physically distinct samples also should be feasible. Such multi-channel multidimensional sorting takes advantage of both kinetically and statistically locked-in transport mechanisms. The present work focuses on sorting of colloidal spheres that are well enough separated to avoid inter-particle interactions. Pairwise collisions tend to blur the transitions among locked-in states [9] and might be expected to diminish the effectiveness of prismatic optical fractionation. Many-body cooperativity, however, might open new avenues for sorting. Recent studies [54] have begun to extend the study of locked-in transport to aspherical objects. These also suggest avenues for continuous sorting, including so-far untapped channels for prismatic
10 optical fractionation. This work was supported by the National Science
Foundation under Grant Number DMR-0855741.
[1] H. Risken, The Fokker-Planck Equation, Springer series in synergetics (Springer-Verlag, Berlin, 1989), 2nd ed. [2] G. Constantini and F. Marchesoni, Europhys. Lett. 48, 491 (1999). [3] P. Reimann, C. Van den Broeck, H. Linke, P. H¨ anggi, J. M. Rubi, and A. P´erez-Madrid, Phys. Rev. Lett. 87, 010602 (2001). [4] P. Reimann, C. Van den Broeck, H. Linke, P. H¨ anggi, J. M. Rubi, and A. P´erez-Madrid, Phys. Rev. E 65, 031104 (2002). [5] S.-H. Lee and D. G. Grier, Phys. Rev. Lett. 96, 190601 (2006). [6] P. Reimann and R. Eichhorn, Phys. Rev. Lett. 101, 180601 (2008). [7] M. Evstigneev, O. Zvyagolskaya, S. Bleil, R. Eichhorn, C. Bechinger, and P. Reimann, Phys. Rev. E 77, 041107 (2008). [8] C. Reichhardt and F. Nori, Phys. Rev. Lett. 82, 414 (1999). [9] P. T. Korda, M. B. Taylor, and D. G. Grier, Phys. Rev. Lett. 89, 128301 (2002). [10] M. P. MacDonald, G. C. Spalding, and K. Dholakia, Nature 426, 421 (2003). [11] M. Pelton, K. Ladavac, and D. G. Grier, Phys. Rev. E 70, 031108 (2004). [12] A. Gopinathan and D. G. Grier, Phys. Rev. Lett. 92, 130602 (2004). [13] A. M. Lacasta, J. M. Sancho, A. H. Romero, and K. Lindenberg, Phys. Rev. Lett. 94, 160601 (2005). [14] J. P. Gleeson, J. M. Sancho, A. M. Lacasta, and K. Lindenberg, Phys. Rev. E 73, 041102 (2006). [15] A. M. Lacasta, M. Khoury, J. M. Sancho, and K. Lindenberg, Mod. Phys. Lett. B 20, 1427 (2006). [16] J. Herrmann, M. Karweit, and G. Drazer, Phys. Rev. E 79, 061404 (2009). [17] S. Albaladejo, M. I. Marqu´es, F. Scheffold, and J. J. S´ aenz, Nano Lett. 9, 3527 (2009). [18] I. Zapata, S. Albaladejo, J. M. R. Parrondo, J. J. S´ aenz, and F. Sols, Phys. Rev. Lett. 103, 130601 (2009). [19] C. F. Chou, R. H. Austin, O. Bakajin, J. O. Tegenfeldt, J. A. Castelino, S. S. Chan, E. C. Cox, H. Craighead, N. Darnton, T. Duke, et al., Electrophoresis 21, 81 (2000). [20] J. Wiersig and K.-H. Ahn, Phys. Rev. Lett. 87, 026803 (2001). [21] K. Ladavac, K. Kasza, and D. G. Grier, Phys. Rev. E 70, 010901(R) (2004). [22] Y. Roichman, V. Wong, and D. G. Grier, Phys. Rev. E 75, 011407 (2007). [23] K. Xiao and D. G. Grier, Phys. Rev. Lett. 104, 028302 (2010). [24] E. R. Dufresne and D. G. Grier, Rev. Sci. Instrum. 69, 1974 (1998). [25] D. G. Grier, Nature 424, 810 (2003). [26] M. Polin, K. Ladavac, S.-H. Lee, Y. Roichman, and D. G. Grier, Opt. Express 13, 5831 (2005). [27] A. Ashkin, J. M. Dziedzic, J. E. Bjorkholm, and S. Chu,
Opt. Lett. 11, 288 (1986). [28] S.-H. Lee and D. G. Grier, Opt. Express 15, 1505 (2007). [29] S.-H. Lee, Y. Roichman, G.-R. Yi, S.-H. Kim, S.-M. Yang, A. van Blaaderen, P. van Oostrum, and D. G. Grier, Opt. Express 15, 18275 (2007). [30] F. C. Cheong, K. Xiao, and D. G. Grier, J. Dairy Sci. 92, 95 (2009). [31] F. C. Cheong, B. Sun, R. Dreyfus, Amato-Grill, K. Xiao, L. Dixon, and D. G. Grier, Opt. Express 17, 13071 (2009). [32] Y. Roichman, B. Sun, A. Stolarski, and D. G. Grier, Phys. Rev. Lett. 101, 128301 (2008), condmat/0804.0730. [33] B. Sun, J. Lin, E. Darby, A. Y. Grosberg, and D. G. Grier, Phys. Rev. E 80, 010401(R) (2009). [34] P. Y. Wu, R. X. Huang, C. Tischer, A. Jonas, and E. L. Florin, Phys. Rev. Lett. 103, 108101 (2009). [35] A. Ashkin, Biophys. J. 61, 569 (1992). [36] Y. Harada and T. Asakura, Opt. Commun. 124, 529 (1996). [37] P. T. Korda, Ph.D. thesis, The University of Chicago (2002). [38] Y. Roichman, A. S. Waldron, E. Gardel, and D. G. Grier, Appl. Opt. 45, 3425 (2006). [39] C. F. Bohren and D. R. Huffman, Absorption and Scattering of Light by Small Particles (Wiley Interscience, New York, 1983). [40] W. J. Lentz, Appl. Opt. 15, 668 (1976). [41] W. J. Wiscombe, Appl. Opt. 19, 1505 (1980). [42] C. B. Markwardt, in Astronomical Data Analysis Software and Systems XVIII, edited by D. Bohlender, P. Dowler, and D. Durand (Astronomical Society of the Pacific, San Francisco, 2009). [43] B. W. Silverman, Density Estimation for Statistics and Data Analysis (Chapman & Hall, New York, 1992). [44] L. Smith, Ryan, G. C. Spalding, K. Dholakia, and M. P. MacDonald, J. Opt. A 9, S134 (2007). [45] T. A. Nieminen, V. L. Y. Loke, A. B. Stilgoe, G. Knoner, A. M. Branczyk, N. R. Heckenberg, and H. RubinszteinDunlop, J. Opt. A 9, S196 (2007). [46] B. Sun, Y. Roichman, and D. G. Grier, Opt. Express 16, 15765 (2008). [47] G. Milne, D. Rhodes, M. MacDonald, and K. Dholakia, Opt. Lett. 32, 1144 (2007). [48] A. B. Stilgoe, T. A. Nieminen, G. Kn¨ oener, N. R. Heckenberg, and H. Rubinsztein-Dunlop, Opt. Express 16, 15039 (2008). [49] B. Sun and D. G. Grier, Opt. Express 17, 2658 (2009). [50] R. L. Honeycutt, Phys. Rev. A 45, 600 (1992). [51] J. Wilkie, Phys. Rev. E 70, 017701 (2004). [52] W. Rumelin, SIAM J. Numer. Anal. 19, 605 (1982). [53] J. B. Knight, A. Vishwanath, J. P. Brody, and R. H. Austin, Phys. Rev. Lett. 80, 3863 (1998). [54] J. Bammert and W. Zimmermann, Euro. Phys. J. E 28, 331 (2009).