drop, we argue for the value of a more fine-grained, analytical approach that ta- kes us closer to the operational and practical workings of big data. In particular,.
Sorting data out – unpacking big data value chains and algorithmic knowledge production M IKKEL F LYVERBOM & A NDERS K OED M ADSEN
We have a growing scholarship on the emergence of a ‘data economy’, ‘algorithmic cultures’, ‘filter bubbles’, ‘data philanthropy’, ‘algorithmic regulation’ and similar sweeping diagnoses of the societal effects of increased datafication (Mayer-Schönberger and Cukier 2013). But, surprisingly, we have little research that captures the making of big data and algorithmic correlations, i.e. how the more practical sorting of data occurs in such processes. This chapter discusses a number of assumptions about the societal effects of digital technologies, algorithms and big data, in order to provide a more situated account of the intersection between datafication and social, political and economic developments. More specifically, it unpacks how the production of big data analyses revolves around multiple processes of sourcing, organizing and visualizing that deserve more attention. Engaging insights from the sociological literature on calculation, commensuration and valuation, the chapter contributes to our understanding of how algorithmic analyses are crafted, unpacks how data is made valuable and provides a more situated and meticulous conceptualization of how big data conditions social, economic and cultural transformations. The first part of the chapter discusses how digitization, datafication and other developments in the realm of digital technologies underpin societal diagnoses that often conflate a range of distinguishable phenomena, operate at a very high level of abstraction and distance to the processes they describe. On this backdrop, we argue for the value of a more fine-grained, analytical approach that takes us closer to the operational and practical workings of big data. In particular, more situated and conceptual discussions of the operations and mechanisms at work may help us grasp some of the novel political, social, and economic condi-
S ORTING DATA OUT
| 141
tions resulting from big data without resorting to overly abstract and distant diagnoses. The chapter develops a typology of the social practices and forms of valuation involved in the production of big data analyses – focusing on the following four moments: Production, Structuring, Distribution & Visualization. To flesh out and illustrate the value of this typology, we use two distinct big data projects as empirical illustrations. Our typology captures how social media data, such as those produced on Twitter, and data produced by objects, such as smart city data, are turned into actionable knowledge with social effects. We show that there are important differences between these forms of big data analysis in terms of the way sorting, calculation and valuation occurs at the four moments outlined above. A comparison along the lines of the suggested typology allows us to pinpoint differences between big data projects by conceptualizing how practices of sorting are influential in turning large, messy pools of data into more structured forms of information that can finally be used as actionable knowledge. The typology of knowledge production and valuation processes is our main contribution to sociological understandings of big data since it open a path for more conceptual and contextual debates about the way big data can change knowledge- and valuation regimes. But we also contribute to valuation studies and economic sociology by unpacking how a (non-financial) resource – data – is made valuable through activities of sorting and framing. Our orientation to data value chains contributes to contemporary discussions about valuation practices: First, we stress that worth is a fundamental issue in social, economic and political affairs, and valuation does not require money and may be detached from financial markets. Thus valuation (such as considerations about price vs. value) occurs not only in relation to well-known objects such as financial products and aesthetic goods, but also in relation to less tangible objects such as data. Our chapter shows how such objects are made valuable, i.e. how masses of data are turned into knowledge that can be acted upon and used in decisionmaking processes. Secondly, we argue that valuation ‘takes place in action’ (Callon et al 2007; Beckert/Aspers 2011: 26) and this implies that we need to give attention to organizational, calculative and other practices involved in the sorting and valuation of objects, such as data. In contrast to the current hopes about big data as a source of economic gain and business opportunities, this approach also invites us to problematize the idea of data as having intrinsic value, and instead turn to the social, organizational and political construction and production of data as valuable objects. Thirdly, our approach highlights that valuation may involve or create different ‘orders of worth’ and possible frictions between different ways of sorting, valuating, and attaching legitimacy. This focus on multiplicity
142 | M IKKEL F LYVERBOM & A NDERS K OED M ADSEN
and frictions suggests that within societies or social settings we can identify different forms and regimes of valuation. Our conceptualization and discussion starts from an understanding of big data as a phenomenon made possible by the growing velocity, variety and volume of datafication processes whereby multiple phenomena take the form of digital data (Laney 2001; Mayer-Schönberger/Cukier 2013), and algorithmic developments allowing for mining, correlation and visualization of digital traces from disparate sources (boyd/Crawford 2012; Gitelman 2013). Algorithms are, in this context, understood as generalized procedures for turning dis-organized datainputs into manageable outputs through series of logical rules that provide instructions on how to handle data with specific attributes (Flyverbom et al., in review). Along these lines, we define big data as algorithm-based analyses of large-scale, disparate digital data for purposes of prediction, measurement and governance. As will become apparent below, we specify the components of this definition to distinguish between different sources of digital data. But for the purposes of the next section, this more general definition suffices.
1. F ROM
SWEEPING DIAGNOSES TO SITUATED
OPERATIONS How will big data reshape societies? What are the societal transformations that we can attribute to big data? At present, a number of responses can be identified. To some, big data will lead to a new ‘data economy’, where big data infrastructures, products and services will lead to massive economic growth. For instance, an IDC report suggested a 40% growth – from $3.2 billion in 2010 to $16.9 billion in 2015 (IDC report 2012). To others, datafication will lead to the emergence of new social realities and cultural formations that have data, sharing and information artefacts at their core. These developments have been termed the emergence of ‘algorithmic cultures’ (Galloway 2006), where “computers, running complex mathematical formulae, engage in what’s often considered to be the traditional work of culture: the sorting, classifying, and hierarchizing of people, places, objects, and ideas” (Striphas 2014). Such diagnoses focus on the role of technology and data in the shaping of cultural spheres and orientations, including how we think, act and express ourselves. In a more critical vein, some consider datafication and the reliance on algorithms to lead to ‘filter bubbles’ (Pariser 2011). At the core of Pariser’s warnings about ‘filter bubbles’ lies a concern that the consequences of datafication are the emergence of ‘ecosystems of information’ produced by algorithms. By limiting the kinds and varieties of infor-
S ORTING DATA OUT
| 143
mation we encounter, datafication processes thus create overly personalized and targeted information and communication environments that involve new kinds of segregation, isolation and exclusion. Also, datafication processes are associated with new forms of philanthropy, charity and corporate citizenship, such as what has been termed ‘data philanthropy’ (Pawelke/Tatevossian 2013). Such developments revolve around novel attempts to solve societal challenges through the donation of (ostensibly valuable) data and the emergence of partnerships between public and private actors. Examples include the UN Global Pulse (describe) and Twitter’s so-called ‘data grants’ giving selected researchers access to large amounts of tweets (Stempeck 2014). These discussions focus on how datafication creates new opportunities for experiments with technological and datadriven forms of social change, problem-solving and societal transformation. Finally, some voice concerns about the problematic consequences of relying on big data in the context of regulation and policy-making. As Morozov warns us, the ‘rise of data is the death of politics’ because it replaces politics, history and experience with a naïve belief in data and algorithms (2014). If we make decisions about healthcare, risk management and crime prevention by relying on digital traces and algorithmic calculations, Morozov warns us, we let what he terms ‘Silicon Valley logics’ and technocratic visions undermine important and longstanding principles for societal and political governance, including the welfare state and democracy. These different diagnoses show the multiplicity and variety of hopes and concerns associated with the societal effects of big data – from economy, over culture to regulation. But despite these differences, we can also point to some shared features and discussions that underpin these diagnoses of the data-society nexus. Firstly, they all treat big data as a homogenous phenomenon with a set of unique and uniform characteristics. Discussions about big data have to a large extent exhibited a generalizing mode of reasoning, such as when it has been widely claimed that we live in a ‘petabyte age’ (Anderson 2008) where ‘correlations are a good enough’ (Mayer-Schönberger/Cukier 2013) foundation for knowledge production. The analytical project has been to outline the distinctiveness of big data and position it as a paradigm of data-processing that is different from previous paradigms. At present, big data is considered to be a sweeping digital revolution that – like the emergence of the internet – will disrupt a range of established ways of working, living and thinking (Mayer-Schönberger/Cukier 2013). But our argument is that big data is not one thing, and to nuance and refine contemporary discussions of these developments, we need vocabularies and distinctions that allow us to articulate the more situated and concrete workings of big data projects and analyses. Secondly, these accounts are all about assessing the
144 | M IKKEL F LYVERBOM & A NDERS K OED M ADSEN
value of big data, i.e. attempts to articulate how datafication and algorithms will add value to existing phenomena or processes, or rather diminish them. So, will the economy, the quality of information, or our way of doing regulation be better as a result of big data or not? But the question of the value of big data cannot be reduced to these largely normative discussions of whether the phenomenon is good or bad. Rather, we need more nuanced accounts of how data is made valuable, i.e. the processes by which valuation occurs and is produced in big data projects.
2. C ONCEPTUAL
FOUNDATIONS
The previous section showed how discussions about the emerging data-society are dominated by concepts and theories that aim to identify general characteristics of this societal formation and historical moment. In other words; the aim is to capture conditions and trends that apply across a broad range of data projects. However, this way of discussing datafication hides important differences between distinct forms of big data analysis. By abstracting away from the concrete and practical work of producing, organizing, distributing and visualizing data, these conceptions run the risk of confusing a heterogeneous set of data-practices with a common paradigm. In contrast, we suggest that it is time to start focusing on the different analytical steps involved in big data projects and to illustrate how projects under this heading rely on quite distinct technologies and invoke quite different rationalities. Our main argument is that we need a more finegrained theoretical vocabulary to understand the dynamics of datafication and significant differences between big data projects. Picking up on recent work in science and technology studies (STS) and sociology we conceptualize big data as a matter of sorting. Discussions about sorting start from the basic tenet that societies and organizations must be understood as assembled and fragile phenomena. As John Law puts it ‘perhaps there is ordering, but there is certainly no order’ (Law 1994: 1, emphases in the original), which is why we need to give much more attention to the ways in which sorting and similar attempts at ordering play out (Flyverbom 2015). In the following, we use sorting as an umbrella concept for a range of analytical processes including classification, categorization, quantification, calculation, valuation and commensuration. This approach draws explicitly on Bowker and Star’s (1999) important work on the ethical and political implications of classification and other ways of ‘sorting things out’. In similar ways, we set out to capture how seemingly technical and mundane data crunching processes offer novel insights
S ORTING DATA OUT
| 145
into the organizational and societal implications of datafication. Such an approach offers a more precise understanding of the sorting and classification work involved, problematizes widespread assumptions about data as a source of direct observation and knowledge that ostensibly ‘speaks for itself’, and may ultimately pave the way for more nuanced conceptions of the relationship between datafication and societal transformations. Our goal is to provide a conceptualization of big data analyses as consisting of distinguishable steps and sorting processes. We can think of this as a form of ‘data value chain’ in which data – like other materials – are sourced, refined and turned into valuable products. This also implies that scrutinize well-established distinctions between data, information, and knowledge (Strathern 2005; Leach 2012). This distinction suggests that “data is what comes into the senses [and machines], it is unprocessed stuff. Information is that data organised in some way. Data grouped according to some logic or other. But knowledge is more than information, it is data organised in a way that has an effect. To know something is to have to take it into account (Strathern 1992; 1999), often to have to act because of it, in the light of it, or around it (if only to consider it irrelevant)” (Leach 2012: 84). While such accounts are problematic because they give us the impression that certain kinds of data are ‘raw’ (Gitelman 2013), they do invite us to explore the sorts of sorting processes that this chapter is about. Data can be considered a type of resource that needs to be obtained, refined and classified into information, which in turn needs to be made relevant and applicable to specific contexts and efforts, i.e. be transformed into knowledge that can be acted upon. This also implies that we need to consider the emergence of big data in terms of the ‘memory practices’ involved and to think about these with reference to earlier knowledge production regimes (Bowker 2008). This focus on the production of knowledge out of data and the understanding of knowledge as actionable is fundamental to the conceptualization of big data we propose. Such processes are central to multiple sorts of knowledge production and value creation, but often remain invisible (Hansen/Flyverbom 2014). Making sense of big data phenomena therefore requires that we focus on how data is ‘sorted out’. This is important, we believe, because “the imagination of data is in some measure always an act of classification, of lumping and splitting, nesting and ranking, though the underlying principles at work can be hard to recover. Once in place, classification schemes are notoriously difficult to discern and analyze” (Gitelman 2013: 8f.). Our framework highlights four distinct analytical moments in the process of turning real-time data into actionable knowledge. The first moment concerns the production of data. This is the step where human conduct and movements of ob-
146 | M IKKEL F LYVERBOM & A NDERS K OED M ADSEN
jects are translated into a quantitative and binary stream of data that can be stored and processed by a computer. The second moment concerns the structuring of data. This step involves choices about the databases, classification systems and metadata through which data is ordered and readied for systematic analysis. The third moment concerns the distribution of data. More specifically it focuses on the way access to databases and distribution of digital traces are negotiated between data-owners and end-users. The fourth moment concerns the visualization of data. It involves choices about how to turn the available data into visualizations that give insights into the aspect of the world that one is interested in, as well as considerations about the role that algorithms are to play in the project. While we seek to provide a typology of datafication processes, it is important to stress that it is not a universal and consistent model that fits all settings and projects. As Bowker and Star remind us, “There is no such thing as an unambiguous, uniform classification system” (1999: 322). Our typology integrates conceptual and empirical findings into what we believe is a valuable starting point for studies of the sorting work that goes into big data analyses, and one we hope will be challenged and expanded upon by others. The articulation of these steps has a number of advantages if we want to grasp the societal and organizational consequences of big data. We see the contribution of this approach as two-fold: First of all, it invites us to give attention to the work involved in realizing big data projects, in particular the intricate practices and interactions involved, and this paves the way for a more nuanced discussion of the sorting and valuation of big data. This conceptualization has an explicit focus on datafication as a form of knowledge production that relies on particular technologies and procedures. To this end, insights from science and technology studies (Bowker/Star 1999; Gitelman 2013), discussions of affordances (Hutchby 2001; Hansen/Flyverbom, 2014; Madsen 2015a), the literature on ‘the politics of knowledge’ (Rubio/Beart 2012) and the literature on valuation (Madsen 2015b, and more) are essential. Secondly, this approach reminds us that the production of big data involves a range of material technologies and sorting and classification techniques that deserve attention. One important insight from the literatures outlined above is that such technolo¬gies and techniques are not simple tools, but have distinctive organizing properties and shape the objects and representations produced in significant ways. Carving out new space in between technological determinism and social constructivism, theories about affordances highlight that all kinds of technologies constitute environments that allow for and restrict particular actions (Gibson 1977; Hutchby 2001). For instance, the tracking, aggregation and analysis of large-scale flows of digital data is not possible without devices such as
S ORTING DATA OUT
| 147
mobile telephones, social media interfaces, data-formats on these interfaces, web-crawlers, semantic algorithms and visualization engines. The technological elements embedded in such processes are crucial and formative features that come to shape the forms of knowledge and action made possible. Big data processing involves entanglements between humans and technologies, i.e. sociotechnical networks that allow for particular modes of knowledge production, representation and the steering of conduct. While the distance between conceptions of big data and its societal implications is more extensive in our approach than the sweeping diagnoses we outlined at the beginning of this chapter, we still think the links can be made. As systems for the sorting and classification of data start to crystallize in organizational and other social settings, they become infrastructures for particular ways of thinking and acting (Bowker/Star 1999). The study of such infrastructures may provide us with novel and more textured insights into the data-society nexus that this chapter explores.
3. T WO
CASES AND FOUR ANALYTICAL MOMENTS
We compare the way these four moments play out in two big data projects that seek to solve rather different problems. The first case is Copenhagen Solution Lab (CSL), which is a newly formed organizational unit in the municipality of Copenhagen. Its mission is to build an open database of city-data that allows public and private actors to share data and find common solutions to citywide problems such as parking, floods and tourist guidance. The second case is United Nation’s Global Pulse (GP). This is a methodological innovation laboratory established in 2009 under the Secretary-General. Its mission is to test whether new types of Big Data solutions could improve UN’s crisis management by making it faster and more context-sensitive. Most of the projects run by GP investigate the potentials in using social media data to detect earl signals of crisisrelated stress. The two cases, accordingly, represent different types of Big Data projects. CSL is a municipal project that is primarily experimenting with ‘The Internet of Things’ whereas GP is a global innovation lab working to showcase the relevance of ‘Social Media Monitoring’. Both fall under the general subheading of Big Data and our aim is to show how they relate to the four moments described above. These differences illustrate how the label of Big Data can hide quite different technologies and strategies at work when sorting data and framing it as valuable in relation to political interventions. In fact, we argue that these differences en-
148 | M IKKEL F LYVERBOM & A NDERS K OED M ADSEN
tail dynamics of valuation that are so diverse that they seem hard to designate as being part of the same data-paradigm. Table 1 illustrates the differences between the central technologies involved in each of the analytical moments in the two cases. The next four sub-sections will discuss each case in terms of these moments and show how these technologies are accompanied by distinct strategies of sorting and valuation in the two cases. However, the sub-section will also argue that these strategies are not determined by the technologies but rather established in an interplay between the available technologies and other influences. These influences are outlined in table 2 below. By attending to the summary of the analysis in these two tables it is evident that the projects of CSL and GP result in quite different versions of big data that are hard to fit under one generic heading with equally general diagnoses attached to it. Table 1: TITLE Analytical Moments
Central Technologies Copenhagen Solution Lab (The Internet of Things)
UN Global Pulse (Social Media Monitoring)
Production
Sensors, RFID tags, wifi Social media interfaces on signals Desktops and mobile devices & commercial API’s or negotiated business deals
Structuring
Municipal database with Commercial data repositories standardized metadata across and user-driven metadata organizational sub-units
Distribution
Open source database
Visualization
Real time data mapping software
on
Internal distribution channels in the organization geo- Real-time indicators based on semantic algorithms
1 st analytical moment: The production of data CSL handles the moment of production through the use of sensors, RFID chips, wi-fi signals and GPS’s. These are technologies that can produce data on physi-
S ORTING DATA OUT
| 149
cal movements in space and their diminishing price make them suitable for meeting CSL’s ambition of datafying and mapping city-wide flows of objects and people. For instance, the lab is currently working on translating the position of trash cans, cars and bikes into mapped data. This choice of technology means that the city that can be visualized and subjected to strategic intervention is a city of moveable entities on a geo-coordinated map. However, it is not possible for CSL to datafy all movements in the city. The choice about which to make visible has importance consequences for the type of smart city that CSL is promoting. This choice is central to the strategy of sorting that underpins the project and it is shaped by two influences from the organizational and societal context. . The first influence is the strategic goals for the ‘good and liveable’ city that has already been formulated by the municipality as part of the so-called ‘Copenhagen-stories’. A central element in these stories is the green city and the datafied entities need to fit this story. The entities that are projected to be datafied are therefore – in one way or another – contributing to Copenhagen’s ambition of being CO2-neutral in 2025 or to the ambition of handling the increasing floods that troubles the city. The second influence is the status of infrastructural projects in the city. There are economic benefits in producing data points that can work in combination with ongoing infrastructural projects. For instance, when the municipality is renewing streetlights in a specific neighborhood, this opens a possibility for turning them into sources of data. What is rendered visible through datafication, accordingly, depends upon a fit with existing strategies and infrastructural projects. This illustrates that the general idea of the smart datafied city is inevitably framed by situated conditions such as grand organizational strategies and ongoing infrastructure projects at the moment when data is produced. Data is not found or ‘raw’ – it is carefully produced to fit and organizational and societal context. The city that becomes visible is a city that fits in with existing projects and strategies. This condition obviously influences processes of sorting and it implies that some data points come to be seen as more valuable than others. The valuable data is the kind of data that ensures this fit and it will inevitably influence the way a smart city is perceived an enacted. Choices made in the production phase will, ultimately, come to influence what CSL defines as the ‘needs of the city’ that have to be resolved. Turning to the big data project at GP we can see similarly see dynamics at play in the moment of production. However, the origins and characteristics of the important influences differ from the CSL project. One reason for these differences is that the aim of the GP project is a datafication of words and semantic patterns rather than behaviors and positions. The technologies relied upon to
150 | M IKKEL F LYVERBOM & A NDERS K OED M ADSEN
produce data are technologies through which people communicate. The central technologies are interfaces of social media companies like Twitter and Facebook rather than sensors, RFID chips and wi-fi signals. This focus on words and commercial communication platforms has several implications. First, GP has to work under the condition that the design of these interfaces shapes the articulations that become datafied. For instance, a tweet is maximum 140 characters and it is left by a device that affords a specific mode of communication. A tweet from a PC and a tweet from an app in a mobile device are not the same thing – both in terms of how people write and the additional traces they leave. Second, the design of the interface is determined by a private company that may change it for commercial purposes. Such changes in the interface influence the way articulations become data and the produced data in the GP project is therefore less reliable than, for instance, RFID chips. Furthermore, GP need to negotiate access to the produced data with Twitter. The company stores all tweets in its so-called ‘fire hose’ and access to this database can only be obtained in two ways. The first way is to use the publicly available API and the second way is to negotiate access. In both cases it is Twitter that sets the conditions for the distribution of data and these conditions can change with very short notice. This is especially true when accessing data through the public API. As of now this technology offers the possibility to access a randomized sample of up to 1% of the tweets. However, the sampling method is not transparent and it is almost impossible to base an organizational strategy on the availability of the data. Negotiating access directly with Twitter, in the manner done by GP, ensures more stable and transparent data access. However, it is still a type of access that is much less controlled and transparent than the access in the CSL project. Once again, these discussions of the production of data in the context og GP illustrate that data is not just found in a sea of already existing empirical data. Data is crafted. However, in contrast to the case of CSL, the choices of crafting are beyond the control of the organization using the data. Where the municipality of Copenhagen can (to some extent) lets its choices in the moment of production be guided by its internal strategies and infrastructural projects, the UN finds itself in a situation where important choices about the production of data is ‘outsourced’ to companies like Twitter. This also means that such choices can change throughout a project if the owners of the interfaces decide to change the setup around the production of data. Thus, reliability cannot be a core characteristic of valuable data. An important lesson learned from this focus on the conditions and practical choices made in the moment of production is that data is neither ‘found’ nor
S ORTING DATA OUT
| 151
‘raw’, but rather produced in different ways in different contexts. At the heart of any data-project lie choices about the production of data. However, such choices seem to be quickly glossed over in many of the general discussions about big data (Anderson, 2008; Mayer-Schönberger/Cukier 2013). To the contrary it is often noted that data is ‘found’ rather than ‘made’ and that we have ‘honest signals’ of human behavior. In short; the idea that data comes without production-bias has taken a firm grip on big data imaginations. However, a brief reflection on the data sources of both of our two cases illustrates the relevance of a quote by Geoffry Bowker (2008): ”Raw data is an oxymoron and a bad idea”. While it is true for both cases that their data is increasingly produced ”in the wild” – outside the controlled settings of a research project – this does not entail that the provenance of their production loses interest. Quite to the contrary in order to understand the societal aspects of any given big data analysis there is a need to inquire into the conditions of its production. What is learned from the comparison of CSL and GP is that these conditions lead to situated strategies of sorting and valuation that vary from project to project. These conditions are important to keep in mind for all sorts of actors engaging in big data projects.
2 nd analytical moment: The structuring of data A central ambition in the CSL project is to structure data in a way that enables the cooperation on city data. This includes corporation between different subdivisions of the municipality as well as between the municipality, private data owners and citizens. A condition for such cooperation to succeed is for the different partners to agree on a common data format as well as a coherent set of meta-data to ensure a comment basis for interpretation of the data. The distinction between data and meta-data is important because it is the latter that allows the former to be interpreted and turned into visualizations. For instance, a data point on the amount of trash in a private container is only interesting in so far as there is meta-data that indicates the time of data-collection, the number of days since the container was last emptied and so on. Such data is necessary for dispersed actors to work in data-sets they have not produced themselves. It is accordingly important to establish metadata standards that are accepted across organizational units and external stakeholders. Good and well-structured meta-data becomes a valuable asset. However, getting univocal acceptance of meta-data standards is not an easy task. For instance, inquiring into the data cultures in the municipality of Copenhagen, it is evident that different organizational units have different traditions of
152 | M IKKEL F LYVERBOM & A NDERS K OED M ADSEN
datafication and different approaches to structuring. Some advocate for a very granular meta-data structure that makes it possible for third party users of the data to inquire into as many contextual aspects of the data as possible. An example of this strategy would be to enrich the data with meta-data about which projectleader that had responsibility for producing a specific data point or when new types of containers were introduced. This approach to meta-data is part of a “zero failure” culture where every potential influence on the data need to be investigated before decisions are made. Others advocate for a more simple meta-data structure where third party users does not “get lost” in data. This approach is more pragmatic and prioritizes that data is intelligible and accessible enough for innovative companies to build apps on top of the collected data. Finally, some units in the municipality have quarrels about the potential privacy-issues that can arise from detailed metadata whereas others to not worry as much about potentials for de-anonymization. In contrast to the CSL project, the GP project involves no such negotiations about meta-data structures. Decisions about these matters are simply left to the owners and users of the interfaces from which data is sourced. In the case of Twitter data it is solely the company that decides on the formats in which the data is produced and the metadata that accompanies it. When it comes to the latter it has been a deliberate choice to let users guide some of the organization. Metadata such as the retweet (@) and the hashtag (#) have originated as user practices and later promoted by the company. The other meta-data available is the data that the users agree to leave when clicking the terms of agreement with Twitter. Examples are geo-location data and Twitter usernames. The important point in relation to both sources of meta-data is that none of them are decided by the GP and they can change with very short notice. Accordingly, the problem is not establishing a standard for the structuring of data. It is rather to get Twitter’s structuring of data accepted as valuable within the UN. An important lesson to be learned from these choices in the moment of organization is that decisions about data formats and metadata are not just technical issues. These choices reveal strategies of sorting that will ultimately have consequences for the kind of visualizations that can be produced and the kind of data sources that become visible and valuable in a given project. For instance, to draw a time line of garbage data you need time-stamps as meta-data. Similarly, working with the metadata of retweets enables a certain way of visualizing the importance of information and working with the hashtag enables a certain way of sorting and categorizing themes and events. Similarly, decisions on how to work with the context of data will influence the way these data are used and interpreted. An important point is, once again, that the origins of the prevailing choices
S ORTING DATA OUT
| 153
of data structuring are different in the two projects. Again, the reasons for this difference are influenced by the socio-technical situation in which the projects are carried out.
3 rd analytical moment: Distribution of data A core ambition of the CSL project is to create an open database of city-related data that can attract independent developers and innovative businesses to build applications on top of the database. A central priority is therefore that the data that is produced and structured as part of the project is made openly available for interested third parties to engage with. A ground-rule for the project is that the data that makes it to the data portal is open for everybody. A consequence of this strategy is that the decision about which kind data ends up on the portal becomes a sensitive issue. Two important influences on this decision are traditions of procurement and issues of branding. Traditions of procurement come to play a role because much of the relevant data is produced by private actors that are hired by the municipality to do a specific job. Examples could be tasks such as picking up garbage and combusting it. There are several reasons why private companies are reluctant to make such data accessible to an open database. One reason is that data is increasingly seen as a commercial asset and resource. If sharing of data is not part of the procurement, there will be no natural incentive to release it. Another reason is that combinations of data can reveal company secrets. For instance, it is possible to infer the types of sorting technology a combustion site has if one has data about the amounts of garbage it handles and how much aluminum it succeeds in subtracting from it. Such knowledge is, of course, sensitive for any commercial player and they will be hard pressed to allow data on an open portal if the procurement deal does not require them to do so. However, it is not just commercial players hired in to do a specific job that may be reluctant to make data accessible. Municipalities are political organizations and they have a history of press management where the department of public relations seeks to control the stories that make it to the newspapers and the wider public. Such control traditionally involves only releasing data to selected parties, such as trusted journalists. This way of managing the brand and reputation of a city is difficult to uphold with an open database. If any journalist can access data there is a danger of misinterpretation or outright misuse. When this danger is combined with a precautionary culture, the result may be a situation where the accessibility of data demises and the visualizations of the city risks becoming
154 | M IKKEL F LYVERBOM & A NDERS K OED M ADSEN
less granular. At any rate, these conditions make negotiations about priorities a key component of big data projects. The issues of distribution in the GP project are quite different. Here, there is no ambitions to make the crisis-related data available for external partners to build upon. Rather, the goal of the project is to showcase the usefulness of social media data as a tool and source of insight within the organization. The distribution challenge is, accordingly, to make the produced visualizations travel from the GP lab to decision-making units in the organization. This new breed of crisissignals simply need to be made sensible and legitimate in an organization that has traditionally based its decisions on field surveys and standard economic indicators. One challenge in achieving this has to do with the abovementioned conditions for producing and structuring data. For instance, it is hard to produce a standardized guide for the management of Twitter data that can be circulated in the organization. This is possible for standard survey data where all analytical moments are controlled by the organization. However, data from Twitter is distributed and changing and it is therefore hard to make standardized guidelines for handling it. Ultimately, this reduces the chances that a given method will be adopted in an organization where standards are important. Just as with the moments of production and structuring, these insights into the moment of access and distribution illustrates why big data projects are inevitably situated in ways that come to influence the empirical picture that can be drawn from data. The distribution of data is negotiated on the basis of interests that are often conflicting and quality of any big data project hinges on such situated negotiations. The strategy of distributing data is influenced by the way data is valued by the different partners in the big data project. In the case of CSL the negotiations span municipal sub-divisions, private contractors, journalists and foreign companies whereas the negotiations in the GP the main issue is the valuation of data and standardized guidelines within the organization.
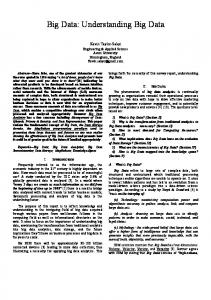
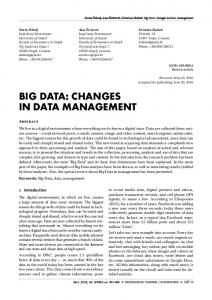
4 th analytical moment: The visualization of data Both the CSL and GP projects seek to produce visualizations that can give insights into empirical dynamics in real time. For instance, figure 1, below, illustrates how CSL envisions Copenhagen to be managed from a control room of real time data feeds on the movement of objects and people. Similarly, figure 2 is an example of a ‘crisis-monitor’ produced as part of the GP project. It gives real-time indications of crisis-related stress by igniting red colors when certain themes seem to be talked about in a negative way:
S ORTING DATA OUT
| 155
Figure 1: Picture from the website of Copenhagen Solution Lab envisioning the ‘control room’ of the smart city
Source: http://cc.cphsolutionslab.dk/
Figure 2: Crisis-monitor developed by UN Global Pulse
Source: UN Global Pulse (2011: 8)
Such visualizations become important tools for governing and making decisions in a big data context. They are what Latour (1986) would refer to as inscriptions that draw things together into an interpretable entity that can be circulated as evidence to back up arguments about, for instance, city planning and crisis intervention. They are powerful tools that deserve critical scrutiny. An important point to derive from the arguments so far is that the shape of such visualizations are not determined by unmediated signals from the empirical reality. Rather, they are conditioned on specific strategies of sorting and valuation that is settled through the three moments described above.
156 | M IKKEL F LYVERBOM & A NDERS K OED M ADSEN
With respect to the two visualizations above, the analysis has illustrated that their form and content have quite different roots. Due to the situations in which they are produced they come to exhibit quite different strategies of sorting and valuating data. In fact, their projects are so different from each other than it is hard to group them under a common heading or interpret them as being part of the same ‘algorithmic culture’. However, at a first glance it may seem warranted to treat the visualizations produced by the CSL and GP projects as two instances of a common data paradigm. For instance, both visualizations prioritize real-time data and rely upon automated algorithmic operations to identify important correlations and predict future instances of, for instance, traffic jams and food crises. However, the analysis above has provided a basis for arguing that the focus on similarities hides important differences between such projects. Differences that need to be conceptualized in future literature on big data. Table 2: TITLE Analytical Moments
Important influences on sorting and valuation Copenhagen Solution Lab (The Internet of Things)
UN Global Pulse (Social Media Monitoring)
Production
Ongoing infrastructure projects Municipal strategies
Re-design of interfaces and APIs based on strategies of platform owners such as Twitter
Structuring
Negotiation of standards and Metadata from crowd-sourmetadata cing and terms of agreement
Distribution
Interests connected to procurement and branding
Visualization Real-time geo-mapping
eg. Approaches to the legitimacy of data in the organizaion Real-time anomaly detection
The situated connection between choices in the four analytical moments makes it necessary to draw distinctions between different types of big data projects. Rather than subsuming such project under a general heading that indicates the rise of a homogenous data paradigm, we suggest that future analyses should begin to inquire the roots of big data visualizations and build distinctions between big data projects on the basis of the four moments. In the case of the two projects dis-
S ORTING DATA OUT
| 157
cussed in this chapter a foundation for making such distinctions could be the table on the previous page.
4. C ONCLUSION Data, like photographs, words and numbers, do not provide direct, neutral or ‘objective’ observations, but situated and historically specific representations. Thus, as Gitelman (2013: 5) suggests, data must be “understood as framed and framing”, and this is how we have approached big data in this chapter. To provide a situated and nuanced conceptualization of datafication and its societal consequences, we have relied on insights from a number of theoretical domains, including valuation studies, science and technology studies and the literature on knowledge production. These conceptual discussions lay the foundation for the assertion that we need to give attention to organizational, calculative and other practices involved in sorting processes, such as those involved in big data analyses. Our analytical framework seeks to highlight processes whereby masses of digital traces are sorted out and turned into knowledge that can be acted upon and used in decision-making processes. An important component of such processes is the ability to make associations between otherwise de-coupled actors. The typology we develop outlines four moments in big data analyses – production, structuring, distribution and visualization – where such sorting- and coupling-work occurs. It uses empirical examples to illustrate how such work plays out in practice and how it is tied up with practices of valuation. The purpose with these illustrations is primarily to give texture to our conceptual typology. But the two cases also offer valuable insights into the variety of material affordances, decisions and rationalities involved in big data analyses. For instance, it is clear that the type of data that is valued in the production phase is influenced by the technological and organizational contexts of the two projects. In the CSL case the produced data needs to fit established strategies and infrastructural projects whereas the type of data that is valued in GP is data that increases UN’s response times to crises. From these outsets the two projects come to frame their respective big data projects in quite different ways. The data that is designated as valuable data in the two cases are, for instance, quite different when it comes to the transparency of the provenance for the organization. Furthermore, we have seen that the two cases are similarly different when it comes to the way they structure and distribute data. In the case of CSL it is clear, for instance, that issues related to standardization, procurement and branding entails a need to re-frame the way the project envisions open data in contrast to
158 | M IKKEL F LYVERBOM & A NDERS K OED M ADSEN
other open data project falling under a big data heading. When compared to the GP project it is also evident, that the CSL project has quite different strategies of sorting when it comes to the way it handles metadata. In contrast to the claims that big data is characterized by crowd-based and algorithmically derived classifications, we have seen that CSL need to align their strategies with the technological affordances and situated conditions within which their project is carried out. In contrast to current theories that aim at outlining general characteristics of big data, our analysis suggests a need to turn to the social, organizational and political construction and production of data as valuable objects. Big data is not valuable because it comes with a specific algorithmic culture, a specific form of data philanthropy or a specific mode of technocratic decision-making. The value of big data projects differ from situation to situation and such projects are according framed in quite different ways in different socio-technical context. Rather than a phenomenon with identifiable traits, big data is a boundary object that is constantly re-framed to fit specific situations and used to mediate between different projects and aspirations (Star/Griesemer 1989). Our approach allows us to unpack this framing by attending to the mundane and situated workings of often invisible processes of quantification, calculation, commensuration and valuation involved in big data analyses. In this manner, we unpack the intricate processes and analytical moments involved in the production and validation of big data. Our typology helps us articulate the potential consequences of datafication in a more precise manner than the sweeping diagnoses discussed above. The chapter thereby problematizes instrumental and normative conceptions that shape current discussions about big data as intrinsically valuable and a direct cause of societal, economic and regulatory transformations. While skeptic of such large-scale diagnoses, our conceptualization of big data as a multiple, performative phenomenon may allow us to engage with questions about the social, political and possible unintended consequences of relying on big data. Such questions could for instance relate to the troubles of introducing an open data strategy in a setting where traditions of procurement and branding are hard to align with such an ambition. Or, it could be questions about the troubles of working with commercial APIs in an organization like the UN. Both of these questions would arise from analyzing specific strategies of sorting and valuing data in the moments outlined in the tables above and subsequently evaluating the fit of these strategies with the established organizational practices that a given big data project is intended to contribute to or disrupt.
S ORTING DATA OUT
| 159
R EFERENCES Anderson, Chris (2008): “The End of Theory: The Data Deluge Makes the Scientific Method Obsolete”, in: Wired Magazine, http://archive.wired.com/ science/discoveries/magazine/16-07/pb_theory. Bowker, Geoffrey (2008): Memory Practices in the Sciences, Cambridge: MIT Press. Bowker, Geoffrey/Star, Susan (1999): Sorting Things Out: Classification and Its Consequences, Cambridge: MIT Press. boyd, danah/Crawford, Kate (2012): “Critical Questions for Big Data. Provocations for a cultural, technological, and scholarly phenomenon”, in: Information, Communication & Society 15, pp. 662-679. Flyverbom, Mikkel/Koed Madsen, Anders/Rasche, Andreas (in review): Big Data as Governmentality – Digital Traces, Algorithms, and the Reconfiguration of Data in International Development. Flyverbom, Mikkel (2015): “Sunlight in cyberspace? On transparency as a form of ordering”, in: European Journal of Social Theory 18, pp. 168-184. Galloway, Alexander (2006): Gaming Essays on Algorithmic Culture, Minneapolis: University of Minnesota Press. Gibson, James (1977): “The theory of affordances”, in: Robert Shaw/John Bransford (Eds.), Perceiving, acting, and knowing: Toward an ecological psychology, Hillsdale: Erlbaum, pp. 67-82. Gitelman, Lisa (Ed.) (2013): “Raw Data” Is an Oxymoron, Cambridge: MIT Press. Hansen, Hans/ Flyverbom, Mikkel (2014): “The Politics of Transparency and the Calibration of Knowledge in the Digital Age”, in: Organization, http://org.sagepub.com/content/early/recent. Hutchby, Ian (2001): “Technologies, Texts and Affordances”, in: Sociology 35, pp.441–456. IDC (2012): “Worldwide Big Data Technology and Services 2012 – 2015 Forecast”, Report. http://ec.europa.eu/digital-agenda/en/news/worldwide-bigdata-technology-and-services-2012-2015-forecast. Laney, Doug (2001): “3D Data Management: Controlling Data Volume, Velocity, and Variety”, Application Delivery Strategies, Meta Group Inc. Latour, Bruno (1986): “Visualization and cognition”, in: Knowledge and society, 6, pp. 1-40. Law, John (1994): Organizing Modernity, Oxford: Blackwell.
160 | M IKKEL F LYVERBOM & A NDERS K OED M ADSEN
Leach, James (2012): “Step Inside: Knowledge Freely Available. The Politics of (making) Knowledge objects”, in: Patrick Beart/Fernando Rubio (Eds.), The Politics of Knowledge, London: Routledge, pp. 79-95. Madsen, Anders Koed (2015a): “Between technical features and analytic capabilities: Charting a relational affordance space for digital social analytics”, in: Big Data & Society 2, pp. 1-15. Madsen, Anders Koed (2015b): “Tracing data – paying attention: Interpreting digital methods through valuation studies and Gibson’s theory of perception”, in Martin Kornberger et al. (Eds.), Making Things Valuable, Oxford University Press (forthcoming). Mayer-Schönberger, Viktor/Cukier, Kenneth (2013): Big data, A revolution that will transform how we live, work and think, London: John Murray. Morozov, Evgeny (2014): “The rise of data and the death of politics”, in: The Guardian. Can be retrieved at: http://www.theguardian.com/technology/2014/jul/20/rise-of-data-death-ofpolitics-evgeny-morozov-algorithmic-regulation. Pariser, Eli (2011): The filter bubble, What the internet is hiding from you, New York: Penguin Press. Pawelke, Andreas/Tatevossian, Anoush (2013): “Data Philanthropy: Where Are We Now?”, Blog post. United Nations Global Pulse. Can be retrieved at: http://www.unglobalpulse.org/data-philanthropy-where-are-we-now. Rubio, Fernando/Baert, Patrick (Eds.) (2012): The Politics of Knowledge, London: Routledge. Star, Susan/Griesemer, James (1989): "Institutional Ecology, 'Translations', and Boundary Objects: Amateurs and Professionals in Berkeley's Museum of Vertebrate Zoology 1907-39", in: Social Studies of Science 19, pp. 387-420. Stempeck, Matt (2014): “Sharing Data Is a Form of Corporate Philanthropy”. Blog Post. Harvard Business Review. Can be retrieved at: https://hbr.org/2014/07/sharing-data-is-a-form-of-corporate-philanthropy/ Strathern, Marilyn (1992): After Nature: English Kinship in the Late Twentieth Century, Cambridge: Cambridge University Press. Strathern, Marilyn (1999): “The Aesthetics of Substance”, in: Marilyn Strathern (Ed.), Property, Substance and Effect, London: The Athlone Press, pp. 45– 64. Strathern, Marilyn (2005): “Robust Knowledge and Fragile Future”’, in: Aihwa Ong/Stephen Collier, (Eds.), Global Assemblages: Technology, Politics and Ethics as Anthropological Problems, Malden/Oxford: Blackwell Publishing, pp. 464-481.
S ORTING DATA OUT
| 161
Striphas, Ted (2014): “Algorithmic culture. 'Culture now has two audiences: people and machines'”, Futurists’ Views. Can be retrieved at: https://medium.com/futurists-views/algorithmic-culture-culture-now-has-two -audiences-people-and-machines-2bdaa404f643. UN Global Pulse (2011): Twitter and perceptions of crisis-related stress. Methodological white paper. Can be retrieved at: http://www.unglobalpulse.org/ research