source data 1. Data summary table for the results shown in Figure 2D
Recommend Documents
Figure 7ââsource data 1. Data summary table for the results shown in Figure 7E. Construct. Percent of molecules without transitions. Percent of molecules with.
Figure 8ââsource data 1. Data summary table for the results shown in Figure 8D. Construct. Percent of molecules without transitions. Percent of molecules with.
Figure 3ââsource data 1. Data summary table for the results shown in Figure 3C. NaCl concentration. (mM). Percent of molecules without transitions. Percent of.
Data summary table for the results shown in Figure 6D. Construct. Added protein. Percent of molecules without transitions. Percent of molecules with transitions.
Data summary table for the results shown in Figure 5E-F. Construct. High FRET dwell time. Low FRET dwell time. Number of analyzed transitions. Long-lived.
Figure 7ââsource data 2. Data summary table for the results shown in Figure 7H-I. Construct. High FRET dwell time. Mid FRET dwell time. Low FRET dwell time.
Data summary table for the results shown in Figure 4E-F. αSNAP mutants. High FRET dwell time. Low FRET dwell time. Number of analyzed transitions. Long- ...
Data summary table for the results shown in Figure 6E-F. Added protein. High FRET dwell time. Low FRET dwell time. Number of analyzed transitions. Long- ...
Figure 3ââsource data 2. Data summary table for the results shown in Figure 3D-E. NaCl concentration. (mM). High FRET dwell time. Low FRET dwell time.
Data summary table for the results shown in Figure 9F-G. Construct. High FRET dwell time. Low FRET dwell time. Number of analyzed transitions. Long-lived.
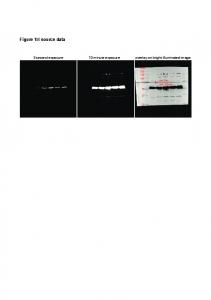
Figure 1M source data. 5 second exposure. 10 minute exposure overlay on bright-illuminated image. 250. 150. 100. 75. 50. 37. 25. kDa. â anti Ret anti Tubulin.
D42 or Nsyb. L3*. Increased and small boutons. Muscle. C57 or Mef2. L3*. Increased and small boutons. Neuron and Muscle. D42 and Mef2. L3*. Increased and ...
(Table 13 and Table 9). Chart 1a and Chart 1b. Estimated enrollment in 2 year and 4 year colleges by recent high school completers all institutions (in 2009).
anti-trimethyl histone H3-K27 at the Fabp5 gene locus from naïve CD4 T cells and activated CD4 T cells treated with DMSO (Control) and GW9662. (10 μM).
In each of these problems, we are shown a circuit and its Thevenin or Norton ...
R.C. Dorf and J.A Svoboda. ... Figure 1 The circuit considered in Example 1.
A. Source data for Figure 4A, Top: cartoon summary of assay. Left panel: eIF2B competition with eIF2-TC is overcome by eIF5-CTD. Right panel: eIF2Be ...
Supplementary Figure 1. Relationship between systemic fractional spillover (y axis) and total body fat mass at baseline (left) and after weight loss (right).
Chen YH, McFarland W, Raymond HF. Estimated Number of ... Grey JA, Bernstein KT, Sullivan PS, Purcell DW, Chesson HW,. Gift TL, et al. Estimating the ...
0.07. 0.22. 0.63. 4.43. 0.88. 0.41. 0.58. 0.29. 1.02. 59861. RES. SEG w. 19.8. 1.49. 0.09. 0.22. 0.62. 4.64. 0.80. 0.45. 0.47. 0.43. 1.07. 59862. ADL. SEG m. 24.0.
Reward Dependence, high in Self-directedness, low in Self-transcendence, high in Dark Triad traits. ⢠Other important characteristics: frequently physical active ...
source data 1. Data summary table for the results shown in Figure 2D
Figure 2ââsource data 1. Data summary table for the results shown in Figure 2D. Conditions. Percent of molecules without transitions. Percent of molecules with.
Figure 2––source data 1. Data summary table for the results shown in Figure 2D.