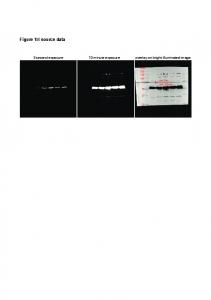
Figure 1M source data. 5 second exposure. 10 minute exposure overlay on bright-illuminated image. 250. 150. 100. 75. 50. 37. 25. kDa. â anti Ret anti Tubulin.
tin. ) Quantitation of immunoblots in Figure 1A by ImageJ. Figure W2. Panc1. C o n tro l. U s p. 9 x. -K. D. 0 .0 0. 0 .2 5. 0 .5 0. 0 .7 5. 1 .0 0. 1 .2 5. R e la tiv e. In te.
A20 (N = 4) (a), CYLD (N = 3) (b), BCL10 (N = 8) (c) and RelB (N = 4) (d). BCL10 was expressed as a. C-terminal green fluorescent protein tagged construct in ...
A. Source data for Figure 4A, Top: cartoon summary of assay. Left panel: eIF2B competition with eIF2-TC is overcome by eIF5-CTD. Right panel: eIF2Be ...
D42 or Nsyb. L3*. Increased and small boutons. Muscle. C57 or Mef2. L3*. Increased and small boutons. Neuron and Muscle. D42 and Mef2. L3*. Increased and ...
Figure S1. Representative western blot and quantification analysis of brain homogenates found the DLP1 and OPA1 protein levels were unchanged in Mfn2 cKO ...
Dec 14, 2018 - established, the rivers incising afresh into the landscape and forming ... ing, forming horsts and graben basins, the latter infilled dur- ing later ...
In After Effects (a), enable the 3D Layer switch in the. Timeline ... as Adobe After
Effects (version 5 or later), Apple Motion 3, and Au- .... After Effects Apprentice.
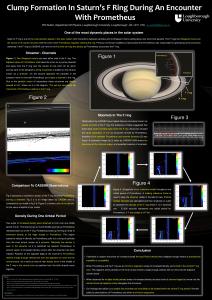
Saturn's F ring is one of the most dynamic places in the solar system with interactions between ... observed in the F ring by CASSINI, but here for the first time we map the density as Prometheus encounters the F ring. ... instability is a possibilit
Jul 2, 2014 - outcome of primary hyperoxaluria type 1 correlates with the AGXT mutation type. Giorgia Mandrile1,2,8, Christiaan S. van Woerden3,8, Paola ...
Figure S1. Northern blot analysis of the processed RNA generated from CRISPR locus F from total cellular RNA extracts of S. solfataricus P2. Both 1. spacer 11 ...
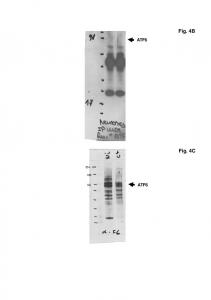
21. NRAS. Source Data. Immunoblots from Figure 4. Dashed outlines indicate blot areas shown in main Figure. 44 β-actin ...
Source Data. Immunoblots from Figure 4 Dashed outlines indicate blot areas shown in main Figure.
NRAS
21
44
β-actin
Fig 4C
Number of macrometastases of C57BL/6 mice at four weeks after s.c. delivery 6 of 10 LLC or AE17 cells expressing shC, shNras, or shKras plasmids LLC
AE17 shC
shNras
shKras
shC
shNras
shKras
7
0
0
2
0
0
5
0
1
5
0
0
8
0
0
6
0
0
5
3
0
2
1
2
3
1
1
5
2
2
1
0
0
6
0
0
3
1
0
4
0
1
3
1
2
6
0
0
19
1
3
9
0
4
8
7
7
1
3
6
6
6
5
3
10
5
4 5
Fig 4D
Number of macrometastases of C57BL/6 mice at two weeks after i.v. delivery 6 of 0.25 x 10 LLC or AE17 cells expressing shC or shNras, or MC38 cells LLC