Collected Ground Truth parameters (GT0) of surface experimental shots and .... varied from 2.8 Hz for the largest explosion to 5-6 Hz for smaller shots. a b.
28th Seismic Research Review: Ground-Based Nuclear Explosion Monitoring Technologies
SOURCE FEATURES AND SCALING OF BURIED AND SURFACE EXPERIMENTAL EXPLOSIONS IN ISRAEL Yefim Gitterman, Abraham Hofstetter, and Vladimir Pinsky Geophysical Institute of Israel Sponsored by Air Force Research Laboratory Contract F19628-03-C-0124 ABSTRACT During the second year of the project additional observations were collected to study empirical features of seismic energy generation for different explosion seismic sources, and how this energy is partitioned between P, S, and surface waves, in specific geological conditions and tectonic settings of the Middle East. The observations concern buried experimental explosions and surface military detonations, for which Ground Truth information (GT0) and blast design parameters were collected. We analyzed source features and scaling for single-fired, surface explosions at Sayarim military range near Eilat, observed at near-source 3C portable short period (SP) seismometers and regional International Monitoring System (IMS) broadband (BB) stations. A dataset of combined observations of seismic and infrasound waves at collocated sensors was also collected, with S-wave manifestation at distances of up to 150 km. Ground-truth data for 19 explosions in a broad charge weight range (100-8500 kg), recorded at numerous portable and permanent SP and BB stations, facilitated the analysis of energetic characteristics of seismic signals depending on the yield. Source scaling parameters were determined for regional phases observed at BB station EIL (33-38 km). Obtained estimations and waveform features for the surface seismic sources were compared to nearby Sayarim buried (borehole) experimental explosions conducted by the Geophysical Institute of Israel (GII) in 2004, recorded also at EIL. After correction the data for the distance and type of explosives, the scaling power law parameter for P-waves (0.91) with maximal amplitudes was found similar to that for the buried explosions (0.93). The new jSTAR software developed at GII was applied to collected seismograms for the energy generation analysis. Analysis of Bet-Alpha buried explosions, conducted by GII in 2005 at a basalt quarry and recorded at BB MMLI station, confirmed that amplitudes of regional phases and local magnitudes are well correlated with the scaled depth. Coda-derived moment-rate spectra techniques were applied to BB records for determination of stable regional magnitude for some large-scale calibration explosions conducted by GII: A series of three depth of burial (DOB) experimental explosions of near-spherical charges (five tons of Ammonium Nitrate Fuel Oil [ANFO]) at different depths (22, 43, and 63 m) at Rotem phosphate quarry is scheduled for July 2006. During preparations of the experiment, a number of test shots were conducted in marl rocks to elaborate optimal blast design parameters. Large cavities (up to 3 m) were created at significant depths (up to 63 m) using a special technique, and a number of fully coupled and partially decoupled test explosions were conducted and recorded by numerous portable seismic sensors and permanent stations.
597
28th Seismic Research Review: Ground-Based Nuclear Explosion Monitoring Technologies
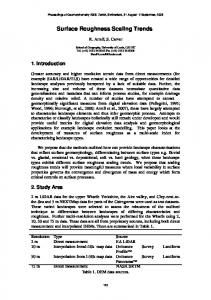
OBJECTIVES The main objectives of the project are 1) conduction of experimental single-fired explosions of special design; 2) elaboration and verification of empirical source scaling relationships, estimating dependence of seismic wave parameters on different source features; and 3) quantifying the coupling and specific seismic source features, including energy generation analysis and partitioning into various regional phases. RESEARCH ACCOMPLISHED During the second year we collected an extensive Ground Truth dataset of surface explosion seismic sources. The collected data were used for 1) analysis of energetic characteristics of seismic signals depending on the yield and estimation of source scaling parameters for regional phases; and 2) comparison of the scaling parameters, waveforms and spectral features to nearby buried explosions observed at the same BB station. Data of Bet-Alpha explosion series (2005) were used to analyze peak amplitudes and local magnitudes versus charge weight, scaled depth and explosives type. Coda-derived moment-rate spectra technique was applied to BB records for determination of stable regional magnitude for some large-scale calibration explosions conducted by GII. During preparations of experimental explosions of near-spherical charges at different depths (planned for July 2006), several small test shots were conducted to elaborate optimal blast design parameters and to create large size cavities. The test shots were recorded by portable near-source sensors and used for the energy generation analysis. In the waveform analysis we used new jSTAR software developed at GII that provides joint processing of different data formats for SP and BB stations (Polozov and Pinsky, 2005). Collection of Data and Ground-Truth Information for Sayarim Surface Military Detonations. GT0 data and records for 13 explosions were collected in May-June 1998 during a joint experiment of Israel Defense Forces (IDF) and the US Army Corps of Engineers at the Sayarim military range (Gitterman et al., 2001). The pointlike single charges in the range 215-2200 kg of different configurations and explosive composition (TNT, ANFO and Khanit) were detonated on the ground surface (Lat 29.9378ºN, Lon. 34.8185ºE). A similar explosion series of half-spherical charges at about the same site (Lat. 29.95429ºN, Lon. 34.82911ºE) was conducted in October 2003. We collected data for three shots (Figure 1, Table 1). A significant feature of all the shots was that the charges consisted of pure explosives of exactly known weight. To extend the observation distance range for surface seismic sources, we used data of nearby large explosions (4.5-8.5 tons) intended to destroy outdated ammunition. We visited the explosion site (Lat. 29.99140ºN, Lon. 34.80469ºE) on December 6 and 7, 2005, observed and collected GT0 for three shots, which we placed on the land surface and exposed to the air (Figure 2). Equivalent TNT charge weight was estimated considering shell casing and different explosive types (Table 1). We measured detonation time and recorded seismic and acoustic waves by near-source portable seismic stations. (A low-frequency infrasound sensor Chaparral 2 was installed in 2005 at the village of Zofar at 73 km; high-quality signals were observed that will be used in a future research). All selected explosions were well recorded by IMS BB station EIL; some shots were observed also at SP ISN stations (up to 150 km), and close BB stations HRFI, KZIT (in 2003, 2005). Figure 1. Controlled Sayarim explosions and recording stations: 1 - buried charge-weight series in 2004; 2 & 3 – surface experimental series in 1998 & 2003; 4 –detonations of old ammunition in 2005.
598
28th Seismic Research Review: Ground-Based Nuclear Explosion Monitoring Technologies
Table 1. Collected Ground Truth parameters (GT0) of surface experimental shots and detonations of old ammunition at Sayarim military range. Ex. No
Date
O.T.
Charge W, kg
Design
TNT equiv.§
Distance to EIL, km
1
20.05.98
11:37:47.5*
830
830
32.2
2 3 4 5 6 7 8 9 10 11 12 13 14 15 16 17
24.05.98 26.05.98 28.05.98 02.06.98 02.06.98 03.06.98 03.06.98 03.06.98 04.06.98 07.06.98 08.06.98 08.06.98 27.10.03 30.10.03 06.11.03 06.12.05
14:37:13.70 14:44:02:69 12:25:29* 09:18:46.67 16:30:18* 09:08:57* 15:50:35.68 16:31:06.16 16:43:58.90 15:16:56.8* 09:49:07.9* 16:15:58.0* 11:30:44.75 10:59:29.60 09:00:31.00 14:18:47.5*
830 1000 1000 480
TNT cylinder, d~1m, h~1.5m, detonation down TNT half-spherical, detonation up ANFO, detonation down ANFO TNT half-spherical, detonation up
1000 202 1025 2200 830 830 100 8500
18
07.12.05
13:24:38.6*
4680
19
07.12.05
13:30:15.8*
8570
ANFO H6, warhead MK83 830 TNT (cubic), 195 ANFO TNT+hanit TNT half-spherical TNT half-spherical TNT cylinder 7.5 ton henamit (emulsion) 1 ton TNT (ammunition shells) 4.23 ton henamit (emulsion) 0.45 ton compositeB (ammun. mines) 7.57 ton henamit (emulsion) 1 ton TNT (ammunition shells)
830 800 800 480
800 215 986 2200 830 830 100 7375
33.5 38.3
4086
38.6
7434
38.3
* O.T. is estimated from records of close SP and BB stations; § Explosive TNT equivalent: ANFO – 80%, henamit – 85%, compositeB – 109%.
Figure 2. Sayarim ammunition explosion on Dec. 6, 2005 (Ex.17). Industrial explosive (ANFO-like emulsion Henamit) was added to provide full demolition of the shells (left). The right photo is made from a distance ~3 km, with a large zoom (courtesy of Y. Hamashdyan of IDF). 599
28th Seismic Research Review: Ground-Based Nuclear Explosion Monitoring Technologies
The three explosions in 2003 were also recorded by portable stations of a special design. The acoustic sensors (low-frequency electret condenser microphone put in a resonance box) were grouped in triangles, each side 100 m long, forming a tripartite array (Figure 3). Each array included a vertical SP seismometer (L4C) collocated with one of the microphones. Acoustic sensors geometry is configured to provide better estimation of source location, which was a major goal of the observations (Pinsky et al., 2005).
Figure 3. Observations in 1998: (a) Configuration of a hybrid seismic/acoustic portable tripartite array; (b) installed sensors in the Northern apex of the station triangle during one of the shots. Energy Generation and Source Yield Scaling for Sayarim Surface Explosions. Strong infrasound phases were observed at seismic channels of local SP and BB stations, which in some cases show much higher amplitudes than seismic waves (Figure 4). Figure 4 also demonstrates a striking example of antipodal manifestation of acoustic phases of the same explosion at two SP stations situated at the same epicentral distance but in opposite directions (Ex.14, Oct. 27, 2003), and the ratio was changed to the opposite on another day (Ex.16, Nov. 6, 2003). These observations correspond to the well known fact that acoustic amplitudes and phase propagation time depend strongly on atmospheric conditions along the infrasound propagation path, especially the altitude distribution of wind direction and velocity (Stump et al., 2002).
Figure 4. Observations of diverse acoustic phases (T) from surface shots in 2003 at two ISN seismic stations (plotted in absolute scale, filter 1-15 Hz is applied). The extensive GT0 dataset of about 20 closely-spaced explosions in the broad range of charges 100-8500 kg, recorded at numerous SP and BB stations, facilitate the analysis of seismic energy generation depending on the yield. For a preliminary analysis of energetic characteristics we selected observations at IMS BB station EIL, located at 32-38 km from the explosions (Table 1). Spectra of pre-signal noise showed energy maximum at ~0.2-0.3 Hz, mostly up to ~1 Hz, then seismograms were filtered in the frequency band of 1-20 Hz for 80-Hz data and 1-10 Hz for 20-Hz data (Figure 5). Initially we measured maximal signal amplitudes which are closely correlated with the energy of
600
28th Seismic Research Review: Ground-Based Nuclear Explosion Monitoring Technologies
radiated seismic waves. For Sayarim shots, observed at the EIL station, maximal amplitudes are presented in first arrivals of P phase (Pg), while S waves are not manifested clearly (Figure 5a). Amplitude spectral shapes of seismic phases are found coherent in general for the five times charge increase (Figure 6). For surface (Rg) waves the dominant frequency and simple spectral shape are about the same for the four shots, only the maximal spectral amplitude is raised ~4 times, whereas spectra of P (Pg) phase are more complicated and the dominant frequency is varied from 2.8 Hz for the largest explosion to 5-6 Hz for smaller shots. a
b
Figure 5. (a) Seismograms (in absolute scale) of 4 selected Sayarim surface explosions at BB station EIL (vertical), low-frequency noise (f