In launching DDoS attacks, zombie hosts are recruited and their IP (Internet protocol) addresses are spoofed (i.e., IP spoofing) with the attacker controlling this ...
Source Identification of Spoofed DDoS Attacks using an Image Processing Approach Tae Hwan Kim a,*, Dong Seong Kim b, Sang Min Lee c, Joon Heo a a
Future Internet Research Team, National Institute for Mathematical Sciences, Daejeon, Korea Department of Computer Science and Software Eng., University of Canterbury, New Zealand c Department of Computer Eng., Korea Aerospace University, Korea
b
Abstract This paper presents a novel source identification scheme for spoofed DDoS attacks using an image processing method. The key idea is that “DDoS attack traffic” that uses subnet spoofing is represented as “lines” on the spatial image planes, and they can be recognized by an edge detection algorithm. Applying the clustering technique to the lines makes it possible to identify multiple attack source networks simultaneously. On the identified networks which the zombie hosts reside, we then employ a signature based pattern extraction algorithm, called pivoted movement, and the DDoS attacks are filtered by correlating IP and MAC pairings signature. Unlike previous IP traceback schemes such as packet marking, which tried to diagnose the entire attack path, our proposed scheme focuses on identifying only the attack source. Our approach can achieve an adaptive response to DDoS attacks, thereby mitigating them at the source, while minimizing the disruption of legitimate traffic. The proposed scheme is analyzed and evaluated on the IPv4 and IPv6 network topology from CAIDA and the results show superior effectiveness.
Keywords: DDoS attacks, edge detection, intrusion detection, IP traceback, security
1 Introduction In launching DDoS attacks, zombie hosts are recruited and their IP (Internet protocol) addresses are spoofed (i.e., IP spoofing) with the attacker controlling this process. This can not only conceal the zombie hosts identity but also weaken the attempts of defenders to respond to these attacks. The “spoofer project” in [10] shows that a large part of the Internet is vulnerable to IP spoofing; it deploys ingress/egress filtering which is considered its typical countermeasure. Both the ingress and egress filtering may throttle the strength of DDoS attacks and ensure that traffic leaving a local network may carry only IP addresses that belong to the subnet [9]. However, the attackers are more sophisticated. If a zombie host spoofs IP addresses from the address space assigned
to its subnet, called “subnet spoofing,” the spoofed packets cannot be detected, in spite of ingress/egress filtering, and the IP addresses of the zombie hosts are still effectively hidden. It is rather hard to detect spoofing at any point between the exit router and the victim systems, and to the best of our knowledge, there are only a few feasible solutions [13] for subnet spoofing. In this paper, we propose a novel source identification scheme to combat subnet spoofed DDoS attacks. The motivation of the proposed idea is that incoming spoofed DDoS traffic can appear as “lines” on an image space. Recognition of these lines by an edge detection algorithm (we use the Canny edge detection algorithm) enables one to identify DDoS attack sources. We can then filter out DDoS attacks using a signature based pattern extracting algorithm named “pivoted movement,” which correlates information, such as IP and MAC (Media Access Control) pairings. The proposed method of identifying DDoS attack sources comprises the following steps: i) Incoming packets to victim systems are mapped into a two dimensional image space called the NetSCENE (network scene); DDoS attacks are presented as lines on the NetSCENE. ii) DDoS attack source networks are identified by an edge detection process (we use the Canny edge detection algorithm), and each edge is linked to the local network addresses at which the zombies are located. iii) The victim system sends instructions to the source router connected to the identified local network to perform the pivoted movement algorithm; the outgoing packets from the local network are then marked with a signature by the source router. iv) The router can filter out attack packets based on the attack signature. The proposed scheme handles multiple sources simultaneously and repeats this process until the attack is mitigated or an administrator stops it.
The main contributions of our paper are three-fold: First, we propose a network visualization method using NetSCENE, which enables DDoS attacks to be
visualized clearly. It facilitates intuitive judgment, and the analysis of a large amount of traffic data. Second, the proposed identification scheme can not only detect DDoS attacks but also simultaneously trace them back to the multiple zombie hosts. Third, it supports the DDoS response paradigm in which the attack detection module is placed close to the victim system, while the countermeasure (such as the packet filtering) can be implemented at the source. The rest of the paper is organized as follows. Related work is introduced in Section 2. The proposed source identification scheme is presented in Section 3. The experimental results are presented in Section 4, and we present our conclusions in Section 5.
2 Related Work In previous works on DDoS attack source identification and IP traceback [12], packet marking techniques were proposed. Packet marking is used to reveal internal network information to end-hosts. This information is sent by the routers in the headers of regular IP packets on their way to their destination. However, packet marking techniques have limitations from the point of view of practicality. The packet marking procedure causes an additional overhead to routers and it is not easy to deploy routers in which a marking module is installed over the networks of interest. The major drawback of these schemes is their combative weakness in cases when packet markings have been forged [1]. Visualization can be applied for various fields such as analysis of networks behavior [4, 8], intrusion detection [18] and identifying anomaly types [15]. Kim and Kang defined the signs of various network anomalies that appear on visualization tools, and proposed an algorithm called RADAR, which can extract anomalies using a simple principle [8]. It can handle various anomalies using one simple extracting algorithm and just three bits of packet signatures; however, legitimate packet signatures cannot be defined and therefore it causes a high level of false positive alarms. The NetViewer [15] is based on the idea that “by observing the traffic and correlating it to the previous normal states of traffic, it may be possible to see whether the current traffic is behaving in an anomalous manner.” The authors' previous work [14] proposed a technique for detecting a traffic anomaly by analyzing the correlation of destination IP addresses in outgoing traffic at an egress router. Their hypothesis was that a destination IP address will have a high degree of correlation, for a number of reasons, and that changes in the correlation of outgoing addresses can be used to identify network traffic
anomalies. Based on this hypothesis, they applied a discrete wavelet transform on the address and port number correlation data over several time scales.
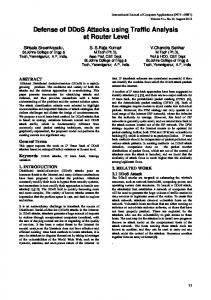
3 Proposed DDoS Attack Source Identification Scheme 3.1 A system model and assumptions We assume the followings. i) Every host, either a client or a server, is connected to its local edge router. The edge routers are in turn interconnected by core routers. The proposed scheme is transparent to link-layer devices such as switches. Therefore, any switches that may be connected between the client and its egress router are ignored. ii) Every route from the attack source(s) to the victim is fixed during the time frame of interest. A recent study [5] has shown that 95% of the routes observed in the Internet have fewer than five observable daily changes. iii) According to the spoofer project [10], zombies spoof source IP addresses within their subnet range on their packets [9] to avoid ingress/egress filtering deployed by ISPs (Internet Service Provider) in a large area. iv) The MAC address of the zombie hosts and TTL field of the packet they send are not spoofed [12]. Incoming network traffic
NetSCENE : Visualization of traffic as an image
Edge detection : DDoS source Network identification
Pivoted movement : Zombie host identification
Filtering : filtering the attack packets based on the signature
Fig. 1. Overall flow of proposed scheme
The overall flow of the proposed scheme is depicted in Figure 1. First, incoming traffic is represented in a 2D (two-dimensional) image space named NetSCENE. Second, the source network of DDoS attacks is represented as edge(s) on NetSCENE. The network address of DDoS attacks sources is identified using an edge detection algorithm (we use the Canny edge detection algorithm). Third, we use an improved version of “pivoted movement” to identify the zombie hosts’ addresses. Fourth, filtering is performed. In the following subsections, we present an illustrative example and each step will then be described in more detail.
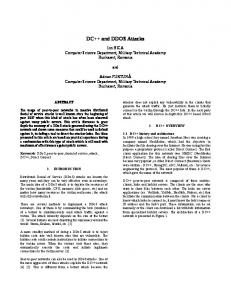
3.2 An illustrative example In figure 2, we present an overview of the proposed scheme using an illustrative example. There are no zombies in local network 1, whereas zombies are located in local networks 2, 3, and 4; they generate DDoS attack packets with subnet spoofing assigned by their local network prefix. For example, zombie ‘a’ randomly chooses source IP addresses from 210.119.29.1 to 210.119.29.254 and uses them for
each of the attack packets. In the case of the zombie ‘b’, its spoofable IP range is from 204.17.5.97 to 204.17.5.126. At the victim system, the patterns of these attacks appear as edges on the NetSCENE. These edges on the NetSCENE are then extracted by an edge detection process and linked to the network addresses as 210.119.29.0/24 and 204.17.5.96/27, according to the position and length of the edge. Through this process, the local networks linked to the router ‘A’ and ‘B’ are identified, and finally we can locate the network zone in which the zombies are residing. It is not sufficient to use only the source “network” in which the zombie hosts reside to filter the DDoS packets heading toward the victim system, because the packets from legitimate hosts located in local networks cannot bypass the filtering module, and thus, a high level of false positives will result. To cope with this issue, we perform one more step using the signature based pivoted movement algorithm. The idea of the algorithm stems from the fact that zombie hosts spoof their IP address but not their MAC address [3]. The legitimate packets pair one IP address to one MAC address, while the attack packets pivot the source IP address on the MAC address and destination IP address. Consequently, only the attack packets can be filtered out based on the signature. Each phase is described in more detail in the next subsection. Local network1
Local network2
Local network3
Local network4 08:c7:87:bb:1d:14
00:d9:d1:25:47:1a
c
b
a
d
monitors the packet headers of network traffic at regular intervals and analyzes the aggregate data. When DDoS attacks occur, the network usage pattern may change and the peculiarities (e.g., edges) can become visible on the image. Furthermore, the NetSCENE is specially designed to achieve the goal that each edge on the image is linked to the specific local network addresses that is the attack sources. NetSCENE employs IP header data collected downstream of the network at the victim system. The collected data in each domain may include the source IP address and hop count value (Hc). Although the hop count value is not directly stored in the IP header, it can be easilty computed according to [5] based on the TTL field. In particular, to describe the specific dispersion of network traffic by IP spoofing, the IP address domain is divided into two portions: the network address (In) and the host address (Ih). In the /24 networks of IPv4, for example, the upper 24bits of the IP address represent the network address and the lower 8bits of the IP address represent the host address. Each packet is mapped into the NetSCENE, two-dimensional image space, according to their values using the two features, In and Ih. The hop count (Hc) and measured traffic volume (Tc) of each flow are stored in the pixel of the NetSCENE, and Tc is presented as the pixel density. Consequently, Each pixel in NetSCENE represents a “flow”, which is defined as a set of packets sharing the same In, Ih, and TTL value.
zombie hosts identification
00:95:2e:1a:3d:10
20:24:8c:a7:0d:1e
0
NetSCENE (210ⅹ28)
0
256 IPv6 network
attack source network identification
mitigating at source
A
.0/22 .0/23
B
.0/24
source networks .0/25
.128/25
victim networks .0/26
Aggregated packet analysis on the NetSCENE
detecting at victim : victim
: zombie
: client
one pixel Tc Lc
.64/26 .128/26
: router .192/26 .0/27
Fig. 2. An illustrative example
.32/27 .64/27
3.3 Construction of NetSCENE: network as an image Certain attacks are interpretable only when the aggregate traffic flow is considered [17] since, when only individual flow behavior is considered, DDoS attack flows are not distinguishable from normal flows. In order to address these issues and improve scalability, our approach considers the analysis of aggregate packet header data. To analyze and visualize the aggregated network traffic, we use NetSCENE as our network visualization tool, which
.96/27 .128/27 .160/27 .192/27 1024
.224/27
Fig. 3. Eexample of NetSCENE, which is an image generated using processed packet header information
The size of the NetSCENE is sufficient if all passing traffic can be represented without any overlapping between the IP addresses of flows. To cope with this,
we employ hash table-based space folding techniques which eliminate the blank in the NetSCENE. It looks up the hash table when the In of the packet comes to the input interface of the hash table. If the In is “not found”, which means that the packet is unobserved within the current time window, it is registered in the corresponding hash table as a new sighting and returns the hash result of In , that is vertical-axis value of the NetSCENE. If In is “found”, then the corresponding vertical-axis value is returned according to the hash table. In this way, the size of the NetSCENE can be reduced considerably and the empty blank in the space is eliminated. Consequently, each packet can be maintained collectively, and each edge can be linked to the local network address by its vertical-axis value.
3.4 Edge detection
the Canny edge detection algorithm, based on the convolution operation of pixels, is the most suitable on the NetSCENE. The Canny edge detection system uses multi-steps consisting of smoothing, stressing, and linking processes. The first step involves smoothing the NetSCENE by convolving with a Gaussian smoothing operator. Since it removes small-scale textures and noises as effectively as possible for a given spatial extent on the NetSCENE, this process can be considered to remove legitimate traffic and noise while preserving the significant traffic patterns. The convolution operation is described in the following equation (1). The Kgus, kernel of a Gaussian operator with a standard deviation of σ = 1.4, is shown in equation (2). After this processing, the edges can be extracted more clearly.
S '(= x, y ) g ( k , l ) ⊗ S ( x, y ) The NetSCENE may help network administrators to N N identify the signs of ongoing attacks intuitively. = g (k , l ) S ( x − k , y − l ) (1) ∑ ∑ However, simply mapping each and every arriving k= −N I= −N packet onto the NetSCENE is not enough. This where, g(k,l) = convolution kernel, S(x,y) = unprocessed approach has the more important limitation that low NetSCENE, S’(x,y) = processed NetSCENE intensity attacks and attacks in the proximity of the dominant legitimate traffic may not be sufficiently 2 4 5 4 2 visible in the NetSCENE. In order to capture only 4 9 12 9 4 significant (i.e., attack) information, it is crucial to 1 extract the attacks from the legtimate background ⋅ 5 12 15 12 5 K= gas (2) 159 traffic. We therefore adopt image processing 4 9 12 9 4 approach for extracting the attacks from the packet 2 4 5 4 2 flow shown in the NetSCENE. In order to extract edges which represent DDoS attacks, we adopt the 1 2 1 Canny edge detection algorithm. There are several (3) Ksobel -x = 0 0 0 edge detection algorithms, such as the Hough −1 −2 −1 transform [11] or the Laplacian method [6]. However,
Unprocessed Image
Fig. 4. Canny edge detection process
Smoothing
Stressing the Edges
Linking
The second step is to approximate the gradient in the x-direction respectively by applying the Sobel operator shown in equation (3). Only the x-direction Sobel operator is used, since we are interested only in the horizontal edges in the NetSCENE. The gradient magnitudes (also known as the edge strengths) can be determined by a convolution operation using the Sobel operator, and a NetSCENE which has strengthened edges results. The strong legitimate traffic that could not be eliminated by the Gaussian smoothing process. On the other hand, some pixels of an edge may be set to zero, since some IP addresses may not be chosen by the zombies. The simplest way to distinguish between these pixels is to implement the linking process. In the NetSCENE, the edge length and location are restricted, because the lower 8 bits of the IP address that can be a network address are several. Also the host IP address range is fixed. This rule is from subnetting and is depicted in Figure 3. Therefore, the pixels which remain until Step 3 can be judged as to whether the edge should be included or eliminated. After processing all these steps, we obtain a processed NetSCENE that includes only the edges.
3.5 Hop count identification
based
source
network
The edges extracted by the Canny edge detection algorithm can identify the attack sources quite accurately. However, there is a possibility that false identification will occur, since the hop count values are not considered in the edge linking step of the edge detection. Note the assumption, defined above, that every route from the attack sources to the victim system is fixed during the timeframe of interest. Hence packets from the same sources have the same Hc. For example of false identification case, some pixels which have different Hc each other can be represented as a single edge in the NetSCENE. We call these edges as weak edges. One way to remove the weak edges could be to check the Hc of pixels. In order to analyze the edge attribute quantitatively, we calculate the edge correlation and the completion degree. The edge correlation is calculated by equation (4-1), and the completion degree of edge by equation (4-2).
Cijn =
Pijn =
(
n {= xij x xij ∈ X , x
})
is a mode
(4-1)
Nijn
(
)
n { xij ∈ X xij = 0} Nijn
(4-2)
where X is the set of the pixels included in the edge Eijn and Nijn is the number of pixels included in the edge Eijn (i and j is the x and y-axis value of pixel which is in the n-th edge). x is the mode value that occurs most frequently in the dataset as the representative value. We set 0.80 as the
correlation threshold. This means that more than 80% of the corresponding packets, which are organizing the edge, should have the same hop count value in order to be a strong edge.
3.6 Signature based pivoted movement Table. 1. Signature according to the packet type. Type
Si
Sm
Di
DDoS attack packet
spoofed IP
real
victim
spoofed IP
real
else
real IP
real
victim
, , ,
real IP
real
else
, , , ,
Signature
legitimate packet
, : false negative ──
To offer a mitigation method with no false positive, we employ the signature based packet filtering method at the source network identified by the edge detection process. The signature of each packet is marked by pivoted movement algorithm. The idea of the pivoted movement algorithm stems from the fact that the attacks quickly “pivot” one or more values of the flow information. In DDoS attacks, the source IP address pivots on the source MAC address and destination IP address. In order to detect the presence of pivoting in the traffic stream, our scheme generates a signature for each outgoing packet at the gateway router of the source network. The signature is simply a tuple consisting of three binary values: source IP address, destination IP address, and source MAC address . Each coordinate value in the signatures tells us whether the corresponding value in the packet was seen “recently” or not. “1” means the value was seen in finite time duration D (e.g., D = 1 sec), while “0” means the value was not seen. For example, when the packet A with source IP = 1.2.3.4, source MAC = A:1:B:2:C:3, and destination IP = 3.4.5.6 appears at time t, and the next captured packet B with source IP = 5.6.5.6, source MAC = A:1:B:2:C:3, and destination IP = 3.4.5.6 appears within time interval D, then the pivoted movement algorithm generates the signature for packet B. This is because source MAC address A:1:B:2:C:3 and destination IP address 3.4.5.6 appear in packet A. But 5.6.5.6 was not used as the source IP address, and therefore Si = “0”. However, if packet C
with source IP = 1.2.3.4, source MAC = A:1:B:2:C:3, and destination IP = 3.4.5.6 appears at a different time interval t’, its signature will be , since a packet data table is reconstructed and has no data. The packet data table for checking the “recently” value reconstructs in every time interval D. Every packet which has new values of is marked with the signature , and it results in a false negative. According to this principle, in which the per-packet signature determines whether the packet constitutes attacks or not, a false positive cannot occur, since legitimate packets cannot be marked with the signature, based on the facts depicted in Table 1. Table. 2 The result of packet filtering based on pivoted movement. The attack packets are marked in red. Legitimate packets cannot have the signature, that is, there is no false positive. However, the attacks packet can have the or signature and they are passed through the filtering module. TIME ──
Src IP (Si) ──
Src MAC (Sm)
Dst IP (Di)
──
──
Result
──
──
D
210.119.57.24
00:24:8c:a7:0d:1e 203.253.146.168
passed
210.119.57.88
00:24:8c:a7:0d:1e 203.253.146.168
filtered
D+2
210.119.57.127 00:24:8c:a7:0d:1e 203.253.146.168
filtered
D+3
210.119.57.127 00:28:ca:a9:75:5d
129.46.224.211
passed
D+4
210.119.57.88
00:24:8c:a7:0d:1e 203.253.146.168
passed
──
──
E
──
──
──
210.119.57.69
00:08:9f:09:55:b5 203.253.146.168
passed
E+1
210.119.57.77
00:24:8c:a7:0d:1e 203.253.146.168
passed
E+2
210.119.57.127 00:1d:a5:44:d7:92
184.155.203.16
passed
E+3
210.119.57.214 00:24:8c:a7:0d:1e 203.253.146.168
filtered
E+4
210.119.57.127 00:1d:a5:44:d7:92
passed
184.155.203.16
And, the simulation settings were: ⋅ Setting A: the window size of the NetSCENE is 1 s and the IPv4 routed /24 topology dataset is used; ⋅ Setting B: the window size of the NetSCENE is 5 s and the IPv4 routed /24 topology dataset is used; ⋅ Setting C: the window size of the NetSCENE is 1 s and the IPv6 topology dataset is used; ⋅ Setting D: the window size of the NetSCENE is 5 s and the IPv6 topology dataset is used.
4.2 Figure of merit Signature
D+1
──
⋅ The number of attack sources (Nas) = 1000, each attack source contains several zombie hosts at a maximum of 10 ⋅ The number of zombie hosts (Nzh) = 4000 ⋅ The number of legitimate sources (Ncl) = 3000 ⋅ The attack traffic rate from one zombie host (Rzh) = 10 to 250 pps ⋅ The hop count value of each attack source = Gaussian distribution (M = 16.5, σ = 4).
4 Experimental results 4.1 Trace and simulation environment We adopt two different network topologies, IPv4 Routed /24 topology dataset [16] and the IPv6 topology dataset [17] from CAIDA, for our simulations. Based on these link datasets, collected on October 6th, 2009, we first chose a router as the victim’s edge router, and then randomly chose multiple distinct routers originating from the victim as the attack sources on each topology. According to the experimental findings of [5], the typical distribution of the number of hops from clients to a server can be regarded as a Gaussian distribution with a mean of 16.5 and a standard deviation σ = 4. In our simulation experiment, we set the hop count between the victim and the sources as the same distribution as for the network topologies and the upper and lower bounds of the hop counts are set to 1 and 32. The summary of the common simulation environment is: ⋅ Topologies = IPv4 routed /24 topology, IPv6 topology from CAIDA
To validate the edge detection results objectively, the NetSCENE can be verified using Pratt’s figure of merit (FM). It returns a number between 0 and 1 based upon the quality of the edge detection, with 1 being the best. In our approach, the FM can be considered as the false negative rate of source identification, since the false positive of identifying legitimate traffic as an attack source can hardly occur. To obtain a false positive result in our approach, at least several dozens of clients which are located in same sub-network would have to access the victim system simultaneously and this behavior would have to be continued for a while. However, this pattern cannot occur in natural behavior. The false negative possibility of FM is computed as PFN − FM =
IA 1 1 ∑ max [ IA, II ] i =1 1 + α di 2
(5)
where IA is the number of detected edges, II is the number of ideal edges, di denotes the distance from i-th actual edge to the corresponding detected edge. In our study, the distance is the number of pixel discrepancies between IA and II. α is a scaling constant set to 1/9 in this study. Figure 5 shows the PFN-FM as a result of edge detection on the NetSCENE. Nas signifies II, which is the number of edges that should be detected on the NetSCENE in every time series. We varied Nas from 5 to 1000 in increments of 5. From the results, it can be seen that the PFN-FM differs greatly according to the ws. The graph of a 1 sec ws is quite low compared to that of a 5 s ws, since the NetSCENE with a 1 sec ws cannot hold a sufficient number of packets. This
means that the attack traffic patterns, the edges, do not appear clearly on the NetSCENE with a 1 sec ws. Setting A
Setting B
Setting C
1.0000
Setting D Avg = 0.9952 Avg = 0.9904
0.9500
PFN-FM
Avg = 0.9117
0.9000
Avg = 0.8633
0.8500
0.8000 0
50 100 150 200 250 300 350 400 450 500 550 600 650 700 750 800 850 900 950 1000
Nas
Fig. 5. Result of PFN-FM vs Nas
generates attack packets from 100 to 250 pps. The simulation results are shown in Figure 6. The false negative ratios are acceptably low for all cases of pivoted movement processing. Through our simulation experiments, we were able to observe that, broadly speaking, a false negative in the pivoted movements often occurs in the sub-networks, which have a long prefix. In addition, there is no false positive in pivoted movement processing, since the legitimate packets from clients cannot have the signature, which should be filtered out as an attack packet. In this simulation, the average rate of egress traffic from one sub-network was 7743.99 pps and of attack packets from one sub-network 724.29 pps.
4.3 False negative in the pivoted movement Pfn-
P PFN − = TL
(6)
To analyze the PFN- in the pivoted movement algorithm, we observed 1000 routers, the attack sources, which are processing the pivoted movement. Each attack source has several zombie hosts, with a maximum of 10, and each zombie host
0.2000
Avg = 0.0057
0.1500
PFN-
In this subsection, we analyze the possibility of false negative results in the pivoted movement algorithm. The proposed scheme incurs no false positives under the assumptions which are defined in section 3.1, since the legitimate traffic cannot have a signature, but only the attack packet. In the pivoted movement algorithm to identify the zombie host, the signatures and can be attack packet signatures and can result in a false negative. The false negative with a signature occurs just one time on each zombie host, since it is possible to identify the zombie hosts by their MAC address and block their packets heading to the victim system. Therefore, the possibility of a false negative caused by a signature is slight. The other possibility of a false negative, caused by the signature , occurs due to the overlapping of IP address choices. The zombie host may choose again the specific address bits within its subnet range. This possibility depends on the network prefix size, since it is according to this that the IP range which a zombie can choose varies. In the 8 bits prefix size, for example, the zombies can choose an IP address from 1 to 254 (0 is the sub-network address and 255 is used for broadcasting in IPv4). If the IP range that zombies can choose is L, the number of the attack packets generated from the zombies is P, and the total packet count generated from the sub-network is T, then the false negative possibility is:
0.1000
0.0500
0.0000 0
50 100 150 200 250 300 350 400 450 500 550 600 650 700 750 800 850 900 950 1000
router-ID
Fig. 6. PFN- of the source routers
4.4 Analysis of attack mitigation delay We define the attack mitigation delay as the time interval between the start time of an attack and the termination time of the mitigation process. The mitigation process is terminated when the DDoS attack sources are no longer detected on the NetSCENE. We first define the following variables: ⋅ ws: The given time window size of packet capturing for the NetSCENE (e.g., 1 sec)
⋅ N(t): The number of identified sources in t-th time slot, where t = 1, 2, . . .,;
⋅ H(i,t): The hop count of the i-th attack sources in t-th time slot, where i = 1, . . ., N(t);
⋅ Ddec(i,t): The detection delay for identifying the i-th
attack sources in t-th time slot with ws time-window size after the attacks have reached the victim system. If attacks from the i-th attack sources arrived at time t–2 and it is identified at t-th time slot, we have Ddec(i,t,ws) =
{t – (t-2)}ⅹws; ⋅ Dpath(i,t): The path delay for sending an instruction from the victim to the source router on i-th source identified in the t-th time slot (including transmission delay, propagation delay, queuing delay, and processing delay on each of routers). The p(j) (e.g., 4.8 ms) is the propagation delay from the (j-1)-th hop router to the j-th hop router. When only the propagation delay is 𝐻(𝑖,𝑡) considered, we have Dpath(i,t) = ∑𝑗=1 𝑝(𝑗);
∑
p ( j ) + Tpre (i, t ) + Tfwd (i, t )
45000 700
40000
600
35000 30000
500
25000
400
20000
300
15000 200
10000
100
5000 0
0 0
50 Time (sec)
1≤i ≤ q
S 1`=S 1 S=i` Si − Sj , when i > 1 1≤ j