SOURCE SEPARATION OF POLYPHONIC MUSIC WITH INTERACTIVE USER-FEEDBACK ON A PIANO ROLL DISPLAY Nicholas J. Bryan CCRMA, Stanford University
[email protected]
Gautham J. Mysore Adobe Research
[email protected]
Ge Wang CCRMA, Stanford University
[email protected]
ABSTRACT The task of separating a single recording of a polyphonic instrument (e.g. piano, guitar, etc.) into distinctive pitch tracks is challenging. One promising class of methods to accomplish this task is based on non-negative matrix factorization (NMF). Such methods, however, are still far from perfect. Distinct pitches from a single instrument have similar timbre, similar note attacks, and contain overlapping harmonics that all make separation difficult. In an attempt to overcome these issues, we use a database of synthesized piano and guitar recordings to learn the harmonic structure of distinct pitches, perform NMF-based separation, and then extend the method to allow an end-user to interactively correct for errors in the output separation estimates by drawing on a piano roll display of the separated tracks. The user-annotations are mapped to linear grouping regularization parameters within a modified NMF-based algorithm and are then used to refine the separation estimates in an iterative manner. For evaluation, a prototype user-interface was built and used to separate several polyphonic guitar and piano recordings. Initial results show that the method of interactive feedback can significantly increase the separation quality and produce high-quality separation results.
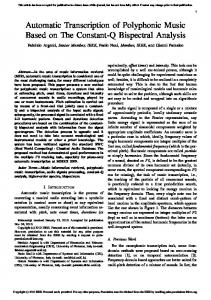
Figure 1: Polyphonic source separation of a single piano recording (blue) of Mary Had A Little Lamb displayed on a piano roll. Given an initial separation, a user can annotate errors (yellow overlays) in the separated outputs (red) and iteratively improve results. Note underneath the overlays, incorrect, residual energy is present. Given a spectrogram V, the matrices W and/or H can then be computed via an optimization problem minimize
D(V | W H)
subject to
W ≥ 0, H ≥ 0
W,H
1. INTRODUCTION For many audio editing and production tasks, it is desirable to separate a single recording of a polyphonic instrument into its respective pitch tracks. One promising method to do so is that of non-negative matrix factorization (NMF), which models audio spectrogram data as a linear combination of prototypical frequency components or basis vectors over time. NMF can be defined by V ≈ WH
(1)
×T F ×K where V ∈ RF is an audio spectrogram, W ∈ R+ + is a dictionary or matrix of basis vectors (columns), and H ∈ RK×T is a matrix of activations or gain vectors (rows). +
Permission to make digital or hard copies of all or part of this work for personal or classroom use is granted without fee provided that copies are not made or distributed for profit or commercial advantage and that copies bear this notice and the full citation on the first page. c 2013 International Society for Music Information Retrieval.
(2)
that minimizes the distance between V and W H, where D is a suitable divergence function (e.g. Euclidean, KullbackLeibler, Itakura-Saito, etc.) and the inequalities are elementwise [5, 6, 10, 11, 14]. Note, (2) is non-convex, typically only allowing us to find a local minimizer to the problem. When used to separate a single polyphonic recording into distinctive pitch tracks (e.g. 88 keys of the piano), typically supervised NMF is used. In this case, isolated recordings of distinct pitches are used to model the prototypical frequency content of each pitch. The pre-learned models are then collected together and used to estimate the contribution of each pitch within an unknown mixture. These methods can sometimes produce high-quality separation results. At the same time, however, these methods can be frustrating in that the resulting separation output estimates can contain errors that are audibly and/or visually obvious. These errors are typically caused by overlapping harmonics, similarities in timbre, similarities in note attack, and other such issues, limiting the general usefulness of the method.
2. LEARNING PITCH MODELS To separate an unknown polyphonic instrument recording, we must first precompute or learn the prototypical frequency content for each pitch p ∈ 1, ..., P we wish to separate. For a given pitch p, we learn one or more (Kp ) prototypical spectra or basis vectors that capture the harmonic structure of that pitch. While this can be achieved by handcrafting specific spectra, we instead learn this from data by the following supervised NMF procedure: 1. Given isolated training data of each pitch p, compute the spectrogram Vp , ∀ p ∈ 1, ..., P via the shorttime Fourier Transform (STFT). 2. Factorize each spectrogram Vp via (2), and obtain F ×K the basis vectors Wp ∈ R+ p of each source, where Kp is the number of basis vectors per pitch. Normalize each column of Wp to sum to one. Discard the activations Hp ∈ RKp ×T .
10 9 8 7
Frequency (kHz)
To overcome these limitations, we propose an extension to supervised NMF-based source separation. In particular, we allow an end-user to separate a single recording into distinctive pitch tracks and then interactively annotate errors in the output estimates by drawing on a piano roll display of the separated tracks, as shown in Fig. 1. The user-annotations are then mapped to linear grouping regularization parameters in a modified NMF-based algorithm to refine the separation estimates and iteratively improve results through user-feedback. To initially train our supervised NMF model, we leverage a database of synthesized pianos and guitars to learn the harmonic structure of distinct pitches. Using the entire database, we learn a universal pitch model across all instruments and timbres. Additionally, we learn instrumentspecific pitch models, and instrument/timbre-specific models that can be used in place of the universal model if needed. For evaluation, we built a prototype user-interface and used it to separate several polyphonic guitar and piano recordings. Initial results shows that the proposed method significantly improves separation quality and can produce highquality separation estimates. The complete proposed method consists of an initial pre-computation step discussed in Section 2, and two core steps in Section 3, and Section 4. Algorithmic issues, evaluation, and related works are discussed in Section 5, Section 6, and Section 7, followed by acknowledgements, and conclusions in Section 9, and Section 8.
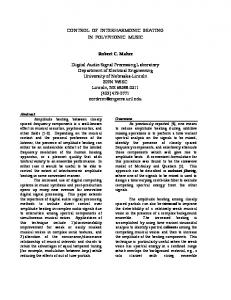
6 5 4 3 2 1 0
Figure 2: One octave of acoustic guitar pitch-based basis vectors for Kp = 1. Notice the harmonic structure. Itakura-Saito divergence. An example set of guitar basis vectors for one octave (Kp = 1) is shown in Fig. 2. For training data, we used 13 distinct piano synthesizers and 11 distinct guitar synthesizers and recorded two measures of quarter notes (≈ 5 seconds) for each of the 88 piano pitches of each of the 24 synthesizers. The different synthesizers have contrasting timbres, reverberation, and other effects and correspond to the guitar and piano presets of the Logic Pro software package. The piano timbres include: electric piano, grand piano, grand piano on stage, grand piano punchy, smokey clav, smooth clav, studio pop piano, swirling electric piano, whirly, yamaha piano club, yamaha piano hall, yamaha piano room, yamaha piano studio. The guitar timbres include: acoustic guitar, big electric lead, classical acoustic, clean electric, crunchy muted delays, electric tremolo, fuzzy synth guitar, heavy metal guitar, los freakos, nylon shimmer, steel string acoustic. Given the collection of recordings, we then use various subsets of the data and the aforementioned supervised NMF procedure several times to compute various pitch models. By learning a pitch model on the complete set of recordings across all instruments and timbres, for example, we learn a form of universal pitch model (U) that generalizes across instruments and instrument timbre, similar in motivation to the work of Reynolds et al. [9] and more recently Sun and Mysore [12]. When using such a model to perform separation, however, the results might be less than ideal because of the difference in harmonic structure between instruments (e.g. guitar vs. piano). This motivates the ability to train more specific pitch models on subsets of our training data. As a result, in addition to computing a general, universal pitch model, we additionally compute a universal guitar model (UG), a universal piano model (UP), and all 24 instrument/timbre-specific models (T).
Student Version of MATLAB
3. MIXTURE SEPARATION 3. Concatenate the basis vectors Wp together to form the complete pitch model or dictionary ×K W = [W1 W2 . . . WP ] ∈ RF , where + PP K = 1 Kp . For this work, we define D to be the Kullback-Leibler (KL) divergence and use the multiplicative NMF-update algorithm of Lee and Seung [6] to solve (2). Note, alternative divergence functions can be used instead, such as the
Given a particular pitch model, we can proceed to separate an unknown polyphonic mixture sound. This involves using a single, complete pitch model W to estimate the weights or activations H of each pitch from the unknown recording spectrogram V. This is done via minimize
D(V | W H)
subject to
H≥0
H
(3)
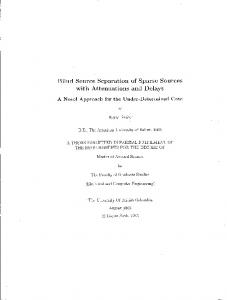
Figure 3: User-annotated penalty weight parameters Λ from Fig. 1, depicted as an image. White represents annotated regions. Black represents unannotated regions. where we only optimize over H ∈ RK×T . Assuming D + is convex, this optimization problem is convex, allowing us to find a global minimizer. We again use the KL divergence (which is convex) and the multiplicative update algorithm of [6] to solve (3), holding W fixed. We then use the given pitch model and corresponding activations to estimate the magnitude spectrogram of each pitch within the mixture. The estimated pitch spectrograms are then converted to the time-domain using the mixture phase and inverse STFT according to standard practice (see Section 5).
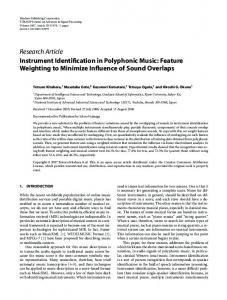
Figure 4: Refined polyphonic separation of Mary Had A Little Lamb with user-guided interactive feedback. Notice incorrectly activated notes are eliminated and the note attacks are more sharply outlined.
Student Version of MATLAB
4. INTERACTIVE USER-FEEDBACK Once an initial separation is performed, we allow an enduser to interactively refine the separated output estimates by annotating a piano roll display of the results. To do so, we 1) instruct an end-user to draw on regions of each pitch track that are incorrectly separated, 2) incorporate the annotations to update the separation estimates, 3) present the updated results back to the user, and 4) repeat until satisfied. This form of interaction is done as a result of the observation that it is much easier for people to iteratively correct for errors after an initial result is presented, rather then pre-annotate time regions of one source or another. This is similar to the observations discussed in [3], where user-feedback is used to improve a clustering algorithm. The specific type of drawing interaction can be done in several ways, such as 1) annotating a type of amplitude envelope for each pitch track, where height is used as a measure of confidence/strength of the error annotation or 2) allowing a user to paint over the errors with a colored brush, where opacity is used as a measure of confidence/strength. The drawing annotations are then collected into a single matrix Λ ∈ RP ×T , where each row corresponds to the penalties for a given pitch. This matrix is then used to penalize the activations of the incorrectly activated pitches from the initial separation estimates. As a result, we can remove errors caused by incorrectly activated notes and reallocate the incorrectly assigned energy to the remaining pitch tracks in an optimal way. This is in contrast to directly using the annotations to down-weight the appropriate elements of H without recomputing the factorization, which would not reassign the incorrectly allocated energy. An example penalty matrix Λ is shown in Fig. 3, which
embodies the user annotations, shown as yellow overlays, in Fig. 1. Note that while Fig. 3 appears binary in nature, Λ is real-valued (the benefit of real-valued annotations is discussed below). The user-annotation matrix Λ is then incorporated into our NMF model via minimize
D(V | W H) + λ Ω(H; Λ)
subject to
H≥0
H
(4)
Ω(H; Λ) is an appropriately chosen penalty that is a function of H and parameterized by Λ and λ ∈ R+ is a scalar used to decrease or increase the overall weight of the user annotation penalty. The penalty function Ω(H; Λ) discourages the activations of specific pitches, dependent on the user-annotations. For our case, we use a simple linear group penalty Ω(H; Λ)
=
pKp
T X P X
X
Λ(p,t) H(k,t) (5)
t=1 p=1 k=(p−1)Kp +1
= 1K T (Γ Λ H) 1T
(6)
where the matrix subscripts are used to index the rows or columns of the given matrices, Γ ∈ RK×P is 1Kp 0 ... 0 0 1Kp . . . 0 Γ= . (7) , .. .. .. . . 0 PP
0
0
1Kp
K = 1 Kp , and 1N ∈ RN ×1 is a column vector of N ones. While alternative penalties are possible, (6) is relatively straightforward, adds minimal computation complexity, and results in a compact multiplicative update algorithm for solving (4) as discussed below in Section 5. Also note, due to linearity, we can absorb λ into the user annotation matrix Λ and only use Λ for user-tuning. We can see the immediate benefit of the interactive userfeedback in two demonstrative examples. First, Fig. 4 illustrates the output result of incorporating the user-annotations
Algorithm 1 Interactive Polyphonic Separation
Student Version of MATLAB
Student Version of MATLAB
Student Version of MATLAB
Student Version of MATLAB
Student Version of MATLAB
Figure 5: (First Row) Mixture spectrogram of E and D piano pitches. (Second Row) Initially separated results (Eleft, D-right) using supervised NMF. (Third Row) Initially separated results (E-left, D-right) using supervised NMF with overlaid annotations (red-line) depicting incorrectly separated note transient (yellow box). (Third Row) The refined separation estimates with the transient error removed. Student Version of MATLAB
Student Version of MATLAB
displayed in Fig. 1, which are used to clean up incorrectly separated regions of each pitch track. We can notice that both the incorrect note activations are removed and the note transients of the remaining (correct) notes are sharpened as a result of reallocating the incorrectly assigned note energy to the remaining pitch tracks. Second, we can view waveform visualizations in Fig. 5, which show the benefit of having the ability to annotate a level of confidence or strength (real-valued annotations) when correcting for errors. In this example, we separate two overlapping piano pitches (E and D). Using standard, supervised NMF-based separation, the energy from the transient attack of the second note gets incorrectly assigned to the first note, causing a ghost-like effect. After annotation (red line), the transient error is reduced and the separation quality is improved. 5. ALGORITHM Using a suitably defined divergence function D(V | W H), our choice of Ω(H), and an appropriate pitch model W, we need to derive an efficient algorithm to actually compute the unknown activations H for each pitch. As before, we define D to be the Kullback-Leibler divergence and follow the mathematical justification of Lee [6] to derive a Majorization-Minimization optimization algorithm to solve (4), resulting in a multiplicative update algorithm that incorporates our user-guided constraints. Given the modified multiplicative NMF update equations, we outline the complete interactive separation algorithm in Algorithm 1. We define the forward and inverse short-time Fourier transform as (V, 6 V) ← STFT(x) and x ← ISTFT(V, 6 V), 1 to be an appropriately sized matrix of ones, is element-wise multiplication, the division
Procedure INTERACTIVE-POLY-SEPARATION ( x, // time-domain mixture signal W, // pitch basis vectors (model) Kp , // basis vectors per pitch ) initialize: Λ = 0 precompute: (V, 6 V) ← STFT(x) repeat input: user-annotated penalties Λ ∈ RP ×T K×T initialize: feasible H ∈ R+ repeat W T ( WVH ) H ← H WT1+ΓΛ
(8)
until convergence for all p ∈ 1, . . . , P do ˆ p ← V W(p) H(p) V WH ˆ p , 6 V) xp ← ISTFT(V
(9) (10)
end for until satisfied return: time-domain signals xp , ∀ p ∈ {1, ..., P }
is element-wise, and use the subscript notation (p) to pick off the elements of W and/or H that correspond to pitch p. At each point within the feedback-loop, the entire NMFbased separation is re-run from scratch, displayed to the user, and used as a starting point for further iterations. 6. RELATED WORK There are several related works that leverage some form of user-guidance to aid the source separation process. One of the most similar works to our proposed approach is discussed in Ozerov et al. [8]. In this work, segmental information indicating the time activations of particular sources is used in a multichannel nonnegative tensor factorization model to improve separation quality. While similar to our proposed work, this work only allows for binary annotations that are used to zero-initialize elements of H and does not allow a user to specify a confidence or strength level. As a result, there is no mechanism to guide the separation process within regions where two or more sources overlap, such as our example of Fig. 5. Other user-guided approaches include the work of Durrieu et al. [4], Lef`evre et al. [7], and Bryan and Mysore [1, 2], which each use some form of time-frequency display to elicit user-annotations. In all such cases, however, the interaction process is limited to separating two sound sources at a time (as oppose to P pitches). In addition, these works require end-users to annotate time-frequency displays of sound, which can be difficult to interpret even for expert users, motivating the proposed approach.
Table 1: Piano results (in dB) averaged across songs, timbre, and active notes. Kp = 1 SDR SIR SAR Kp = 5 SDR SIR SAR
T 12.5 19.7 16.2 T 13.1 19.0 17.0
T+ 13.2 22.9 16.0 T+ 13.3 23.0 16.0
UP 9.4 15.6 15.5 UP 10.5 14.4 17.2
UP+ 11.5 21.0 14.5 UP+ 12.8 22.3 15.5
U 9.8 15.9 15.6 U 10.1 14.2 17.0
U+ 11.6 21.1 14.5 U+ 12.6 22.3 15.4
Table 2: Guitar results (in dB) averaged across songs, timbre, and active notes. Kp = 1 SDR SIR SAR Kp = 5 SDR SIR SAR
T 12.7 19.2 16.2 T 12.8 18.2 17.1
T+ 12.5 22.2 15.3 T+ 12.6 22.4 15.3
UG 8.2 15.0 15.0 UG 9.6 13.5 16.6
UG+ 10.4 20.3 13.7 UG+ 11.5 21.1 14.6
U 7.8 14.5 15.4 U 8.7 12.3 16.6
U+ 10.2 20.1 13.5 U+ 11.2 20.4 14.3
7. EVALUATION We built a C++ prototype user-interface similar to Fig. 1. We then used the interface to test our proposed method on several polyphonic piano and guitar recordings with various pitch models. We generated the test material from five short MIDI files, including “Mary Had A Little Lamb” by Sarah Josepha Hale/Lowell Mason, “The Blue Danube” by Johann Strauss, “Super Mario Bros” by Nintendo Games, “Yesterday” by The Beatles, and “Maple Leaf Rag” by Scott Joplin, using the 24 different synthesizers discussed in Section 2, resulting in 120 different ground truth recordings. For each of the five unique songs, the user-interface was used to initially separate each song into pitch tracks and then interactively refine the outputs over of the course of 30 minutes. The five user-annotations were then saved and used to test the method across the different groundtruth recordings and pitch models. The BSS-EVAL metrics were then used to compute the Signal-to-Distortion ratio (SDR), Signal-to-Interference ratio (SIR), and Signal-to-Artifact ratio (SAR) to measure the separation quality [13]. The SIR measures the level of suppression of the unwanted pitch sources, the SAR measures the level of artifacts introduced by the separation process, and the SDR gives an average measure of separation quality that considers both the suppression of the unwanted sources and level of artifacts compared to ground truth. The results were computed for each instrument before and after user-interaction, averaged across song and timbre, for various pitch models and values of Kp . When evaluating the simultaneous separation of 88 different sound sources, however, the standard approach of comparing all combinations of the estimated sources and known sources becomes computationally prohibitive. As a result, we take the approach of reducing the problem into 88 two-source evaluations that compare the separation quality of each individual pitch p vs. the remaining 87 pitches. In addition, we partition the results for active and inactive pitches
Table 3: Piano results (in dB) averaged across songs, timbre, and inactive notes. Kp = 1 SDR SIR SAR Kp = 5 SDR SIR SAR
T -6.5 -79.2 4.9 T -5.7 -79.6 4.8
T+ 133.9 61.5 90.0 T+ 135.1 62.3 90.7
UP -12.3 -84.6 1.8 UP -11.7 -86.3 0.8
UP+ 134.5 61.7 90.3 UP+ 135.0 62.0 90.6
U -2.3 -74.2 7.3 U -10.9 -86.2 0.8
U+ 135.2 62.1 90.7 U+ 134.7 61.9 90.4
Table 4: Guitar results (in dB) averaged across songs, timbre, and inactive notes. Kp = 1 SDR SIR SAR Kp = 5 SDR SIR SAR
T 1.2 -84.0 7.7 T 2.7 -83.9 7.7
T+ 133.9 59.4 91.4 T+ 135.1 60.1 92.1
UG -7.4 -91.1 4.5 UG -13.0 -99.2 0.0
UG+ 135.5 60.6 92.3 UG+ 134.7 59.8 91.8
U -11.1 -94.6 2.5 U -13.4 -99.4 0.0
U+ 135.3 59.9 92.1 U+ 134.7 59.6 91.8
(completely zero signals), allowing for a more detailed and careful analysis of the results shown below. Without this partitioning, the results are extremely skewed in favor of the proposed method due to averaging the inactive signal results, limiting interpretability. The results for active pitches are shown in Table 1 for piano and Table 2 for guitar. The results for inactive pitches are shown in Table 3 for piano and Table 4 for guitar. The different pitch models include: universal (U), universal guitar (UG), universal piano (UP), and each of the 24 instrument/timbre-specific models (T). Items denoted with a plus (+) indicate user-interaction was used. Note, because of the partitioning of active vs. inactive pitches, comparison of SDR vs. SAR vs. SIR should only be done within like rows. From these results, we have two initial observations. First, we compare the results with and without user-interaction. For active pitches, the SDR and SIR improve by several decibels for almost all pitch models and values of Kp . When using the timbre-based pitch model (T) for a given set of recordings, however, there are cases where user-interaction (T+) slightly decreases the SDR for active pitches. For inactive pitches, the SDR, SAR, and SIR all improve by an extremely large amount (often more than 100 dB) caused by the zero signal pitch tracks in both the estimated and true recordings, motivating our decision to separate the results for inactive and active pitch sets. This shows us that 1) a vast majority of the SDR increase due to userinteraction is caused by simply annotating inactive pitch tracks, 2) while the user-annotations can occasionally decrease the SDR for active pitches, in most cases, userinteraction increases the SDR results for both active and inactive pitches. This is interesting in that it demonstrates the idea that annotating incorrectly activated notes can improve the separation quality of all other pitches on average. Secondly, we can compare the results between the universal pitch model (U), the instrument-specific pitch mod-
els (UG, UP), and the instrument/timbre-specific pitch models (T). We can see that the instrument/timbre-specific pitch models (T) perform the best, followed by the instrumentspecific pitch models (UG, UP), and then the universal pitch model (U) as expected. When we vary the value of Kp and incorporate user-interaction (+), however, this effect is significantly reduced or eliminated. In the case of piano, the universal model with interaction outperformed the timbre-based pitch model without interaction. This is significant in that it gives hope to the use of “universal” pitch models, which eliminates the need for specific training data for particular instruments and timbres. Finally, because it is difficult to evaluate the sound quality of the proposed method via numerical comparison, audio and video examples of our prototype can be found at ccrma.stanford.edu/˜njb/research/pitch. 8. CONCLUSIONS In an attempt to overcome common, frustrating, and limiting problems in supervised non-negative matrix factorization approaches to polyphonic single-channel source separation, we propose an extension that allows a user to correct for errors (with a confidence value) in the separation results by annotating a piano roll visualization of sound. The user-annotations are mapped to linear grouping regularization parameters within a modified NMF-based algorithm, and used to refine the separation estimates and improve results. In addition, a database of piano and guitar recordings was used to learn a generalized pitch model, instrument-specific pitch models, and instrument/timbrespecific models. A prototype user-interface was built and used to separate several polyphonic guitar and piano recordings and initial results show that 1) user-interaction can significantly increase separation quality and 2) make the use of generalized universal pitch models more viable. 9. ACKNOWLEDGEMENTS This work was generously supported by Adobe Research. 10. REFERENCES [1] N. J. Bryan and G. J. Mysore. An efficient posterior regularized latent variable model for interactive sound source separation. In International Conference on Machine Learning, June 2013. [2] N. J. Bryan and G. J. Mysore. Interactive refinement of supervised and semi-supervised sound source separation estimates. In IEEE International Conference on Acoustics, Speech, and Signal Processing, May 2013. [3] D. Cohn, R. Caruana, and A. Mccallum. Semisupervised clustering with user feedback. In Sugato Basu, Ian Davidson, and Kiri Wagstaff, editors, Constrained Clustering: Advances in Algorithms, Theory, and Applications. Chapman & Hall/CRC, 2008. [4] J.-L. Durrieu and J.-P. Thiran. Musical audio source separation based on user-selected f0 track. In The 10th
International Conference on Latent Variable Analysis and Signal Separation (LVA/ICA), pages 438–445, 2012. [5] C. F´evotte and J. Idier. Algorithms for nonnegative matrix factorization with the β-divergence. Neural Computation, 23(9):2421–2456, 2011. [6] D. D. Lee and H. S. Seung. Algorithms for nonnegative matrix factorization. In Advances in Neural Information Processing Systems (NIPS), pages 556– 562. MIT Press, 2001. [7] A. Lef`evre, F. Bach, and C. F´evotte. Semi-supervised nmf with time-frequency annotations for singlechannel source separation. In In the Proceedings of The International Society for Music Information Retrieval (ISMIR) Conference, 2012. [8] A. Ozerov, C. F´evotte, R. Blouet, and J.-L. Durrieu. Multichannel nonnegative tensor factorization with structured constraints for user-guided audio source separation. In IEEE International Conference on Acoustics, Speech and Signal Processing (ICASSP), pages 257 –260, May 2011. [9] D. A. Reynolds, T. F. Quatieri, and R. B. Dunn. Speaker verification using adapted gaussian mixture models. In Digital Signal Processing, page 2000, 2000. [10] P. Smaragdis and J.C. Brown. Non-negative matrix factorization for polyphonic music transcription. In IEEE Workshop on Applications of Signal Processing to Audio and Acoustics (WASPAA), pages 177 – 180, Oct. 2003. [11] P. Smaragdis, B. Raj, and M. Shashanka. Supervised and semi-supervised separation of sounds from singlechannel mixtures. In International Conference on Independent Component Analysis and Signal Separation, pages 414–421, Berlin, Heidelberg, 2007. SpringerVerlag. [12] D. L. Sun and G. J. Mysore. Universal speech models for speaker independent single channel source separation. Proceedings of the International Conference on Acoustics, Speech, and Signal Processing (ICASSP), 2013. [13] E. Vincent, R. Gribonval, and C. Fevotte. Performance measurement in blind audio source separation. IEEE Transactions on Audio, Speech, and Language Processing, 14(4):1462 –1469, July 2006. [14] T. Virtanen. Monaural Sound Source Separation by Nonnegative Matrix Factorization With Temporal Continuity and Sparseness Criteria. IEEE Transactions on Audio, Speech and Language Processing (TASLP), 15(3):1066–1074, March 2007.