Sources of Errors in Distributed Development Projects: Implications for Collaborative Tools Marcelo Cataldo Robert Bosch LLC Research and Technology Center Pittsburgh, PA 15201, USA
[email protected] ABSTRACT
project cycle time, efficiency of the development process and product quality [e.g. 2, 16, 21, 47]. The latter, product quality, has received increased attention in the last two decades because of its crucial role in influencing a firm’s competitiveness [16, 47]. Although quality is a multidimensional concept [26], focusing on quality as “conformance to design specifications’ is of particular interest because it speaks directly to the ability of the development organization to perform the multitude of required tasks, coordinate and integrate them effectively. Failures in coordination and integration of tasks and their outcomes are a major source of errors and mistakes [19, 23, 37].
An important dimension of success in development projects is the quality of the new product. Researchers have primarily concentrated on developing and evaluating processes to reduce errors and mistakes and, consequently, achieve higher levels of quality. However, little attention has been given to other factors that have a significant impact on enabling development organizations carry the numerous development activities with minimal errors. In this paper, we examined the relative role of multiple sources of errors such as experience, geographic distribution, technical properties of the product and projects’ time pressure. Our empirical analyses of 209 development projects showed that all four categories of sources of errors are quite relevant. We discussed those results in terms of their implications for improving collaborative tools to support distributed development projects.
Past research has concentrated on processes and process improvement activities as the primary approach to reduce errors and improve product quality [16, 42, 51]. Little attention has been given to other organizational, technical and project-level forces that also play a critical role. For instance, scheduling of development tasks can create coordination needs unlikely to be satisfied by the development organization, consequently, increasing the likelihood or errors and mistakes [29, 37, 49]. On the technical dimension, recent work has suggested that architectural properties of the product under development impose coordination needs on the development organization that are difficult to identify and tend to results in errors [15]. Finally, organizational factors such as lack of experience in the product and lack of experience working together have important detrimental impact on development quality [17, 18, 25]. In the context of distributed projects, the impact of those organizational, technical and project-level factors is augmented by the cultural, physical, and time barriers introduce by geographic dispersion as well [12, 38, 41]. Collaborative tools could play an important role in such settings. However, they require a framework to effectively identify the organizational, technical and project-level factors that represent critical sources of errors in development projects.
Author Keywords
Distributed Development, Errors, Collaborative Tools, Dependencies, Experience, Concurrent Engineering. ACM Classification Keywords
H.5.3. Group and Organizational Interfaces: Computersupported Collaborative Work, Organizational Design. D.2.9. Management: Programming Teams. General Terms
Human Factors, Management, Measurement. INTRODUCTION
Product development projects involve numerous activities that require a well coordinated effort from multiple organizational actors or units in order to be successful [50]. The product development literature has considered “success” of a product development project across a wide range of conceptualizations such as market performance of the product,
This paper examines the relative impact of organizational, technical and project-level factors on errors in distributed development. We use data from 209 software development projects from a large multi-national product development organization distributed across 15 development locations in Europe, India and Japan. The implications of the results on the design of collaborative tools are discussed.
Permission to make digital or hard copies of all or part of this work for personal or classroom use is granted without fee provided that copies are not made or distributed for profit or commercial advantage and that copies bear this notice and the full citation on the first page. To copy otherwise, or republish, to post on servers or to redistribute to lists, requires prior specific permission and/or a fee. CSCW 2010, February 6-10, 2010, Savannah, Georgia, USA. Copyright 2010 ACM 978-1-60558-795-0/10/02...$10.00.
281
SOURCES OF ERRORS IN DISTRIBUTED PRODUCT DEVELOPMENT PROJECTS
tional dispersion, uneven distribution of team or project members across locations, increases conflict and decreases awareness which in term increase the likelihood of coordination breakdowns and errors [30, 31].
The primary focus of the research on quality in product development organization has been on examining the drivers and barriers to achieve maturity in the development processes utilized by product development organizations. The more mature development processes are, the better the quality of the development outcome [29, 47, 50]. However, past research suggests that other factors may also play a critical role in increasing occurrence of errors and, consequently, negatively impacting product quality [3, 12, 15, 16, 17, 30, 37, 40, 47, 49]. Individual-level experience, either technical or domain-specific, has been found to be an important source of errors, particularly, in the development of complex systems [3, 16, 17, 18]. Another relevant dimension of experience is familiarity in working together with other team members which has been found to improve development productivity by facilitating information sharing and coordination [7, 27]. Laboratory experiments have shown that familiarity also reduces errors in assembly tasks [36], however, no research work has examined the role that this particular factor has on development quality.
Factors associated with the technical properties of the system under development are also important source of errors. Two traditional sources of error are the size (e.g. number of constituent parts of the system) and the complexity of the system to design and developed [6, 16, 26, 29]. The higher the complexity of the product, the more dependencies exist among the components of the product, increasing the likelihood of errors and, consequently, detrimentally impacting quality [15, 16, 29]. Recent work has also suggested that nature of the connectivity among product components (e.g. directionality or clustering) are important factors impacting the flow of information between development teams [48] and, ultimately, the quality of the product [15, 53]. Finally, time pressure in a development project has significant implications on quality [47]. There are two aspects to time pressure in a project. Within the context of a particular task, high levels of time pressure lead individuals to seek and process less available information and reduce their range of decision alternatives [34] which might result in an increase in errors and poorer product quality. A second aspect of time pressure is the increase in the need for concurrent development tasks and the implications on coordination needs among the individuals performing those tasks. If concurrent tasks are completely independent no particular coordination requirements exist. However, if those concurrent tasks are interdependent, appropriate coordination mechanisms are required [29, 37, 49]. However, those coordination mechanisms might not be sufficient to manage the complexity associated with interdependent concurrent tasks under high levels of uncertainty [37, 49]. In such conditions, errors and mistakes are highly likely, impacting negatively on the quality of the product under development.
The ability of the organizational members or entities to share and integrate information is another critical factor in development organizations [1, 2, 16, 30, 38], in particularly, in relation to product quality [16, 26, 47]. Distributed development organizations face significant challenges in terms of information sharing and integration because of the detrimental effects of distance. Moreover, the various dimensions of geographic dispersion have a differentiating and additive effect on the ability of the distributed development organizations to effectively communicate, coordinate and share information [40], and consequently, on the quality of the developed products [12]. O’Leary & Cummings [40] proposed three dimensions of geographic dispersion: spatial, temporal and configurational dispersion. Spatial dispersion reduces spontaneous communication which in turns reduces the ability of project members to be aware of other people’s activities, decisions and difficulties, resulting in coordination breakdowns and, ultimately, impacting the quality of the system under development [19, 27]. Temporal dispersion reduces the possibilities for realtime problem solving activities stemming from the reduced possibilities for synchronous interaction [28, 40]. In addition, temporal dispersion increases the likelihood of misunderstandings and mistakes because of the complexity associated with adequate management of the flow of information in asynchronous communication [14, 24]. Configurational dispersion refers to two distinct aspects of distribution: number of sites or locations involved in a project and uneven distribution of project members across those locations [40]. Increasing the number of sites, increases the coordination effort required in the project [30]. Moreover, increasing the number of sites also increases the likelihood of multiple countries being involved in a project, adding another layer of complexity in terms of cultural and organizational boundaries [5, 11]. The second aspect of configura-
The previous paragraphs discussed four categories of factors that represent important sources of errors in distributed development: types of experience, dimensions of geographic dispersion, technical properties of the product and a project’s time pressure. Then, the goal of this paper is to address the following research question: RQ1: What is the relative impact of the each of the four categories of factors on product quality? RESEARCH SETTING
In order to address the research question outlined in the previous section, we collected data from a multi-national company that produces complex embedded systems for the automotive industry. The products consist of a combination of physical elements (hardware) that are managed by a large and complex software component. The organization responsible for the hardware elements was located in a single development center whereas the organization responsible for the software was significantly larger in size and it
282
was highly distributed. We focused our analyses on the software organization for three reasons. First, the organization responsible for developing hardware components was not distributed while the software organization was highly distributed making it more suitable for our research question. Second, each generation of the product involves the development of a single hardware system and, in certain cases, with minimal changes from the previous generation. On the other hand, the software system undergoes significant changes in each generation which requires major development efforts throughout the life cycle of the product generation, typically 4-6 years. Finally, the data repositories utilized during development provide a very rich history of development activities over extended periods of time. We were only able to access the data repositories from the software development organization.
and fixing of module-level test related defects. In the integration and system testing, the second phase, the software developed in the main implementation phase is integrated by the appropriate department and integration and system level tests are performed. The outcome of the integration and system test phase is a complete and functional software system. Therefore, the number of defect encountered in this second phase of the development process is a very good representation of the overall quality of the product. Post customer-release failures were not an appropriate measure of quality because they seldom occur. Such type of defects would result in product recalls. Then, a significant amount of effort was spent in the integration and system testing activities to guarantee “zero-defects” once the product is delivered to the customer. Measures for Experience
The software organization used a product line approach for developing their products. In such a setting, a base version of all the architectural components of the software system is developed. Once integrated, those components constitute a platform. Customer projects analyze requirements of a particular customer, determine if the platform needs to be modified and implement those necessary changes in collaboration with the engineers that developed the platform. Our data covered all development activities between 2003 and 2008 corresponding to the latest generation of the product. The software development organization had a maximum of 2331 developers during the time covered by our data and those engineers were distributed in 15 development centers located in Europe, India and Japan. Our unit of analysis is the software development project and, for the latest generation of the product, we identified 209 projects that were completed during the timeframe covered by our data. For each project, we had access to two historical data repositories. The modification request (MR) repository contained information about all development tasks including data such as who worked on the task, from which location, when the task was started and finished. The second repository was the version control system that contained all the changes to the software source code as well as association data linking the changes to the software source code with the modification request data.
Our measures of experience built on the approaches used by Boh and colleagues [7] and Espinosa and colleagues [25] that utilized modification request data as the basis for experience. Prior experience on the product was measured in two different ways. Average MR Experience captures the average number of MR that the project members worked on prior to the focal project. Average Component Experience captures the average number of times that the project members modified the components that need to be changed in the focal project prior to the beginning of the focal project. Experience working with other project members, captured by the Average Shared Experience variable, was measured as the number of MRs where both persons in each dyad in a project worked together, averaged across all dyads. Measures for Geographic Dispersion
We used the measures of spatial and temporal dispersion proposed by O’Leary and Cumming [40]. The data regarding locations and number of developers per location was extracted from the modification requests reports associated with each project. For each pair of locations, we determined the Euclidean distance to calculate Spatial Distribution measure and the difference in time zones in order to calculate the Temporal Distribution measure. The third dimension of distribution, configurational dispersion was assessed also using O’Leary and Cumming’s [40] measures. The People Dispersion measure captures uneven distributions of project members across locations based on a standard deviation approach. Two additional measures of configurational dispersion were collected. These were the Number of Locations and the Number of Regional Units that were involved in a project. Unlike the Number of Locations measure, the Number of Regional Units captures more precisely the impact of major organizational barriers for distributed work manifested in difference across development processes, individual and team-level goals, managerial philosophies and labor-related policies and laws.
Measures
The following paragraphs describe the various measures used in our empirical analyses. We build, primarily, on measures that can be computed automatically from historical data available in development projects and that have been previously evaluated in empirical studies. Outcome Variable
Our dependent variable was measured as the number of defects reported during the integration and system testing phase of each project. The development organization followed a development process that consisted of two phases. The main implementation phase involved requirements engineering, design, implementation, module-level testing
Measures for Technical Dependencies
Interfaces among components of a software system are an important source of defects [15, 32, 46, 53]. The develop-
283
ment organization kept architectural description files in the version control system. Those files were used to generate the interfaces among the different components of the software system. We use the information in such files to collect measures of technical dependencies. A project defines a technical boundary between those components that are modified as part of the project and those that are not. Design and implementation decisions made in a project can impact the functioning of components that were not modified as part of the project, which could result in poorer product quality. Two measures we computed. The In-flow Technical Dependencies measure refers to the number of interfaces that components modified in the project use from components that are not modified in the project but that are part of the final system. The Out-flow Technical Dependencies measure refers to the interfaces exported by components that are modified in the project and used by components not changed in the project but are part of the final system.
A third important factor that leads to quality problems is the complexity of the product [29]. Two measures are traditionally used: a subjective evaluation of complexity based on the assessment of experts [29, 48] or an objective evaluation based on the number of relationships among components of the system [32, 46]. Unfortunately, all the projects in our dataset are based on the same product so the traditional measures of complexity would not vary across projects. Therefore, Complexity of the product was measured as the ratio between the number of technical dependencies of the system that are associated with the components of the product modified by the project over the total number of technical dependencies of the system. Past research in software engineering has suggested additional factors associated with quality [e.g. 8]. Therefore, for each project, we also collected the Number of Modification Requests, the number of those MRs that were related to new features to be implemented in the product (Number of New Features variable) and the Number of Developers that participated in the tasks associated with each project.
Measures for Project Time Pressure
Time pressure has important implications on product development projects, particularly, in terms of product quality [16, 39, 47]. A traditional measure of time pressure is the relationship between planned and customer requested delivery date [39]. In our research setting, planned delivery dates are always defined as the same as the customer requested delivery dates. Then, the projects managed such a constraint by increasing the overlap among development tasks and allocating more resources, particularly, if delays took place. Then, considering the number of overlapping activities over the life of the project provides an appropriate representation of the project’s time pressure pattern. Utilizing the data from the modification requests associated with each project, we computed the Tasks Temporal Execution as the standard deviation of the number of tasks completed in each month. High values are associated with uneven distributions which in term suggest time pressure in those months with a high number of tasks to be completed.
Model
Our dependent variable, Number of Defects, is a count variable. Although, count variables could be treated as continuous variables and then used in linear regression models, the obtained estimates could be inefficient, inconsistent and biased. The Poisson regression model is a basic model for count outcomes. However, the Poisson regression model has the assumption that the conditional mean of the outcome variable is equal to the conditional variance. Our dependent variable has a variance several orders of magnitude larger than its mean (see Table 1). Then, a Negative Binomial regression model would be more appropriate. RESULTS
This section presents the results of our empirical analyses. We first present a series of preliminary analyses performed on our data followed by a discussion of the various models that examined the role of the multiple factors on product quality.
Control Measures
We computed a number of control variables based on the statistical model of software project quality proposed by Harter and colleagues [29]. Each modification request consisted in one or more transactions in the version control system that impacted one or more files associated with a particular software component. From those transactions in the version control system, we collected the Size measure that consists of the sum of the number of lines of source code added, deleted or modified as part of the development activities of the project. The variable Process Maturity captures the level of discipline and sophistication of the development organization and the supporting processes. The measure was computed as the average of the SEI CMM level, as assessed in 2007, of the locations that were part of the development activities of each project.
Preliminary Analysis
Table 1 summarizes the descriptive statistics of all our measures. Several variables were log-transformed given their skewed distributions. We performed a variance inflation factors (VIF) analysis to examine multicollinearity issues. In such analysis, a tolerance value of around 1 indicates little multicollinearity, whereas a value close to 0 suggests significant threats from multicollinearity. The variance inflation factor (VIF) is defined as the reciprocal of the tolerance. VIF values above 10 are considered high collinearity while values above 5 should also be considered with care [36]. Table 2 reports the results of the VIF analyses. In the first model, we included all the independent variables. Model II discarded the measures with the four largest VIF values. It is worth mentioning that both spatial and temporal dispersion have large VIFs mainly due to
284
Variable 1. No. of Defects 2. Size 3. Process Maturity 4. Complexity 5. Avg. MR Experience 6. Avg. Component Experience 7. Avg. Shared Experience 8. In-flow Technical Dep. 9. Out-flow Technical Dep. 10. No. Development Tasks 11. No. New Features 12. No. of Developers 13. Spatial Distribution 14. Temporal Distribution 15. No. of Locations 16. No. of Regional Units 17. People Dispersion 18. Tasks Temporal Execution
Mean 16.17 223037 3.66 0.028 820.66 342.46 0.011 80.55 127.06 117.48 32.74 24.15 2147.75 1.31 2.67 1.82 4.70 3.17
Std. Dev. 64.43 667299 0.84 0.047 690.88 295.48 0.038 81.41 107.61 371.70 137.72 42.23 1949.56 1.21 1.46 0.71 8.14 4.62
Minimum 0 523 2 0 0 0 0 0 0 6 1 1 0 0 1 1 0 0.21
Maximum 716 3587812 5 0.239 3233.9 1532.5 0.463 264 354 3840 889 380 7395 4.50 8 4 56.47 37.94
Skewness 8.13 7.47 -0.235 2.25 1.95 1.08 8.59 1.68 1.38 7.51 9.49 4.75 0.49 0.47 0.92 0.42 3.28 4.04
Kurtosis 78.33 70.89 2.59 8.11 4.42 4.94 94.85 7.09 5.82 66.58 104.02 33.96 2.61 2.48 3.17 2.59 17.36 25.25
Table 1: Descriptive Statistics
being highly correlated among them. Hence, we removed only the spatial dispersion measure. In model II, we observe that three variables still have VIF values above 5. Model III shows the set of measures that were included in the regression models discussed in the following paragraphs. A pairwise correlation analysis among those remaining measures showed that the highest correlations were 0.418 and 0.387 between Size and Out-flow and In-flow Technical Dependencies, respectively.
Model II in table 3 reports the IRRs of both experience measures, Average MR Experience and Average Shared Experience. Both factors are statistically significant and their IRRs are below 1 indicating that increases in the experience measures are associated with decreases in the number of errors. Then and as expected, higher levels of experience across the project members are associated with increases in the quality of the product. Moreover, the more shared experience of working together is accumulated across the project members, the lower the errors introduced during development, hence, the higher the quality of the product.
Factors Impacting Quality
We constructed several regression models to examine the relative impact of each class of independent variable on product quality. We followed a traditional hierarchical modeling approach where each statistical model adds a particular factor of interest. Then, we started our analysis with a baseline model that contained only the control factors and added the various independent measures in subsequent models. Table 3 reports the incident rate ratios (IRR) from the various Negative Binomial regression models. IRRs are defined as the exponentials of the regression coefficients and they indicate the change in the estimated counts of the outcome variable for a unit increase in the independent variable holding the other variables constant. An IRR higher or equal to one indicates a positive relationship between dependent and independent measures. On the other hand, an IRR lower than 1 indicates that increases in the independent variable are associated with decreases in the dependent variable. Model I is a baseline model that consist of the control factors based on the model of software quality proposed by Harter and colleagues [29]. Our findings are consistent with previously reported results. Projects developing larger and more complex systems (IRRs higher than 1) are more likely to exhibit higher number of defects. However and as expected, higher levels of process maturity (IRR lower than 1) increase the quality of the product.
Model III introduces the technical dependencies measures. The results indicate that only Out-flow Technical Dependencies is statistically significant. Higher numbers of outflow dependencies are associated with poorer quality (IRR larger than one). The Out-flow and In-flow Technical Dependencies measures examine those product relationships from the perspective of the project as a producer (Out-flow) and consumer (In-flow) of services, respectively. Then, the results suggests that design and implementation decisions made in the project are changing the assumptions made by the developers of the components that our outside the scope of the project but consume those services. Then, these results highlight a complex relationship between the technical dimension defined by the properties of the product and the social and organizational dimensions defined by the projects and the development organization as a whole. Model IV examines the impact of the various measures of geographic dispersion. Number of Locations and People Dispersion are both statistically significant and their impact is in the expected direction. The higher the number of locations involved in a project and the more uneven the distribution of engineers is across those locations, the lower is the product quality. In addition, the impact of uneven
285
Independent Variable
Size (log) Process Maturity Complexity (log) Avg. MR Experience (log) Avg. Component Experience (log) Avg. Shared Experience (log) In-flow Technical Dep. (log) Out-flow Technical Dep. (log) No. Modification Requests (log) No. New Features (log) No. of Developers (log) Spatial Distribution Temporal Distribution No. of Locations No. of Regional Units People Dispersion (log) Tasks Temporal Execution (log)
Model I VIF (Tolerance)
Model II VIF (Tolerance)
Model III VIF (Tolerance)
2.78 (0.3602) 1.26 (0.7945) 4.85 (0.2061) 20.31 (0.0492) 20.39 (0.0490) 1.26 (0.7947) 6.89 (0.1451) 6.30 (0.1587) 23.40 (0.0427) 7.69 (0.1300) 21.64 (0.1451) 150.05 (0.0067) 145.15 (0.0069) 4.49 (0.2228) 10.84 (0.0923) 5.27 (0.1898) 4.79 (0.2087)
2.67 (0.3743) 1.23 (0.8101) 4.42 (0.2263) 1.21 (0.8287) -1.08 (0.9277) 5.79 (0.1727) 5.84 (0.1711) -7.42 (0.1348) 15.15 (0.0660) -2.29 (0.4369) 4.24 (0.2356) 10.63 (0.0941) 5.15 (0.1943) 4.27 (0.2326)
2.66 (0.3753) 1.17 (0.8575) 4.30 (0.2324) 1.17 (0.8568) -1.05 (0.9529) 4.84 (0.2101) 4.77 (0.2187) ----1.35 (0.7412) 3.03 (0.3302) 4.49 (0.2291) 3.87 (0.2934)
Table 2: Collinearity Diagnostics
distributions of engineers is significantly higher than the impact of increasing the number of locations (IRR of 2.504 versus 1.444, respectively). It is worth noticing that the People Dispersion measure is impacted if people perform development activities in different locations. We identified 317 developers (out of 2331) that made changes to the software source code from different locations. However, only 49 developers from those 317 made changes from different locations within the same project. We computed the measure in different ways such as considering only one of the locations where the engineer worked or considering all of them as part of a sensitivity analysis. The impact of People Dispersion was consistent across all measurement approaches. The results reported in table 3 are based on considering only the home location of the developer that participated in the projects. The impact of Temporal Distribution was marginally significant, contrary to our expectations. One possible explanation could be associated with the nature of the development tasks was such that they would not benefit much from synchronous communication, one process underlying the impact of Temporal Distribution [40]. We did not have access to sufficiently detailed data to examine the characteristics of each development task. In sum, our results bring to light a more complex relationship between distribution and product quality relative to past research in software development which has focused on a simple conceptualization of distribution such as a dichotomous notion [e.g. 27] or as the number of sites [e.g. 30].
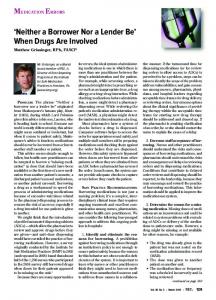
velopment tasks close to or around major milestones or releases [9]. We investigated if such situation was the source of the uneven distributions of tasks. Figure 1 shows a heat-map representation of the raw data use to compute the Tasks Temporal Execution measure across the 100 projects with the highest value of the measure. The vertical access represents the projects order by the value of the measure (higher values at the top) and the horizontal axis represents the project duration on a monthly basis. The color of each cell represents the number of tasks completed in each month. The darker the color, the higher is the number of tasks completed in that particular month. Overall, projects with high values of the Tasks Temporal Execution measure have high levels of concurrent task in multiple times over the duration of the project. This suggests that uneven distributions are not a product of high concentration of tasks around the end of the implementation phase (right hand-side of the figure). Despite the value of using incidence rate ratios for interpreting the results, it is worth noticing that IRRs are dependent on the scale of the independent measure. Then, considering just the IRRs as a way to comparing the relative impact of the sources of various sources of errors on product quality is not appropriate. Therefore, we also calculated the discrete change of the expected number of defects for a range of values of each statistically significant factor. We considered the [minimum, maximum] interval of each independent variable while maintaining the other variables fixed at the mean. In this way, we can get a better sense of impact of each particular factor by understanding the changes in quality for the full range of variation of each independent factor. Our results showed that the factor with the highest impact was Tasks Temporal Execution where a change from the minimum value to the maximum one resulted in an increase in the expected number of defects of 47.1%. The
Model V examines the role on the temporal execution of task as a dimension of time pressure. Our results show that Tasks Temporal Execution has a statistically significant impact on product quality. More uneven distributions of task execution over the duration of the project are associated with poorer levels of quality. A common situation in software projects is a significant increase in completed de-
286
Size (log) Process Maturity Complexity (log) Avg. MR Experience (log) Avg. Shared Experience (log) In-flow Technical Dep. (log) Out-flow Technical Dep. (log) Temporal Distribution No. of Locations People Dispersion (log) Tasks Temporal Execution (log) Model Chi2 Deviance Explained Model Comparison (p-value)
Model I 1.536** 0.987+ 2.234*
Model II 1.554** 0.979+ 5.722* 0.832* 0.910*
183.82 27.1% --
194.64 35.4% 10.82 (p < 0.01)
Model III 1.419** 0.955+ 4.781** 0.855* 0.891* 0.991 1.206**
212.76 43.9% 18.12 (p < 0.01)
Model IV 1.218** 0.981+ 5.113* 0.845* 0.889* 0.810 1.402** 1.221+ 1.444** 2.504* 240.95 56.3% 28.19 (p < 0.01)
Model V 1.246** 0.949+ 4.459* 0.897* 0.861* 0.823 1.249** 1.224+ 1.331** 1.974* 2.347** 259.4 62.8% 18.50 (p < 0.01)
(+ p < 0.1, * p < 0.05, ** p < 0.01)
Table 3: Incident Rate Ratios from Negative Binomial Regressions
other factors had the following interval change percentages: People Dispersion = 45.2%, Number of Locations = 35.7%, flow Technical Dependencies = 28.3%, Temporal Distribution = 19.2%, Out- Shared Experience = -1.4%, and MR Experience = -29.2%. The measures of experience have a negative percentage values because higher levels of experience are associated with a reduction in the expected number of defects.
tors. Our analyses of 209 software development projects in a large multination organization showed that two factors, time pressure (measured as concurrent execution of tasks) and uneven distribution of engineers across locations, were the two most significant sources of errors. A less significant but still quite important set of factors impacting quality include the number of locations involved in a project, the technical experience of the project members and the number of technical dependencies that cross project boundaries. Our results provide additional contributions to the CSCW literature. Current research work on awareness of technical dependencies focuses primarily on the particular piece of software, organizational unit or work item [e.g. 45]. The impact of technical dependencies that cross the boundaries of projects (Out-Flow dependency measure) reported in our study highlight the importance of considering coordination and awareness beyond the traditional small organizational entity such as a team and provide support at a larger scale within the development organization. Another contribution relates to role of time pressure on project quality. Concurrent execution of tasks was the most significant source of errors in our research setting. Past CSCW research, particularly in the context of tools, has not considered project time pressure in combination with other factors such as technical dependencies and dimensions of distribution. Inter-relating those three pieces of information can significantly improve the awareness and coordination capabilities of collaborative tools. Information about the levels of concurrency in the development tasks and their distribution over the project’s life cycle contextualizes additional relevant information such as technical and work dependencies among those concurrent tasks as well as the geographic distribution of the engineers involved in concurrent and interdependent tasks. Then, considering those three factors together could help collaborative tools disentangle the complex web of evolving coordination needs that impact engineering work.
Figure 1: Amount of Tasks Completed over the Duration of the Projects on a Monthly Basis DISCUSSION
Past research has examined the impact on product development of factors such as experience [e.g. 7, 17], dimensions of geographic dispersion [e.g. 12], technical dependencies [e.g. 15, 48] and time pressure [e.g. 37, 49]. The work reported in this paper extends such past research by considering the relative significance of each of those fac-
287
Limitations
Supporting Coordination and Awareness in Large-Scale Development Organizations
Our study has several limitations worth highlighting. First, we were not able to collect interaction and coordination data which would have allowed us to assess more accurately the ability of the development organization to share and integrate information. We interviewed 11 members of the development organization to get some insights on the general interaction and coordination patterns used in the organization. The interviewees indicated that it was common practice to have periodic (e.g. once a week) status meeting. Email and telephone conversations were the most common information sharing mechanisms. All members of the development organization had access to the modification request tracking system, version control system and widerange of wikis with product information. The use of instant messaging type of tools was not allowed.
Team-centric tools and development environments [10, 33, 43] represent an important step forward in facilitating communication and coordination in distributed development. However, such tools focus their attention, primarily, at a single organizational unit (e.g. a team or a location) and their communication and coordination support, mainly, resides around single-person work items or artifacts and their evolution over the life cycle of a project. Our results highlight the need to provide support for communication, coordination and awareness in a more comprehensive, project- and organization-wide level. Then, development environments tools could utilize our measures computed from project data repositories to address such a need. For instance, information regarding the estimated or actual start and end of a task represents the basis for our measure of concurrent execution of tasks. Such information can be visualized using different approaches to improve awareness of outstanding and upcoming tasks as suggested by recent tools [22]. A more novel direction in tool design involves combining the concurrent task execution measure with two other important groups of information. First, knowing about the teams, locations and even the individuals associated with those tasks allows the computation of the experience and distribution measures used in our analyses. Second, the technical dependencies among the constituent components of a system can be brought into the picture when tasks contain information about the different parts of a system affected by the task. Then, the concurrent task execution measure allows a tool to contextualize all the other pieces of information and identify particular patterns that would benefit from distinct coordination and awareness capabilities. Tools can, then, dynamically assess and adjust their support to the relevant parties. Examples of patterns of interest are uneven distributions and high level of task concurrency, which are detrimental to product quality as our analyses demonstrated, as well as concurrent tasks that are highly interdependent from a technical point of view or that involved a highly distributed set of engineers or a set of engineers with experiences levels that are not optimal.
Second, our measures of experience are based on the development activity of the 209 projects associated with the last generation of the product. Development activities from previous generations of the product overlap with the current generation, typically, for 1 to 2 years. In such setting, developers might have to work on projects from two different product generations. We were not able to access data repositories from the previous generations. Therefore, our measures of experience might not be reliable for the period where the development of the previous and latest generations overlapped. We replicated the analyses reported in table 3 considering only those projects started after 2005 (187 projects) and after 2006 (161 projects). The results were consistent with those reported in table 3. In addition, we varied the starting point for computing experience in those two subsets of projects. Thirdly, in our research setting, a developer might have to work in multiple projects concurrently. Such a situation raises some concerns regarding the reported results due to potentially inadequate measures and statistical modeling. The development organization had 2331 developers and 1773 of those developers worked in multiple projects. However, only 207 developers worked concurrently in multiple projects. Those 207 developers were associated with 31 projects. We replicated the analyses reported in table 3 without considering those 31 projects and the results were consistent with those reported in the paper. Finally, our study examined a single software development organization which raises concerns regarding external validity. Industry wide standards and practices have a significant influence on the processes and work practices used by the development organization. Therefore, we think that our findings are applicable across many companies that develop embedded systems in the similar industries.
Awareness beyond Traditional Boundaries
Our results also highlight the detrimental impact of different forms of organizational and technical boundaries in large scale development organizations. The traditional organizing, coordination and awareness mechanisms with focus on a single (e.g. a team) or a small set of organizational units have important limitations in terms of helping organizations overcome boundaries. However, collaborative technologies could provide the necessary mechanisms to reduce the detrimental impact of those organizational and technical boundaries. A way of enhancing awareness at the organizational-level could rely on social computing technologies. Recent work has argued about value of social computing technologies to develop relationships among individuals within a work setting [20, 44]. Instrumenting
Implication for Collaborative Tools
Recent work in the area of communication, coordination and awareness tools for distributed work, in particular product development, suggests several categories of tools that the results reported in this paper could benefit. The following paragraphs discuss the design implications..
288
8. Briand, L.C., et al. Exploring the Relationships between Design Measures and Software Quality in ObjectOriented Systems. The Journal of Systems and Software, 51, pp. 245-273, 2000.
those technologies with the measures used in our study could allow social computing tools to enhance the support of distributed product development projects. For example, the measures of experience provides a basic idea of which members in a particular project could benefits from teambuilding activities or developing relationships with other engineers or developers. In addition, the measure of people dispersion can be used to identify projects with highly uneven distribution of engineers across locations that might benefits from building stronger “social” ties with other members of the development organization. Moreover, combining the measures of experience with information regarding the technical dependencies of the product as defined by the project boundary and the geographic dispersion boundaries could provide valuable guidance to social computing tools to suggest special “buddy” lists as well as “follow” relationships for particular individuals, artifacts or event parts of the system (e.g. a component) under development.
9. Brooks, F. The Mythical-Man: Essays on Software Engineering, Anniversary Edition. Addison-Wesley, 1995. 10.Bruegge, B. et al. Sysiphus: Enabling Informal Collaboration in Global Software Development. In Proceedings of the Int’l Conference in Global Software Engineering. (ICGSE’ 06), Florianopolis, Brazil, 2006. 11.Carmel, E. Global Software Team: Collaboration Across Borders and Time Zones. Prentice-Hall, 1999. 12.Cataldo, M. and Nambiar, S. Quality in Global Software Development Projects: A Closer Look at the Role of Distribution. In Proceedings of the Int’l Conference on Global Software Engineering (ICGSE’09), Limerick, Ireland 2009.
The detrimental impact of Out-Flow technical dependencies reported in our study also emphasizes the need for maintaining awareness of the organizational boundaries (e.g. a project) in the context of the technical space. In recent years a set of collaborative and awareness tools focusing on facilitating identification and management of technical dependencies in product development, particularly, in the context of software development has emerged. Tools such as Worldview [45] or Ensemble [52] could be enhanced to support coordination needs that are created by those boundary-crossing technical dependencies. Moreover, technically-driven boundaries could be combined with geographicdriven boundaries. Then, collaboration tools would be able to raise awareness of relevant coordination needs that relate different development locations.
13.Cataldo, M. et al. Socio-Technical Congruence: A Framework for Assessing the Impact of Technical and Work Dependencies on Software Development Productivity. In Proceedings of the 2nd Symposium on Empirical Software Engineering and Measurement (ESEM’08), Kaiserlaurnter, Germany, 2008. 14.Cataldo, M. et al. On Coordination Mechanism in Global Software Development. In Proceedings of the Int’l Conference on Global Software Engineering (ICGSE’07), Munich, Germany, 2007. 15.Cataldo, M. et al. Software Dependencies, Work Dependencies and their Impact on Failures. Forthcoming in IEEE Transactions on Software Engineering, 2009. 16.Clark, K.B. and Fujimoto, T. Product Development Performance. Harvard Business School Press, 1991.
REFERENCES
1. Allen, T.J. Managing the Flow of Technology. MIT Press, 1977.
17.Curtis, B. Human Factors in Software Development. Ed. by Curtis, B., IEEE Computer Society, 1981.
2. Ancona, D.J. and Caldwell, D.F. Bridging the boundary: external activity and performance in organizational teams. Administrative Science Quarterly, 37 (1992).
18.Curtis, B., et al. A field study of software design process for large systems. Communications of the ACM, 31 (1988), 1268-1287.
3. Argote, L. Organizational Learning: Creating, Retaining and Transferring Knowledge. Springer, 1999.
19.de Souza, C.R.B. et al. How a Good Software Practice Thwarts Collaboration – The multiple roles of APIs in Software Development. In Proceedings of the 12th Conference on Foundations of Software Engineering (FSE ’04), Newport Beach, CA, 2004.
4. Argyres, N.S. The Impact of Information Technology on Coordination: Evidence from the B-2 “Stealth” Bomber. Organization Science, 10, 2 (1999), 162-180.
20.DiMicco, J. et al. Motivations for Social Networking at Work. In Proceedings of the Conference on Computer Supported Cooperative Work (CSCW’08), San Diego, CA, 2008.
5. Barlett, C.A. and Ghoshal, S. Transnational Management, 3er Ed. McGraw-Hill, Boston, MA, 2000. 6. Basili, V.R. and Musa, J.D. The Future Engineering of Software: A Management Perspective. IEEE Computer, 20, 4 (1991), 90-96.
21.Eisenhardt, K.M. and Tabrizi, B.N. Accelerating Adaptive Processes: Product Innovation in the Global Industry. Adm. Science Quarterly, 40, 1 (1995), 84-110.
7. Boh, W.F., et al. Learning from Experience in Software Development: A Multilevel Analysis. Mgmt. Science, 53, 8 (2007), 1315-1331.
22.Ellis, J.B. et al. Task and Social Visualization in Software Development: An Evaluation of a Prototype. In
289
Proceedings of the Conference on Human Factors in Computing System (CHI’07), San Jose, CA, 2007
Journal of Product Innovation Management, 18 (2001), 110-120.
23.Eppinger, S.D. et al. A Model-Based Method for Organizing Tasks in Product Development. Research in Engineering Design, 6 (1994), 1-13.
39.Nan, N. et al. Impact of Budget and Schedule Pressure on Software Development Cycle Time and Effort. Forthcoming in IEEE Trans. on Software Eng., 2009.
24.Espinosa, J.A. et al. Do Gradations of Time Zone Separation Make a Difference in Performance? A First Laboratory Study. In Proceedings of the Int’l Conference on Global Software Engineering (ICGSE’07), Munich, Germany, 2007.
40.O’Leary, M.B. and Cummings, J. The Spatial, Temporal and Configurational Characteristics of Geographic Dispersion in Team. MIS Quarterly, 31 (2007), 433-452. 41.Olson, G.M. and Olson, J.S. Distance Matters. HumanComputer Interaction, 15, 2 & 3 (2000), 139-178.
25.Espinosa, J.A., et al. Familiarity, Complexity, and Team Performance in Geographically Distributed Software Development. Organization Science, 18, 4 (2007), 613630
42.Paulk, M.C. et al. The Capability Maturity Model: Guidelines for Improving the Software Process. Addison-Wesley, 1994. 43.Pieper, J.H., et al. Team Analytics: Understanding Team in the Global Workplace. In Proceedings of the Conference on Human Factors in Computing System (CHI’09), Boston, MA, 2009.
26.Garvin, D.A. Managing Quality. The Free Press, 1988. 27.Grinter, R.E., et al. The Geography of Coordination Dealing with Distance in R&D Work. In Proceedings of the Conference on Supporting Group Work (GROUP’99), Phoenix, Arizona, 1999.
44.Sadat Shami, N. et al. Making Sense of Strangers’ Expertise from Signals in Digital Artifacts. In Proceedings of the Conference on Human Factors in Computing System (CHI’09), Boston, MA, 2009.
28.Gumm, D.C. Distribution Dimensions in Software Development Projects: A Taxonomy. IEEE Software, 23 (2006). 29.Harter, D.E., et al. Effects of Process maturity on Quality, Cycle Time, and Effort on Software Product Development. Management Science, 46, 4 (2000), 451-466.
45.Sarma, A. and van der Hoek, A. Towards Awareness in the Large. In Proceedings in the Int’l Conference on Global Software Engineering (ICGSE’06), Florianópolis, Brazil, 2006.
30.Herbsleb, J.D. et al. An Empirical Study of Speed and Communication in Globally Distributed Software Development. IEEE Trans. on Software Eng., 29, 6 (2003).
46.Selby, R.W. et al. Analyzing Error-Prone System Structure. IEEE Transactions on Software Engineering, 17 (1991), 141-152.
31.Hinds, P.J. and Bailey, D.E. Out of Sight, Out of Sync: Understanding Conflict in Distributed Teams. Organization Science, 14, 6 (2003), 615-632.
47.Sethi, R. New Product Quality and Product Development Teams. Journal of Marketing, 64 (2000), 1-14. 48.Sosa, M., et al. Component Connectivity, Team Network Structure and the Attention to Technical Interfaces in Complex Product Development. Working Paper, INSEAD Business School, 2007.
32.Hutchens, D.H. et al. System Structure Analysis: Clustering with Data Bindings. IEEE Transactions on Software. Engineering, 11 (1985), 749-757. 33.Jazz Project. http://jazz.net/pub/index.jsp. URL accessed on June 1st, 2009
49.Terwiesch, C. et al. Measuring the Effectiveness of Overlapping Developing Activities. Management Science, 45, 4 (1999), 455-465.
34.Karau, S.J. et al. The Effects of Time Pressure and Time Abundance on Group Performance Quality and Interaction Process. Journal of Experimental Social Psychology, 28, 6 (1992), 542-572.
50.Ulrich, K.T. and Eppinger, S.D. Product Design and Development, 4th Edition. McGrow-Hill, 2007. 51.Wheelwright, S.C. et al. Revolutionizing Product Development: Quantum Leaps in Speed, Efficiency, and Quality. Free Press, 1992.
35.Kutner, M., et al. Applied Linear Regression Models, 4th Ed., McGraw-Hill, 2004. 36.Liang, D.W., et al. Group versus Individual Learning and Group Performance: The Mediating Role of Transactive Memory. Personality and Social Psychology Bulletin, 21, 4 (1995), 384-393.
52.Xiang, P.F. et al. Ensemble: A Recommendation Tool for Promoting Communication in Software Teams. In Proceedings of the Workshop on Recommendation Systems for Software Engineering (RSSE’08), Atlanta, GA, 2008.
37.Loch, C.H. et al. Communication and Uncertainty in Concurrent Engineering. Management Science, 44, 8 (1998), 1032-1048.
53.Zimmermannn, T. and Nagappan, N. The Predicting Defects using Network Analysis on Dependency Graphs. In Proceedings of the International Conference on Software Engineering (ICSE’08), 2008, 531-540.
38.McDonough, E.F. et al. An Investigation of Global, Virtual and Collocated New Product Development Teams.
290