Advances in Cognitive Psychology
research Article
Space positional and motion SRC effects: A comparison with the use of reaction time distribution analysis Piotr Styrkowiec1 and Remigiusz Szczepanowski2 1
Institute of Psychology, University of Wroclaw, Poland
2
University of Social Sciences and Humanities, Faculty in Wroclaw, Poland
Abstract
KeywordS stimulus-response correspondence, Simon effect, space positional SRC effect, motion SRC effect, RT distribution analysis
The analysis of reaction time (RT) distributions has become a recognized standard in studies on the stimulus response correspondence (SRC) effect as it allows exploring how this effect changes as a function of response speed. In this study, we compared the spatial SRC effect (the classic Simon effect) with the motion SRC effect using RT distribution analysis. Four experiments were conducted, in which we manipulated factors of space position and motion for stimulus and response, in order to obtain a clear distinction between positional SRC and motion SRC. Results showed that these two types of SRC effects differ in their RT distribution functions as the space positional SRC effect showed a decreasing function, while the motion SRC showed an increasing function. This suggests that different types of codes underlie these two SRC effects. Potential mechanisms and processes are discussed.
Introduction
of attention (Van der Lubbe, Abrahamse, & De Kleine, 2012), the event coding account (Hommel, Müssler, Aschersleben, & Prinz, 2001), the
The classicsta Simon effect refers to a situation in which participants
activation-suppression account (Ridderinkhof, 2002), or visuomotor
are required to make a left or right manual response to a nonspatial
activation (Wascher, Schatz, Kuder, & Verleger, 2001). However, none
feature of a visual stimulus (e.g., the colour of an object; see Simon,
of these accounts seems to prevail, which comes as no surprise given
1990, for a review). Motor responses tend to be faster and more ac-
that different research techniques and data analysis methods (e.g., of
curate when the location of the stimulus corresponds with the loca-
distributions) produced inconclusive results.
tion of the required response, despite the fact that the location of the
The same ambiguity applies to another example of an SRC phe-
target is irrelevant for performing the task (Simon & Rudell, 1967).
nomenon, the motion based SRC effect, for example, the motion based
This advantage is an example of a phenomenon known as stimulus-
type of the Simon effect. Generally, this phenomenon refers to faster
response correspondence (SRC). In particular, the Simon effect is a
and more accurate responses when responses correspond spatially
type of SRC that concerns space positional correspondence. Although
to the direction of the motion of the target object. This holds even if
the Simon effect has been widely studied in experimental psychology,
stimulus motion is irrelevant for the choice task at hand because par-
the underlying factors of this effect are still a matter of ongoing debate
ticipants respond to a visual feature other than motion (e.g., colour).
(for a review, see Hommel, 2011; Proctor & Vu, 2006). With regard to the potential mechanisms responsible for the occurrence of the Simon effect, several models have been proposed: the two-route model
Corresponding author: Piotr Styrkowiec, Institute of Psychology,
(Kornblum, Hasbroucq, & Osman; 1990), the attention-shift account
University of Wroclaw, ul. Dawida 1, 50-527 Wroclaw, Poland. E-mail:
(Nicoletti & Umiltà, 1994), an updated version of the premotor theory
[email protected]
202
2013 • volume 9(4) • 202-215
http://www.ac-psych.org DOI • 10.2478/v10053-008-0146-5
Advances in Cognitive Psychology
research Article
This effect is sometimes treated as a variant of the classic Simon ef-
Proctor et al. (2011) point out that decreasing functions, in which
fect (e.g., Galashan, Wittfoth, Fehr, & Herrmann, 2008). In research
the Simon effect is largest at the short RT bins and decreases across
on the motion-based Simon effect, spatial (i.e., positional) and mo-
distribution, are mainly limited to the standard version of the Simon
tion cues are often confounded, causing difficulty in explaining the
task (the classic Simon effect; e.g., Experiment 1 of De Jong et al., 1994;
nature of this effect. Specifically, while having some motion feature,
or Experiment 1 of Vallesi, Mapelli, Schiff, Amodio, & Umiltà, 2005).
very often either the stimulus or the response is additionally located
The decreasing magnitude of the Simon effect for slower responses is
on the left or the right side (e.g., Nattkemper & Prinz, 2001; Wittfoth,
thought to support the idea of decay of automatically formed spatial re-
Buck, Fahle, & Hermann, 2006). Thus, apart from the motion feature
sponse codes (Hommel, 1994). Other studies not listed by Proctor et al.’s
also the positional factor (i.e., the lateral location of the stimulus and/
review also provide evidence for the decreasing function (e.g., Van der
or the response) is involved. This positional factor may play a role in
Lubbe, Jaśkowski, & Verleger, 2005; Van der Lubbe & Verleger, 2002).
shaping the particular SRC effect. Most importantly, this might be the
On the other hand, increasing functions, when the SRC effect is small
reason why the explanation of the nature of the motion based SRC
with the fastest responses and becomes larger with slower responses,
effect lacks clarity. Two concurrent accounts attempt to explain the
are often obtained, for instance, when location information is provided
motion-based Simon effect: One is related to coding of the stimulus
by centrally located indicators (i.e., arrows; Pellicano, Lugli, Baroni, &
motion direction (see Figliozzi, Silvetti, Rubichi, & Doricchi, 2010), the
Nicoletti, 2009) or when stimulus and response locations are arranged
other one refers to referential coding of stimulus motion (see Bosbach,
vertically (Experiment 1 of Proctor, Vu, & Nicoletti, 2003). Proctor and
Prinz, & Kerzel, 2004, 2005). What is important, these explanations
colleagues (2011) summarized this discrepancy as follows:
are derived from theories on the classical space positional SRC pheno-
…although the patterns of these distribution functions for different
menon as they relate to the attentional shift and event coding accounts,
versions of the Simon task are generally reliable, there is no current
respectively.
explanatory model that encompasses both when and why the Simon
In the current study, we made a distinction between the classic
effect decreases in some cases and increases in others. (p. 263)
Simon effect and its motion-based counterpart by claiming that both
Despite the difficulties in explaining the Simon effect by the distri-
effects should be treated as separate phenomena. We expected to find
bution analysis, the authors stress that it is a helpful tool and as such
differences between space-positional SRC and motion based SRC ef-
should be applied to other phenomena in which irrelevant stimulus
fects in terms of their temporal dynamics (i.e., how the magnitude of
information generates response competition.
these effects changes as a function of the response speed). This was
There are several models that make an attempt to explain why the
examined by comparing these effects by means of distribution analyses
magnitude of the SRC effect changes as the function of the response
of reaction times (RTs).
speed. However, none of these accounts is capable of explaining why
Since the work of De Jong, Liang, and Lauber (1994), it has become a
the one type of the SRC task leads to the decreasing RT distribution
recognized standard in studies on the Simon and other correspondence
function whereas the other type of the SRC task elicits the increasing
effects to report not only RT differences between the corresponding
pattern of that function. In the present study, we refer to the visuo-
and non-corresponding conditions, but also to include the analysis of
motor activation model proposed by Wascher et al. (2001), and to
RT distributions (Proctor, Miles, & Baroni, 2011). RT distributions for
the activation-suppression model offered by Ridderinkhof (2002).
non-corresponding and corresponding trials for each participant are
Although these accounts might seem competing at first, they both offer
divided into quantiles, called bins. In most cases, the number of bins is
a plausible explanation of the temporal dynamics of the SRC effect.
between four and 10. The mean RT is calculated for each bin, and the
According to the model proposed by Wascher et al. (2001), the intra-
difference between mean RTs for noncorresponding and correspond-
hemispheric activation caused by a privileged visuomotor pathway
ing trial types is determined, which shows the magnitude of the SRC
accounts for the decrease of the Simon effect over time. Processing of
effect for each bin. Finally, the differences are plotted and analyzed as a
a laterally presented stimulus causes increased activation in the hemi-
function of bin and condition. When the size of the SRC effect is largest
sphere contralateral to the stimulus position. This, in turn, directly in-
at the short RT quantile and then decreases, this is denoted as a decreas-
fluences another activation which is related to response readiness with
ing distribution function. When the size of the SRC effect is small with
the effector that is under control of the same hemisphere (Wascher et
the fastest responses (short RT bins) and becomes larger with slower
al., 2001). Hence, the activation within the neuronal visuomotor path-
responses (long RT bins), an increasing RT distribution function is ob-
way in the same hemisphere is responsible for faster and more accurate
served. Proctor et al. (2011) reviewed studies using the RT distribution
responding in the case of spatial correspondence between the stimulus
analysis of spatial correspondence effects and demonstrated that there
and response. The model assumes that the visuomotor activation in
is no consistency in the patterns of group distributions between dif-
corresponding trials relates to increased variance of RTs. Wascher et al.
ferent types of experiments on spatial (i.e., positional) correspondence
(2001) suggest that this increased variance of corresponding trials is a
effects. Nonetheless, the authors give arguments in favor of the claim
result of additional processes that are negatively time-consuming. This
that distribution functions indeed reflect the time course of processing
can be understood in terms of cognitive processing that accelerates
underlying the Simon effect, a claim that was repeatedly questioned
subsequent processing. According to Zhang and Kornblum’s explana-
(Buetti & Kerzel, 2008; Roswarski & Proctor, 2003).
tion (1997), larger variance of the RT distribution for corresponding
203
2013 • volume 9(4) • 202-215
http://www.ac-psych.org
Advances in Cognitive Psychology
research Article
than for noncorresponding trials yields a larger difference between
this will be reflected in the shape of the RT distribution function, which
congruent and incongruent trials. As this activation dissipates, the
initially (i.e., for faster responses) will have a positive slope but with
variance of RTs for congruent trials and the difference between con-
slower responses it will level off.
gruent and incongruent conditions decrease. This results in the nega-
After a close inspection of the literature, we noted that there have
tive slope of the distribution function (i.e., decreasing the Simon effect
been no reports so far on distribution analyses of the motion based
with increasing RTs). Additionally, in the first version of their theory,
SRC effect. Therefore, we will explore the time course of the classic
Wascher et al. claimed that visuomotor activation occurs only with
Simon effect and the motion based SRC effect. By the former we mean
left and right hand responses to horizontally arranged stimulus con-
an effect in a task in which participants respond with the left or right
figurations. That is, visuomotor activation and the decreasing Simon
hand (by pressing a button) to a non-spatial feature of a static visual
effect functions should not be expected when stimuli and responses
stimulus located either in the left or right visual field. A congruent
vary along the vertical dimension or when the response is unimanual.
lateral position of the stimulus and the response results in faster RTs
However, recent research seems to contradict Wascher and colleagues’
compared to an incongruent position. By the latter effect we mean an
original hypothesis by showing that the decreasing distribution func-
effect in a task in which stimuli and responses share the feature of mo-
tion may occur for unimanual responding (e.g., Buetti & Kerzel, 2008;
tion and only that feature determines SRC. We call that the pure motion
Proctor & Vu, 2010; Wiegand & Wascher, 2007a). Moreover, there are
based SRC effect. In this case, congruency of motion direction between
studies demonstrating stable or increasing distribution functions even
stimulus and the response brings faster responses than the incongruent
though stimuli were presented horizontally and responses were given
condition. In order to obtain this effect, the participant’s task should
with the left or right hands in a normal position (see Experiment 1 of
meet the following requirements:
Mapelli, Rusconi, & Umiltà, 2003; Experiment 1 of Gevers, Caessens,
1. The stimulus is displayed at central fixation and does not change
& Fias, 2005; and Experiment 1 of Gevers, Ratinckx, De Baene, & Fias,
its position.
2006). The above evidence contradicts the claims of Wascher et al.’s
2. Only the internal structure of the stimulus moves while the
original model. This account was also criticized for being based heavily
overall position of the stimulus remains the same.
on physiology, and that experiments aimed at supporting this model
3. To this end, a square object is formed by a group of vertical
were problematic in terms of their methodology as well as interpre-
stripes, and the stripes move to the left or right, but never go be-
tation (see Roswarski & Proctor, 2003). This criticisms led Wascher’s
yond the borders of the square object.
group to modify their account (Wiegand & Wascher, 2007a, 2007b).
4. Thus, the vertical lines within the square are displaced in either
Now, according to the modified view, it is not the spatioanatomical
direction while the whole square remains stationary.
mapping itself that is responsible for the visuomotor activation but
This technique allows for conveying motion information in the ab-
it may result from distinct mechanisms that rely on different spatial
sence of a position shift (see Bosbach et al., 2004). In order to increase
response codes. Direct activation of the corresponding response may
the dimensional overlap between stimulus motion and response, the
be an effect of an overlap between spatial stimulus feature and one of
participant performs joystick movements to the right or left in re-
the two distinct parameters of the motor code. Depending on the task
sponse to the color of the grating. The joystick is placed on the body
these parameters represent either the spatial anatomical status of the
midline and the participant operates it with his or her dominant hand
effector or relative response location based on a cognitive mechanism
(unimanual response setup). This setup allows for the pure motion
(Wiegand & Wascher, 2007a). Yet, as Proctor et al. (2011) pointed out,
based SRC effect to occur, because the spatial factor is limited or even
this modification still requires more empirical support.
excluded as the stimuli and responses are not located on either side.
The activation-suppression model by Ridderinkhof (2002) delivers
The current study examined the time course of response activation
another explanation for the SRC effect, implicating that an activated
within the spatial SRC effect and the motion based SRC effect. First, we
response can be selectively inhibited. This account assumes that it takes
replicated the standard visual left-right space positional correspondence
some time for inhibition to build up, therefore, we observe an inhibitory
task in order to obtain the classic Simon effect with the decreasing dif-
effect after some time in response activation. Slower responses are thus
ference between non-corresponding and corresponding trials across
affected in greater extent by selective inhibition than faster responses.
RT bins. This task was set up as a control experiment for our studies.
Ridderinkhof ’s account suggests that for faster responses on congruent
Then, we conducted three experiments, in which we progressively
trials the automatic activation processes (automatic route) facilitate the
introduced a motion feature for the response and stimulus while limit-
correct response, while on incongruent trials, these processes interfere
ing the spatial factor (side location) of the response and stimulus. This
with the correct response (Ridderinkhof, van den Wildenberg, Wijnen,
allowed us to eventually establish a task with the pure motion SRC.
& Burle, 2004). On the other hand, with slower responses, inhibition
RT distribution functions were calculated in all four experiments.
has time to develop, and can result in the reduction of activation of the
Similarly to De Jong et al. (1994), we reasoned that if the space
incorrect response along the direct automatic route. Therefore, it is ex-
positional SRC effect and the pure motion based SRC effect are dif-
pected that correct responses for congruent trials can be less facilitated,
ferent phenomena, this should be reflected in different shapes of the
whereas the correct responses to incongruent trials can be less delayed
distribution functions for these effects. In reference to the Wiegand
(Ridderinkhof et al., 2004). According to Ridderinkhof and colleagues,
and Wascher (2007b) account, we suspected that the standard space
204
2013 • volume 9(4) • 202-215
http://www.ac-psych.org
Advances in Cognitive Psychology
research Article
positional SRC effect would lead to a decreasing RT distribution func-
joystick was covered with a black box with specially-designed holes for
tion while the motion based SRC effect would lead to an increasing
hands so that participants were unable to see the joysticks, their hands,
distribution function as these two effects are probably based on dif-
or their movements. This was introduced because we wanted to limit
ferent types of motor codes.
reciprocal visual information about hand movements as it might have an effect on stimulus-response interaction. The stimuli used in the experiment were colour rectangular grat-
Experiment 1
ings formed by five vertical lines, which were presented on black back-
We used the standard visual left-right Simon task to examine the
ground. Each stripe was ~0.5° wide and ~5° high. The space between
space positional SRC effect magnitude change as a function of re-
the lines was of ~0.7° width. The area of the rectangular grating was
sponse speed. Usually, in the typical visual Simon task, participants
around 5° × 5° in size. All stripes of the grating were either red or green.
are required to make a left or right manual response (e.g., with the
The rectangular grating was located in the middle of the vertical merid-
button press) to a non-spatial feature of the visual stimulus (e.g.,
ian of the screen, either on the left or on the right side. The distance
colour), which is located in either the left or right visual field. In this
between the centre of the screen and the centre of the rectangular grat-
setup, a lateral location of the stimulus and response is irrelevant for
ing was approximately ~7.5°. There were four types of stimuli: a red
the task at hand, but this spatial factor is crucial for the occurrence
grating on the left, a red grating on the right, a green grating on the left,
of the SRC effect. This experiment was set to replicate findings re-
and a green grating on the right.
ported in previous studies (see the Introduction section) and to serve as a control experiment. Thus we expected that a congruent
Procedure
lateral position of the stimulus and the response will result in faster
Each trial begun with a black screen presented for 1,000 ms. Then,
responses compared to an incongruent condition. We also expected
the colour grating was displayed for 200 ms along with a white fixation
that this canonical setup will yield a decreasing RT distribution
point shown in the centre of the screen. Next, another black screen
function.
was presented, and the participants indicated the colour of the vertical stripes by pressing the left or the right button with the left or the right
Method
thumb. The response period lasted for a maximum of 1,000 ms or until
Participants
a response was recorded. Participants were asked to respond as fast
Thirteen undergraduates (10 females, three males) took part in
and as accurate as possible. RTs were measured from stimulus onset.
the experiment in exchange for a course credit. Participants were aged
After each response, a feedback screen was presented for 1,000 ms,
from 21 to 52 years (M = 28.9, SD = 8.3). All had normal or corrected-
which informed the participant whether the answer was correct, in-
to-normal vision, and had no motor impairments as well as no former
correct, or whether there was no response. Then, a new trial started.
or current neurological disorders. All participants were right-handed
Participants were instructed to maintain their eyes on the fixation dot
as assessed with the Edinburgh Handedness Inventory (Oldfield, 1971)
that accompanied the stimulus during its brief presentation. The ex-
after the participant completed the task. Participants were naïve to the
periment consisted of two blocks so that in one block the left button
purpose of the experiment. All participants gave written informed
press was assigned to the green colour and the right button press to the
consent before the experiment. The study was approved by the local
red colour, while in the other block, assignments of the colours to the
ethical committee of the University of Social Sciences and Humanities,
buttons was reversed. Overall, there were 160 trials in each block with
Faculty in Wroclaw.
four types of colour gratings (40 red on the left side, 40 green on the right side, etc.) that were presented in random order. The number of
Apparatus and stimuli
congruent trials, in which the spatial stimulus location corresponded
The experiment took place in a sound-attenuated and darkened
to response location (spatial congruence), was equal to the number
room. Participants were seated in front of a 21-inch CRT monitor
of incongruent trials with no spatial correspondence between the
(with refresh rate of 100 Hz) controlled by a PC computer. Stimulus
stimulus and response. The order of blocks was randomized across
presentation and response recording was controlled by the Inquisit
participants. Before each block, participants were explicitly informed
software system. An adjustable chin-rest was used to hold the partici-
about the types of colour-response assignments. At the beginning of
pant’s head in a steady position. The distance between the eyes and the
the experiment, participants were carefully instructed how to proceed
screen was approximately 60 cm. Responses were collected with the
with the task, and were given a short practice session.
use of the buttons of two Saitek Aviator joysticks. The joysticks were
To evaluate how the magnitude of the space positional correspond-
located on the desk so that each participant could comfortably lay both
ence effect changes as a function of response speed, a distributional
hands on the desk while placing both hands on the joysticks’ bases. The
analysis was conducted on RT data (De Jong et al., 1994; Proctor et al.,
middle buttons at the front of each joystick base were used; participants
2011). Only RTs for correct responses were included. Trials with RTs
pressed the button on the left joystick base with their left thumbs, and
faster than 100 ms (< 0.5%) were excluded from the analysis. For each
the button on the right joystick base with their right thumbs. The dis-
participant RT data were ordered and ranked in respect to five bins
tance from the left to the right joystick was approximately 50 cm. Each
partitioned into quantiles separately for congruent and incongruent
205
2013 • volume 9(4) • 202-215
http://www.ac-psych.org
Advances in Cognitive Psychology
research Article
For each participant, the mean congruent RTs were subtracted
700 650
CONGRUENCY of stimulusfrom position response position theand incongruent mean
CONGRUENCY of stimulus position and response position
stimulus position and response position
of the RT distribution function for the positional SRC effect showed
INCONGRUENCY of stimulus position and response position
an inverted j-shaped curve with the decreasing course. In particular,
Mean RTs (ms) Mean RTs (ms)
600
the space positional correspondence effect function peaked at about 45 ms at the second bin, and then decreased to about -3 ms at the fifth
550
bin. The exact values of the SRC effect were 32, 45, 37, 23, and -3 ms from the shortest to the longest bin. To further examine the slope of the
500
RT distributions, the size of the space positional SRC effect for all bins was subjected to a linear regression analysis. The regression analysis
450
indicated that this effect decreased as a function of the bin, β = -0.30, t(64) = -2.53, p = .014. In fact, the curvilinear pattern of the space posi-
400
tional correspondence effect function was confirmed by the quadratic model of regression, β1= 0.90, t(62) = 1.49, p = .14, β2= -1.23, t(62) = -2.03,
350
p = .046. The analysis of accuracy did not show significant differences in the
300 473ms
525ms
RTs in order to obtain the plot of the RT
distribution function (see Figure 5, solid line). The resulting pattern INCONGRUENCY of
365ms
428ms
473ms
525ms
638ms
Means distribution quantiles (bins) Means of of RTRTDistribution Quantiles (Bins)
638ms
distribution quantiles (bins)
results: Participants reached the level of 94% of correct answers in the space positional congruency condition and 90% in the incongruent condition (p = .30).
Figure 1. Mean reaction times (RTs) for congruent and incongruent trials for five RT distribution quantiles (bins) from Experiment 1.
Discussion Consistent with previous research (see Simon, 1990; see also Hommel, 2011), our control Simon task showed a robust space positional SRC effect. This effect was not present in our accuracy measures. In addition, the results from the RT distribution analysis indicated that the posi-
condition. Each bin had a range of 20 percentiles. Low bins related to
tional SRC effect decreased as RTs increased, which is also consistent
faster responses whereas higher bins related to slower responses. Next,
with previous findings on temporal activation properties for the Simon
the mean RT was calculated for each bin. Subsequently, for each bin the
effect (see Proctor et al., 2011, for a review). This decrease of positional
difference between mean RTs for noncorresponding and correspond-
SRC effect magnitude over time conforms to the idea of the decay of
ing conditions were determined. Finally, these differences were plotted
automatically formed spatial response codes (Hommel, 1994). The
and analyzed as a function of bin and condition.
resulting pattern of the RT distribution function is also in line with the
All statistical analyses were conducted using IBM SPSS software.
visuomotor activation hypothesis (Wascher et al., 2001), which assumes
To correct for violations of the sphericity assumption in all ANOVAs,
that visuomotor activation that results from distinct motor codes dissi-
the Greenhouse-Geisser correction was used.
pates over time which leads to a decrease of the congruency effect with longer responses. A closer investigation of the Simon effect function
Results
demonstrates that the space positional SRC effect changed nonlinearly
The mean RTs for correct responses were subjected to a two-way re-
over time. Clearly, the function has a curvilinear shape with a maxi-
peated-measures analysis of variance (ANOVA) with the independent
mum between the first and the second bin, until it displays a typical
variables of Bin (with five levels: from the first to the fifth bin) and
decreasing character. Such a pattern of results is similar to outcomes
Space Positional Congruency Between Stimulus and Response (con-
reported by Davranche and McMorris (2009), who had participants
gruent vs. incongruent). ANOVA revealed the main effect of space
perform the Simon task with thumbs. These researchers have explained
positional congruency, F(1, 12) = 7.23, p = .02, with faster RTs when the
the curvilinear shape of the distribution function with reference to the
stimulus location corresponded to the response location (472 ms) as
activation-suppression model. Interestingly, our plot for the RT distri-
compared to the condition without such correspondence (499 ms; see
bution function also appears to corroborate the activation-suppression
Table 1). Trivially, the main effect of bin was observed, F(4, 48) = 300.5,
model by Ridderinkhof (2002). Because suppression of automatic ac-
p < .001.
tivation needs some time to develop, initially the spatial dimensional
Of most interest, a significant interaction between Bin and Space
overlap causes response activation that produces an increase of the
Positional SRC, F(4, 48) = 9.06, p < .001, showed that for all bins, mean
correspondence effect magnitude. After a while, when suppression
RTs for the congruent condition were faster than for the incongruent
comes into play, activation becomes progressively inhibited. The initial
condition, and that in the congruent condition, the RT increase was
increase of the effect size may be stopped and a decrease is more likely
steeper than in the incongruent condition (see Figure 1).
to begin. This effect is reflected in the inverted j-shaped curve of the RT
206
2013 • volume 9(4) • 202-215
http://www.ac-psych.org
Advances in Cognitive Psychology
research Article
Procedure
distribution function. Although both models (i.e., the visuomotor activation and the activation-suppression accounts) predict the decrease
The stimuli were presented in the same fashion as in the previous
of the spatial SRC effect in Simon tasks, it seems that the activation-
experiment. The only modification within the procedure regarded re-
suppression model fits better with the curvilinear effect function.
sponding. Participants were asked to indicate the colour of a stimulus by pushing the joystick either to the left or right. Participants were told
Experiment 2
to shift the joystick to its original upright position as quickly as possible
The task used in this experiment was designed to introduce a motion
beginning of the leftward or rightward joystick movement was treated
feature of the response, while the location factor of the response was
as the start of the reaction. There were two blocks with 160 trials each.
limited. In this task, participants responded to the colour of the stimu-
In one block, the leftward movement by joystick tilting was assigned
lus located on the left or right side by leftward or rightward joystick
to the red lines, whereas the rightward movement was assigned to the
stylus movements. Although there was a movement feature involved
green lines; the colour assignment in the other block was reversed. In all
in this task (which was absent in the task from Experiment 1), the SRC
other respects this experiment was identical to the previous experiment.
right after each response. RTs were measured from stimulus onset. The
had a position-referential character, that is, the stimulus was located on either side and the response was performed in either direction, in
Results
reference to the stimulus position. Importantly, as the joystick was po-
Mean RTs for correct responses were subjected to a two-way repeated
sitioned in the centre, on the body midline, and was operated with the
measures ANOVA with the independent variables of Bin and
participant’s dominant hand (the unimanual response setup), the posi-
Congruency Between Stimulus Location and Response Movement
tional aspect of the response was limited. Although there was a factor
Direction (congruent vs. incongruent). ANOVA revealed the main ef-
of motion, we assumed that the SRC effect in this experiment should
fect of congruency between the stimulus location and response move-
be rather a spatial phenomenon. We expected thus that the magnitude
ment direction, F(1, 12) = 31.42, p < .001, with faster RTs for congruent
of the effect associated with correspondence between stimulus loca-
(532 ms) as compared to incongruent trials (564 ms; see Table 1).
tion and response movement (in the direction of the stimulus location)
Trivially, a main effect of bin was observed, F(4, 48) = 347.3, p < .001.
would decrease with longer RTs. Although Wascher et al. (2001) sug-
Of most interest, a significant interaction between Bin and
gested that with the unimanual responses the RT distribution function
Congruency, F(4, 48) = 16.89, p < .001, showed that for all bins mean
should be stable or increase, we assumed that in our experiment this
RTs for the congruent condition were faster than for the incongruent
function should decrease because of the dominant role of the positionreferential (i.e., spatial) factor.
Method 750
Participants Thirteen750 students (nine females, four males) from the same popu-
700
lation as in Experiment 1 took part in the experiment in exchange for course credits. 700 None of the volunteers participated in the previous
650
experiment. Their age ranged from 19 to 32 years (M = 22.7, SD = 4.9).
Mean RTs(ms) (ms) Mean RTs
All had normal 650 or corrected-to-normal vision, and had no motor impairments and neurological disorders. All participants were Mean RTs (ms)
right-handed as assessed with the Edinburgh Handedness Inventory 600
(Oldfield, 1971). 550
Apparatus and stimuli Experiment 2 was carried out in the same experimental setup as 500
CONGRUENCY of stimulus position and response movement direction
In this experiment, responses were collected with one joystick 450
INCONGRUENCY of stimulus position and response movement direction
600 550 500
400
(Saitec Aviator), positioned centrally with respect to the body midline. The joystick’s position allowed participants to comfortably lay their
350
hand on the400 desk. Participants held the joystick with their dominant
hand. Before the procedure, each participant was asked to imagine 434ms
493ms
537ms
589ms
hand to hold the joystick was selected accordingly. The black box was The stimuli were exactly the same as in Experiment 1.
207
2013 • volume 9(4) • 202-215
434ms
493ms
537ms
589ms
690ms
Means of RT distribution quantiles (bins)
Means of RT Distribution Quantiles (Bins) 690ms
Means of RT distribution quantiles (bins)
also used to cover the hand for the same purpose as in Experiment 1.
INCONGRUENC stimulus position and response movement d
450
Experiment 1, with the following modifications.
with which350 hand she or he would prefer to grasp a tennis racket. The
CONGRUENCY stimulus position and response movement d
Figure 2.
Mean reaction times (RTs) for congruent and incongruent trials for five RT distribution quantiles (bins) from Experiment 2.
http://www.ac-psych.org
Advances in Cognitive Psychology
research Article
condition, and that the RTs increase was steeper for the congruent than
possessed also the feature of motion, and the response had only the
for the incongruent condition (see Figure 2).
feature of motion. In the previous experiment, the stimulus had only
For each participant, mean RTs for congruent trials were subtracted
a positional feature, and the response had only the motion feature.
from mean RTs for incongruent trials to generate a group RT distribu-
This motion feature of the stimulus in Experiment 3 was obtained by
tion function (see Figure 5, dashed line). The resulting pattern of the
employing a coloured sine-wave grating described in the Introduction
RT distribution function for the position-referential correspondence
section. In this version of the task, the stationary-moving stimulus was
effect showed an inverted j-shaped curve with the decreasing course. In
presented on either the left or the right side. The stationary-moving
particular, the SRC effect function peaked at about 46 ms at the second
stimulus had two distinct space positional and motion features: left
bin, and then decreased to about 9 ms at the fifth bin (the effects were
versus right location and leftward versus rightward movement of the
41, 46, 44, 33, and 9 ms from the shortest to the longest bin). To fur-
vertical lines within the stimulus, respectively. The whole stimulus was
ther examine the slope of the RT distribution function, the sizes of the
stationary and although it had a feature of motion, the stimulus was
SRC effects for all bins were subjected to the linear regression analy-
not changing its spatial position. The responses were given by pushing
sis, which revealed that this effect decreased as a function of the bin,
the joystick’s stylus in the left or right direction using the dominant
β = -3.91, t(64) = -3.37, p = .001. In fact, the curvilinear pattern of the
hand (the unimanual response setup). Two types of SRC can be dis-
SRC effect function was confirmed by the quadratic model of regres-
tinguished in this task: (a) correspondence between stimulus position
sion, β1 = 1.1, t(62) = 1.92, p = .059, β2 = -1.5, t(62) = -2.66, p = .01.
and the direction of response movement, and (b) correspondence
The analysis of accuracy did not show significant differences, indi-
between the within-stimulus motion direction and the direction of
cating that participants reached the level of 96% of correct answers in
the response movement. We called the first one the position-referential
the congruent S-R condition, and 94.6% in the incongruent condition
SRC and the other one the motion-directional SRC. Furthermore, we
(p = .35).
assumed that the referential SRC is more spatial in nature whereas the directional SRC is a more motion-based phenomenon (i.e., other types
Discussion
of representational codes may play a role in these phenomena). As
Experiment 2 demonstrated a robust congruency effect between the
such, we claimed that in this experiment, these two kinds of the SRC
spatial location of the stimulus and the response movement toward
effect should occur independently from each other (there should be no
stimulus position, which is another kind of the SRC effect. This SRC
interaction between these two effects). Additionally, the RT distribu-
effect may be treated as position-referential in its character, because
tion functions for these two effects should differ, which is in line with
space positional factors play an important role here: The stimulus is
the rationale behind experiments reported by De Jong et al. (1994). To
laterally located and the response is performed toward the side of that
some extent, similar work was done by Nattkemper and Prinz (2001)
stimulus (i.e., in reference to its position). Thus, it suggests that the po-
and by Bosbach, Prinz, and Kerzel (2005), though in their studies, the
sitional factor may be significant in mechanisms of stimulus-response
stimulus motion feature was related to its position shift, that is, the
matching. It was shown via the distribution analysis that the congru-
stimulus was moving as a whole. Moreover, in these studies, the SRC
ency effect between stimulus location and response movement toward
effects were not compared using distribution analyses.
a lateralized position decreased with longer RTs. This result is consistent with findings of the SRC studies employing unimanual responses,
Method
which contradict the claim proposed by Wascher et al. (2001) that for
Participants
this response condition, an increasing distribution function should be
Thirteen students (eight females, five males) from the same popu-
found (e.g., Buetti & Kerzel, 2008; Proctor & Vu, 2010). In our study,
lation as in Experiment 1 took part in exchange for course credits.
responses were given with the dominant hand and the size of the SRC
None of the volunteers participated in Experiment 1 or 2. Their age
effect was decreasing and not increasing over time. Thus, the result of
ranged from 19 to 31 years (M = 21.92, SD = 3.4). All had normal
our experiment adds to the argument against spatioanatomical map-
or corrected-to-normal vision, and had no motor impairments and
ping, originally postulated by Wascher et al. (2001) in their visuomo-
neurological disorders. All participants but one (ambidextrous) were
tor activation account of the SRC phenomenon. Additionally, the RT
right-handed as assessed with the Edinburgh Handedness Inventory
distribution function of the correspondence effect from Experiment 2
(Oldfield, 1971).
has the shape of the j-inverted curve, and it seems that, as in the previous experiment, it is the Ridderinkhof (2002) activation-suppression model that explains this pattern of results more comprehensively.
Apparatus and stimuli Experiment 3 was carried out in the experimental setup used for Experiments 1 and 2. Responses were furnished and recorded in the
Experiment 3
same fashion as in Experiment 2. The experiment used a rectangular
The difference between this and the previous experiment concerned
size to those used in Experiments 1 and 2. In each trial, the stimulus
the feature of motion that was added to the characteristics of a stimu-
was located either on the left or on the right side of the screen (in the
lus. In Experiment 3, stimuli apart from being laterally positioned
same manner as in the previous experiments). However, Experiment 3
208
grating made up of red or green coloured vertical stripes of a similar
2013 • volume 9(4) • 202-215
http://www.ac-psych.org
Advances in Cognitive Psychology
research Article
was modified in such a manner that all vertical stripes of the grating
decreased to about 15 ms at the fifth bin. The exact values of the effect
were displaced (shifted) in one direction (left or right) with a speed of
from the shortest to the longest bin were 51, 57, 55, 44, and 15 ms. To
~18°/s within the range of the grating area. When one stripe reached
further examine the slope of the RT distributions, the sizes of the SRC
the edge of the rectangular area, it disappeared there, and a new stripe
effect were subjected to the linear regression analysis, which revealed
appeared on the opposite edge, giving the impression of constant mo-
that this effect decreased as a function of the bin, β = -4,0, t(64) = -3.48,
tion inside the rectangular aperture. The coloured moving lines were
p = .001. In fact, the curvilinear pattern of the position-referential corre-
displayed for 200 ms what means that during the stimulus presentation
spondence effect function was confirmed by the quadratic model of re-
each line travelled ~3.6°. That in turn means that about three lines left
gression, β1 = 1.20, t(62) = 2.12, p = .04; β2 = -1.63, t(62) = -2.89, p = .005.
subsequently the grating at one side, and three new lines appeared sub-
Although the results of the main ANOVA did not reveal the effect of
sequently on the other side of the grating. The task employed two co-
the motion-directional SRC, we performed the RTs distribution analy-
lours of vertical lines (red and green), two locations of the grating (left
sis for this effect. This analysis also brought insignificant results (p =
or right), and two directions of line motion (leftward or rightward),
.82). It turned out that for each bin there were similar and very small
yielding eight types of stimuli.
(approximately 3 ms) differences between congruent and incongruent conditions. This stable RTs distribution function confirms that the
Procedure
motion-directional SRC effect was absent in that experiment.
The same procedure was used here as in Experiment 2 with one
The analysis of accuracy showed no significant differences for both
exception, that is, the number of trials within each block was doubled
types of SRC. Participants reached the level of 96% of correct answers
(320 trials), because there were two types of SRC. The percentage of S-R
for position-referential SRC and 93% when there was not such congru-
position-referential congruent and incongruent trials was equal to the
ency (p = .097). For motion-directional SRC, response accuracy was at
percentage of motion-directional S-R congruent and incongruent trials.
the level of 95% for the congruent condition and 94% for the incongruent condition (p = .12).
Results First, we conducted a two-way repeated-measures ANOVA with the
Discussion
independent variables of Congruency Between Stimulus Location
Experiment 3 provided conditions that enabled eliciting two types
and Response Movement Direction (congruent vs. incongruent), and
of the SRC effects. The first SRC was related to congruency between
Congruency Between the Direction of Within Stimulus Motion and
stimulus location and the direction of response movement. In our view,
Response Movement (congruent vs. incongruent). A main effect of
in this SRC, called by us the position-referential SRC, the spatial factor
congruency between stimulus location and response movement direction was observed, F(1, 12) = 47.33, p < .001, indicating the positionreferential SRC effect. That is, correspondence between the location of
750
the stimulus and the direction of response movement led to faster RTs 750
(532 ms) as compared to the lack of such correspondence (577 ms; see
700
Table 1). It turned out that neither the main effect of motion-directional 700
SRC (i.e., congruency between the direction of within stimulus motion
650
and response movement), F(1, 12) = 1.76, p = .21, nor the interaction 650
Mean Mean RTs RTs (ms) (ms)
between these two effects were significant, F(1, 12) < 0.001, p = .99. Furthermore, as only the position-referential SRC effect was sig600
Mean RTs (ms)
nificant (i.e., congruency between stimulus location and the direction of response movement), we conducted another analysis of variance 550
with variables of Bin (1 to 5) and Congruency Between Stimulus Position and Response Movement Direction (congruent vs. incongru-
CONGRUENCY stimulus position and response movement d
CONGRUENCY of stimulus position and response movement direction
INCONGRUENC stimulus position and response movement d
INCONGRUENCY of stimulus position and response movement direction
600 550 500
500
ent). Trivially, there was a main effect of bin, F(4, 48) = 437.84, p < .001.
450
We also found a main effect of congruency, F(1, 12) = 47.17, p < .001. 450
The ANOVA also revealed a significant interaction between Bin and
400
Congruency, F(4, 48) = 19.19, p < .001, showing that for all bins, mean 400
RTs for the congruent condition were faster than for the incongruent
350
condition, and that the RT increase in the congruent condition was 350
432mscondition 493ms 538ms steeper than in the incongruent (see Figure 3).
595ms
714ms
Means of RT distribution quantiles (bins) Next, we generated the group RT distribution function (see Figu-
re 5, dotted line). Its resulting pattern for the SRC effect showed again an inverted j-shaped curve with the decreasing course. In particular, the distribution function peaked at about 57 ms at the second bin, and then
209
2013 • volume 9(4) • 202-215
432ms
493ms
538ms
595ms
714ms
Means distribution quantiles (bins) Means of of RTRTDistribution Quantiles (Bins)
Figure 3 Mean reaction times (RTs) for congruent and incongruent trials for five RT distribution quantiles (bins) from Experiment 3.
http://www.ac-psych.org
Advances in Cognitive Psychology
research Article
plays an important role. The second SRC was based on congruency
All had normal or corrected-to-normal vision, and had no motor im-
between the direction of within-stimulus motion and the direction of
pairments and neurological disorders. Handedness of participants was
response movement. We named this effect the motion-directional SRC,
assessed with the Edinburgh Handedness Inventory (Oldfield, 1971),
and within this phenomenon the motion factor is more important for
and it appeared that 10 participants were right-handed, and three par-
the stimulus-response link.
ticipants were left-handed.
Both effects were hypothesized as independent and were therefore
Apparatus and stimuli
not expected to interact. Although there was no interaction between these two effects, it was because only one of them occurred, namely,
Experiment 4 employed the same materials as Experiment 3 with
the effect of congruency between stimulus location and the direction
only one exception, namely, in this version of the task, we used a coloured
of response movement (position-referential). The other effect (motion-
sine-wave grating that was always presented in the centre of the screen.
directional), surprisingly, turned out to be non-significant.
Procedure
The distribution analysis showed that the position-referential SRC effect tended to decrease with longer RTs, although initially there was a
The procedure was the same as in Experiment 3, however, there
little increase of the size of this effect. These findings fit with the results
was one modification concerning the number of trials within each
obtained in Experiment 2. Moreover, we also found no significant ef-
block (160 trials). The percentage of trials with congruency between
fect of congruency between the direction of stimulus motion and the
within-stimulus motion and response movement was equal to the per-
direction of response movement (motion-directional). This may sug-
centage of incongruent trials.
gest that in such conditions as those used in our experiment, where these two kinds of SRC are combined, the space positional factor pro-
Results
bably dominates and determines which stimulus response congruency
RTs for correct answers were subjected to a two-way repeated-
is privileged. Thus the position-referential effect occurred at the cost
measures ANOVA with two variables: Bin (1 to 5) and Congruency
of the dissipation of the motion-directional effect. When the space
Between Stimulus Motion and Response Movement (congruent vs.
positional factor is involved (as in this case due to a particular stimulus
incongruent). There was a main effect of congruency between stimulus
location in the condition of congruency between stimulus position
motion and response movement, F(1, 12) = 12.8, p = .004, with faster
and response movement direction), it is rather the position referential
RTs when motion SRC was present (488 ms) as compared to the situa-
coding (see Bosbach et al., 2004; Nattkemper & Prinz, 2001) that is
tion without such congruency (504 ms; see Table 1). Trivially, there was
responsible for processing of the stimulus-response connection.
also a main effect of bin, F(4, 48) = 332.42, p < .001.
Experiment 4 The final experiment involved the pure motion SRC, while the space
700
positional SRC 700 was excluded. This manipulation was achieved by placing the stationary-moving stimulus in the centre of the screen in order to avoid its presentation on either side. The participants were
650
CONGRUENCY of stimulus motion and response movement direction
600
INCONGRUENCY of stimulus motion and response movement direction
650
forced to respond in the unimanual fashion by using the joystick 600 effect of congruency between within-stimulus motion direction and Mean RTs (ms)
the direction of response movement, because no spatial location was involved in 550 this task. It was hypothesized that the motion SRC effect should have a stable or increasing RT distribution function. We expected such500 RT distribution function because we suspected that this
Mean RTs Mean RTs(ms) (ms)
located centrally on the body midline. Here, we expected only the
SRC effect is based on different type of codes than the space positional
CONGRUENCY o stimulus motion and response movement dire
INCONGRUENCY stimulus motion and response movement dire
550
500
450
SRC effect, in accordance with claims of the Wiegand and Wascher 450
account (2007b). In line with their account, we claim that position-
400
referential codes are distinct to motion codes. 400
Method
Participants 350
350 389ms
442ms
482ms
527ms
641ms
Thirteen students (seven females, six males) from the same populaMeans of RT distribution quantiles (bins)
tion as in the previous experiments took part in the study in exchange for course credits. None of the volunteers participated in previous experiments. Their age ranged from 20 to 43 years (M = 26.7, SD = 7.19).
210
2013 • volume 9(4) • 202-215
389ms
442ms
482ms
527ms
641ms
Means distribution quantiles (bins) Means of of RTRTDistribution Quantiles (Bins)
Figure 4 Mean reaction times (RTs) for congruent and incongruent trials for five RT distribution quantiles (bins) from Experiment 4.
http://www.ac-psych.org
2
Advances in Cognitive Psychology
research Article
Table 1. Summary of RT Results for Different SRC Effects for Experiments 1-4
Mean RTs for congruent trials
Mean RTs for incongruent trials
Size of the SRC effect
Means of five RT distribution quantiles (bins)
Magnitudes of SRC effect for five bins
Stimulus position – Response position. Experiment 1
472 (15)
499 (16)
27
365, 428, 473, 525, 638
32, 45, 37, 23, -3
Stimulus position – Response movement direction. Experiment 2
532 (10)
564 (11)
32
434, 493, 537, 589, 690
41, 46, 44, 33, 9
Stimulus position – Response movement direction. Experiment 3
532 (11)
577 (12)
45
432, 493, 538, 595, 714
51, 57, 55, 44, 15
Stimulus motion – Response movement direction. Experiment 4
488 (16)
504 (19)
16
389, 442, 482, 527, 641
5, 10, 16, 22, 26
Type of stimulus-response correspondence
Note. RT = reaction time (in milliseconds). SCR = stimulus response correspondence. Standard deviations in parentheses.
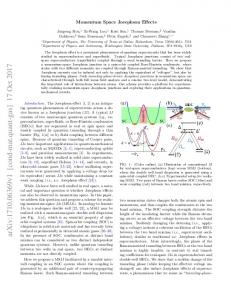
Of most interest, a significant interaction between Bin and
stimulus position - response position congruency effect (spatial SRC, Exp. 1)
70
Congruency, F(4, 48) = 4.68, p = .031, showed that for all bins, mean
stimulus position - response movement direction congruency effect (Exp. 2)
RTs for the congruent condition were faster than for the incongruent
stimulus position - response movement direction congruency effect (Exp. 3)
ent trials compared to the congruent condition was steeper for all bins
stimulus motion - response movement direction congruency effect (motion SRC, Exp. 4)
Magnitude SCR Effect (ms) Magnitude of of SRC effect (ms) 4
(see Figure stimulus position 4). - response position congruency effect (spatial SRC, Exp. 1)
Finally, we plotted the group RT distribution function (see Figu-
stimulus - responseline). movement direction SRC effect was 5, 10, 16, 22, and re 5, position dotted-dashed The motion congruency effect (Exp. 2)
60
3
condition. This time, however, the increase of mean RTs for incongru-
26 ms from the first to the fifth bin, respectively. This suggested that
stimulus position - response movement direction the congruency effect was gradually increasing with longer RTs. In fact, congruency effect (Exp. 3)
50
the linear increase of the magnitude of the motion SRC effect as RT
stimulus motion - response movement direction increased was also by the linear regression analysis, β = 0.36, congruency effect (motion SRC,confirmed Exp. 4)
40
t(64) = 3.07, p = .003. Analysis of accuracy measures showed a simple effect of congruency with better accuracy for congruent (97%) than for incongruent
30
(95%) trials; t(12) = 3.60, p = .004. 20
Discussion In Experiment 4, a robust motion SRC effect was obtained as RTs
5 10
and accuracy were affected by congruency between stimulus motion
tribution quantiles (bins)
and response movement. That is, faster and more accurate responses
0
were observed when stimulus motion and the direction of the hand movement were congruent as compared to the incongruent condi-
-10
1
2
3
4
5
RTDistribution distribution quantiles RT Quantiles(bins) (Bins)
Figure 5. Reaction time (RT) distribution functions of stimulus-response correspondence effects from Experiments 1, 2, 3, and 4. SRC = stimulus response correspondence.
211
2013 • volume 9(4) • 202-215
tion. Importantly, the motion SRC effect was observed even though stimulus motion was task irrelevant (i.e., performance of the task did not depend in any respect on taking into account in what direction the lines were moving). It seems that our experiment provides a useful and valid technique for eliciting another SRC effect, namely, the motion SRC effect which bases solely on consistency between stimulus and response movement.
http://www.ac-psych.org
Advances in Cognitive Psychology
research Article
It should be stressed that our version of the task excluded the po-
effect). Positional incongruence between the stimulus and response,
sitional factor as neither the stimulus nor the response was located on
which was task irrelevant, resulted in slower RTs compared to the
the lateral side. Although this motion SRC effect is not large in size
condition in which the location of the stimulus and response corre-
(16 ms) as compared to the space positional SRC effect (27 ms) from
sponded. Results of our replication of the Simon task are consistent
control Experiment 1, it seems that the results obtained in Experi-
with a considerable body of evidence (see Hommel, 2011; Proctor &
ment 4 are robust.
Vu, 2006). Also, the distribution analysis conducted on RTs obtained
Of particular interest is how the motion SRC effect changes as a
in Experiment 1 showed results consistent with findings from other
function of the response speed. The distribution analysis demonstrated
studies. Generally, this analysis shows that the Simon effect decreased
the gradual and pronounced increase of the difference between the
over time. That is, the differences between corresponding and non-
motion incongruent and congruent trials over time, which is reflected
corresponding trials are larger for the fast RT bins than for the slow
in a positive slope of the difference plot. This finding is consistent with
RT bins. This result was repeatedly observed in other studies (see
the original visuomotor activation model, which implicates a flat or
Proctor et al., 2011). There are two non-mutually exclusive theories
increasing distribution function of the SRC effect when the response
that account for the decreasing function of the Simon effect, namely,
is given unimanually. Although this claim was undermined by results
the visuomotor activation hypothesis of Washer et al. (2001) and the
from various studies on SRC (e.g., Buetti & Kerzel, 2008; Proctor & Vu,
activation-suppression hypothesis of Ridderinkhof (2002). Inspection
2010; Wiegand & Wascher, 2007b), one important issue needs to be
of the j-shaped curvilinear RT distribution function of the Simon effect
discussed here. It might be the confounding role of the spatial factor
magnitude from Experiment 1 indicates that it is rather Ridderinkhof ’s
(in the form of lateral stimulus location) that is responsible for the oc-
model (see the Introduction section) that better accounts for this shape
currence of the decreasing distribution function in studies with unima-
of RT distribution function of the spatial SRC effect.
nual responses. To some extent the claim about the confounding role
In Experiment 2, another kind of the SRC effect was demonstrated:
of laterally located stimuli with one hand responses receives support
Congruency between stimulus position and the direction of the
in the results of the direction selection condition in Experiment 1 by
unimanual response movement resulted in faster RTs compared to the
Buetti and Kerzel (2008). In their experiment, participants responded
condition without such congruency. The analysis of the RT distribu-
with one hand to horizontally or vertically organized stimuli. For the
tion function of this SRC effect revealed a decreasing tendency similar
horizontal direction condition, the stimulus could be located to the left
to that obtained in Experiment 1. It seems that the shape of the RT dis-
or to the right of the fixation point, whereas in the case of a vertical di-
tribution function of this effect is also explained by the Ridderinkhof
rection condition, the stimulus was placed above or below the fixation
account.
point, thus in the midline. A decreasing SRC effect function was ob-
Experiment 3 used experimental conditions where two types of
tained for the horizontal stimulus and response location, whereas a flat
stimulus response congruency were possible. In particular, the direc-
(i.e., not decreasing) function occurred when the stimuli and responses
tion of the unimanual response movement could be congruent with
were arranged vertically. Thus, when the stimulus was not located on
stimulus location and/or stimulus motion direction, while both fea-
the left or the right side, there was no decreasing distribution function.
tures of the stimulus were task irrelevant. It turned out that only one
The spatial factor in the form of the lateral location of the stimulus may
SRC effect occurred: the effect related to congruency between stimulus
thus determine the decreasing function.
location and the direction of response movement (i.e., the same SRC
Nonetheless, the most important finding revealed in this experi-
effect as in Experiment 2). The RT distribution function of this effect
ment is that the pure motion SRC effect occurs (i.e., it is a real phe-
was also decreasing as in the previous experiment. Interestingly, the ef-
nomenon) and the size of this effect increases over time. Although it
fect of congruency between stimulus motion and response movement
is possible that the spatial factor (stimulus location) is a confounding
(the motion SRC effect) was absent.
variable that may play a role in determining whether the distribution
It seems that when there is more than one type of SRC in a single
function is decreasing or increasing, we think that it is something else
task, one dominates and overrides the other. Additionally, the domi-
that determines why the space positional SRC effect and the motion
nating SRC is based on positional features of the stimulus (i.e., its lateral
SRC effect have different distribution functions. We tentatively suggest
location). Thus, we suggest that position coding may play an important
that the differences in the distribution functions for the space posi-
role in the processes underlying stimulus-response congruency.
tional and motion SRC effects reflect two qualitatively different types
The motion-based SRC effect was obtained in the last experiment
of codes that underlie the occurrence of these phenomena, which we
when the space positional factor was excluded, since stimulus and re-
will discuss in turn.
sponse positions were not lateralized. This manipulation allowed the pure motion SRC effect to occur. This effect was obtained in conditions
General discussion
where there was congruency or incongruence between the stimulus
In the current study, we compared the space positional SRC effect and
stimulus motion congruent with the unimanual response movement
the motion SRC effect using RT distribution analysis. Experiment 1
direction resulted in faster and more accurate responses as compared
showed a robust space positional SRC effect (i.e., the classic Simon
to motion incongruence. This effect represents another example of the
212
2013 • volume 9(4) • 202-215
and response motion features present. The task irrelevant direction of
http://www.ac-psych.org
Advances in Cognitive Psychology
research Article
SRC phenomenon. In fact, the pure motion SRC effect is distinct from
of mean RTs for unimanual responses performed by right-handed
another SRC related phenomenon, namely, the motion-based Simon
participants in Experiment 4 (joystick movements) and mean RTs for
effect. Since the latter is a combination of the positional and motion
responses given by right-handed participants with their right-hands
factors, it is difficult to understand the nature of this particular effect.
in Experiment 1 (button presses). In the first case, they amounted to
The manipulation employed in our experiment allowed separating
498 ms, while in the latter to 479 ms. Also, mean RTs for responses per-
these factors and helped to understand better the characteristics of the
formed by right-handed participants using a joystick in Experiment 2,
SRC phenomena.
where stimuli were the same as in Experiment 1, were longer (548 ms)
The current research provides a paradigm for eliciting the SRC ef-
than mean RTs for button press responses. These data give support to
fects linked to motion congruency that uses only consistency between
the idea that moving a joystick is a more complex motor activity (and
movements of the stimulus and response, but does not involve space
thus requires more information processing) than a simple button press.
positional confounds. In addition, the motion SRC effect elicited by
Altogether, this suggests that more cognitive mechanisms are engaged
our task underlines the importance of both aspects of SRC phenomena,
in the motion SRC effect as compared to the space positional SRC, and
such as movements of both the stimulus and the response. These find-
as Wiegand and Wascher (2005) suggest, these cognitive mechanisms
ings support Hommel’s (2011) view that either a stimulus or response
are responsible for an increasing RT distribution function of the mo-
may have the same impact on S-R interconnections. In his review,
tion SRC effect.
Hommel (2011) stresses that many studies focus mainly on perceptual
There is also another possible factor that might be responsible for
processing linked with attention or spatial coding, while they tend to
the occurrence of larger motion SRC effect with slower than with faster
ignore some important aspects of the response and motor information
responses. As motion is defined as a change of location across time, it is
processing. Our motion SRC design resolved this methodological issue
logical that it takes time to perceive any motion. Very quick responses
by treating these factors as equally important.
to the colour may cause that motion is not perceived and processed.
To our knowledge, there are no reports that have taken into ac-
Only with slower responses motion of the stimulus is detected. Hence,
count the RT distribution analysis for the motion SRC effect like the
the correspondence effect between stimulus motion and the response
one elicited in Experiment 4, indicating in fact the opposite result as
movement is able to arise at a later stage when the motion is processed.
compared to the distribution function in the standard Simon effect (i.e.,
Although the idea of time competition between different types of codes
space positional SRC), as found in Experiment 1. In particular, the RT
received some support (see Ansorge, 2003), further studies will help to
distribution function of the motion SRC effect had a linear shape with
verify this claim.
a positive slope indicating that differences between stimulus-response
In conclusion, the current study seems to support the idea that the
motion congruent and incongruent trials increased with longer RTs. In
space positional SRC effect (the classic Simon effect) and the motion
our view, this fact of different distribution functions of the space posi-
SRC effect represent two distinct SRC phenomena. This observation
tional and motion SRC effects reveals that they are different in nature,
is supported by different shapes of the RT distribution functions, sug-
which supports our hypothesis based on reasoning similar to that of
gesting involvement of two qualitatively different mechanisms.
De Jong et al. (1994), stating that if two effects operate using different processes, it should be reflected in different distribution functions.
Acknowledgments
In our view, the different characteristics of the time course of the
We wish to thank Dirk Kerzel, Rob van der Lubbe, and three
spatial SRC and motion SRC effects reflect their different underlying
anonymous reviewers for helpful comments on a former version of the
mechanisms. For instance, Wiegand and Wascher (2005, 2007a, 2007b)
manuscript. This work was supported by University of Social Science
suggest that there are two types of mechanisms that are involved in the
and Humanities, Poland (grant No. BST/WROC/2011/08d).
SRC phenomena. The first mechanism is the visuomotor automatic activation related to spatial anatomical mapping, which is responsible
References
for the occurrence of the transient spatial SRC effect (i.e., the classic
Ansorge, U. (2003). Influences of response-activating stimuli and
Simon effect). Sustained SRC effects (i.e., effects for which stable or
passage of time on the Simon effect. Psychological Research,
increasing distribution functions are found) involve more cognitive
67, 174-183. doi: 10.1007/s00426-002-0115-4
mechanisms, as Wiegand and Wascher’s assumption posits. We state
Bosbach, S., Prinz, W., & Kerzel, D. (2004). A Simon effect
that the motion SRC effect from Experiment 4 employs more complex
with stationary moving stimuli. Journal of Experimental
cognitive mechanisms as compared to the visuomotor activation in-
Psychology: Human Perception and Performance, 30, 39-55. doi:
volved in the space positional SRC effect. The motion feature provides
10.1037/0096-1523.30.1.39
more complex information about the stimulus than the mere positional
Bosbach, S., Prinz, W., & Kerzel, D. (2005). Is direction position?
information, because encoding object motion requires processing of
Position- and direction-based correspondence effects in tasks
space-time information (see Bruce, Green, & Georgeson 2003). Also,
with moving stimuli. The Quarterly Journal of Experimental
performance of the leftward or rightward joystick movements seems
Psychology, 57A, 1-40. doi: 10.1080/02724980443000016
to be a more complex motor activity engaging more cognitive proces-
Bruce, V., Green, P. R., & Georgeson, M. A. (2003). Visual perception.
ses than a mere button press. This is supported by the comparison
Physiology, psychology, and ecology. Hove: Psychology Press.
213
2013 • volume 9(4) • 202-215
http://www.ac-psych.org
Advances in Cognitive Psychology
research Article
Buetti, S., & Kerzel, D. (2008). Time course of the Simon effect in pointing movements for horizontal, vertical, and acoustic stimuli: Evidence for a common mechanism. Acta Psychologica, 129, 420-428. doi: 10.1016/j.actpsy.2008.09.007 Davranche, K., & McMorris, T. (2009). Specific effects of acute moderate exercise on cognitive control. Brain and Cognition, 69, 565-570. doi: 10.1016/j.bandc.2008.12.001 De Jong, R., Liang, C.-C., & Lauber, E. (1994). Conditional and unconditional automaticity: A dual process model of effects
tial stimulus codes. Psychological Research, 56, 144-150. doi: 10.1007/BF00419701 Oldfield, R. C. (1971). The assessment and analysis of handedness: The Edinburgh Inventory. Neuropsychologia, 9, 97-113. doi: 10.1016/0028-3932(71)90067-4 Pellicano, A., Lugli, L., Baroni, G., & Nicoletti, R. (2009). The Simon effect with conventional signals: A time-course analysis. Experimental Psychology, 56, 219-227. doi: 10.1027/1618-3169 .56.4.219
of spatial stimulus-response correspondence. Journal of
Proctor, R. W., Miles, J. D., & Baroni, G. (2011). Reaction time dis-
Experimental Psychology: Human Perception and Performance,
tribution analysis of spatial correspondence effects. Psycho-
20, 731-750. doi: 10.1037/0096-1523.20.4.731
nomic Bulletin & Review, 18, 242-266. doi: 10.3758/s13423-011-
Figliozzi, F., Silvetti, M., Rubichi, S., & Doricchi, F. (2010).
0053-5
Determining priority between attentional and referential-
Proctor, R. W., & Vu, K.-P. L. (2006). Stimulus-response compatibility
coding sources of the Simon effect through optokinetic
principles: Data, theory, and application. Boca Raton, FL: CRC Press.
stimulation. Neuropsychologia, 48, 1011-1015. doi: 0.1016/j.
Proctor, R. W., & Vu, K.-P. L. (2010). Stimulus-response compa-
neuropsychologia.2009.11.025 Galashan, D., Wittfoth, M., Fehr, T., & Herrmann, M. (2008). Two Simon tasks with different sources of conflict: An ERP study of
tibility for mixed mappings and tasks with unique responses. Quarterly Journal of Experimental Psychology, 63, 320-340. doi: 10.1080/17470210902925270
motion- and location-based compatibility effects. Biological
Proctor, R. W., Vu, K.-P. L., & Nicoletti, R. (2003). Does right–left
Psychology, 78, 246-252. doi: 10.1016/j.biopsycho.2008.03.
prevalence occur for the Simon effect? Perception &
008
Psychophysics, 65, 1318-1329. doi: 10.3758/BF03194855
Gevers, W., Caessens, B., & Fias, W. (2005). Towards a common
Ridderinkhof, K. R. (2002). Activation and suppression in conflict
processing architecture underlying Simon and SNARC effects.
tasks: Empirical clarification through distributional analyses. In
European Journal of Cognitive Psychology, 17, 659-673. doi:
W. Prinz, & B. Hommel (Eds.), Common mechanisms in percep-
10.1080/09541440540000112
tion and action: Attention and performance XIX (pp. 494-519).
Gevers, W., Ratinckx, E., De Baene, W., & Fias, W. (2006). Further
New York, NY: Oxford University Press.
evidence that the SNARC effect is processed along a dual-route
Ridderinkhof, K. R., van den Wildenberg, W. P. M., Wijnen, J., &
architecture. Evidence from the lateralized readiness potential.
Burle, B. (2004). Response inhibition in conflict tasks is re-
Experimental Psychology, 53, 58-68. doi: 10.1027/1618-3169
vealed in delta plots. In M. Posner (Ed.), Cognitive neuroscience of attention (pp. 389-377). New York, NY: Guilford Press.
.53.1.58 Hommel, B. (1994). Spontaneous decay of response-code ac-
Roswarski, T. E., & Proctor, W. (2003). Intrahemispherical ac-
tivation. Psychological Research, 56, 261-268. doi: 10.1007//
tivation, visuomotor transmission, and the Simon effect:
BF00419656
Comment on Wascher et al. (2001). Journal of Experimental
Hommel, B. (2011). Simon effect as tool and heuristic. Acta Psychologica, 136, 189-202. doi: 10.1016/j.actpsy.2010.04. 011
Psychology: Human Perception and Performance, 29, 152-158. doi: 10.1037/0096-1523.29.1.152 Simon, J. R. (1990). The effects of an irrelevant directional cue on
Hommel, B., Müssler, J., Aschersleben, G., & Prinz, W. (2001). The
human information processing. In R. W. Proctor & T. G. Reeve
Theory of Event Coding (TEC): A framework for perception and
(Eds.), Stimulus-response compatibility: An integrated perspec-
action planning. Behavioral and Brain Sciences, 24, 849-937. doi: 10.1017/S0140525X01000103
tive (pp. 31-86). Amsterdam: North-Holland. Simon, J. R., & Rudell, A. P. (1967). Auditory S-R compatibility:
Kornblum, S., Hasbroucq, T., & Osman, A. (1990). Dimensional
The effect of an irrelevant cue on information processing.
overlap: Cognitive basis for stimulus-response compatibility
Journal of Experimental Psychology, 51, 300-304. doi: 10.1037/
– A model and taxonomy. Psychological Review, 97, 253-270. doi: 10.1037/0033-295X.97.2.253
h0020586 Vallesi, A., Mapelli, D., Schiff, S., Amodio, P., & Umiltà, C. (2005).
Mapelli, D., Rusconi, E., & Umiltà, C. (2003). The SNARC effect:
Horizontal and vertical Simon effect: Different underly-
An instance of the Simon effect? Cognition, 88, B1-B10. doi:
ing mechanisms? Cognition, 96, B33-B43. doi: 10.1016/j.
10.1016/S0010-0277(03)00042-8
cognition.2004.11.009
Nattkemper, D., & Prinz, W. (2001). Impact of task demands on spa-
Van der Lubbe, R., Abrahamse, E., & De Kleine, E. (2012). The pre-
tial stimulus-response compatibility. Zeitschrift für Psychologie,
motor theory of attention as an account for the Simon effect.
209, 205-226. doi: 10.1026//0044-3409.209.3.205
Acta Psychologica, 140, 25-34. doi: 10.1016/j.actpsy.2012.01.
Nicoletti, R., & Umiltà, C. (1994). Attention shifts produce spa-
214
2013 • volume 9(4) • 202-215
011
http://www.ac-psych.org
Advances in Cognitive Psychology
research Article
Van der Lubbe, R., Jaśkowski, P., & Verleger, R. (2005). Mechanisms
Wiegand, K., & Wascher, E. (2007a). Response coding in the Simon
underlying spatial coding in a multiple-item Simon task.
task. Psychological Research, 71, 401-410. doi: 10.1007/s00426-
Psychological Research, 69, 179-190. doi: 10.1007/s00426-004
005-0027-1
-0176-7
Wiegand, K., & Wascher, E. (2007b). The Simon effect for vertical
Van der Lubbe, R., & Verleger, R. (2002). Aging and the
S-R relations: Changing the mechanism by randomly varying
Simon task. Psychophysiology, 39, 100-110. doi: 10.1017.
the S-R mapping rule? Psychological Research, 71, 219-233.
S0048577201020042
doi: 10.1007/s00426-005-0023-5
Wascher, E., Schatz, U., Kuder, T., & Verleger, R. (2001). Validity
Wittfoth, M., Buck, D., Fahle, M., & Herrmann, M. (2006).
and boundary conditions of automatic response activation
Comparison of two Simon tasks: Neuronal correlates of conflict
in the Simon task. Journal of Experimental Psychology: Human
resolution based on coherent motion perception. NeuroImage,
Perception and Performance, 27, 731-751. doi: 10.1037//0096-
32, 921-929. doi: 10.1016/j.neuroimage.2006.03.034
1523.27.3.731
Zhang, J., & Kornblum, S. (1997). Distributional analysis and
Wiegand, K., & Wascher, E. (2005). Dynamic aspects of stimulus-
De Jong, Liang, and Lauber’s (1994) dual-process model of
response correspondence: Evidence for two mechanisms in-
the Simon effect. Journal of Experimental Psychology: Human
volved in the Simon effect. Journal of Experimental Psychology:
Perception and Performance, 23, 1543-1551. doi: 10.1037/0096-
Human Perception and Performance, 31, 453-464. doi:
1523.23.5.1543
10.1037/0096-1523.31.3.453
215
2013 • volume 9(4) • 202-215
Received 22.02.2013 | Accepted 26.08.2013
http://www.ac-psych.org