PAPER REF # 8162 Proceedings: Eighth International Space Syntax Symposium Edited by M. Greene, J. Reyes and A. Castro. Santiago de Chile: PUC, 2012.
SPACE SYNTAX ECONOMICS: decoding accessibility using property value and housing price in Cardiff, Wales AUTHOR:
Laura NARVAEZ University College London, The Bartlett School of Graduate Studies, United Kingdom e‐mail:
[email protected]
KEYWORDS:
Economics, Accessibility, Property Value, House Price
THEME:
Urban Space and Social Phenomena
Alan PENN University College London, The Bartlett School of Graduate Studies, United Kingdom e‐mail:
[email protected] Sam GRIFFITHS University College London, The Bartlett School of Graduate Studies, United Kingdom e‐mail:
[email protected]
Abstract This paper investigates the role of spatial parameters in relation to economic properties embedded in the city’s urban form. The key element to explore in the study of the configuration of space is accessibility. The role of markets has always been a factor of constant transformation that influence how a city develops and functions at different scales. Markets function as institutions in which price it the main indicator of people’s choices and the spatial effects that these choices generate, that is, a signal of how people assign a value to different resources. Accessibility, in this case, is seen here not only as a spatial component to measure geometric patterns but also as a resource that produces multiplied values of benefits and transactions in terms of economic properties. It is proposed to explore three economic variables applied in the city of Cardiff, Wales. These variables are council tax band, sold house prices and average price for each housing typology. The method used to test each of these variables is by using Space Syntax analysis with the purpose to unfold the measure of accessibility within specific markets, which in this case it is only considered residential properties. Council tax band is measured only with a sample of two postcode districts of Cardiff related to integration measures, which show differences in relation to local accessibility and size of urban blocks. Sold house prices are studied within a period of 3 years proving that there is a clear relation of tax banding and the price paid of properties. Overall, the paper aims to explore, as a first stage of the research, how specific measures of economic variables have an effect on how space is formed through these kinds of processes, in which the size of a city, its particular morphology and its allocation of land uses are aspects that rule a city’s economic vitality and constant reform.
8162:1
Proceedings: Eighth International Space Syntax Symposium Santiago de Chile: PUC, 2012.
INTRODUCTION This research aims to explore how the configuration of the built form is understood in the perspective of urban economy. Spatial configuration and movement in an urban system focuses on how space is implicated in organising human activity that is embedded in the real‐world. The urban form underlies a market structure that influences different types of behaviour in the urban life of a city. The built form also underlies a market structure, which implicates a city’s needs to constantly evolve and transform through time, seeking for a better quality of life. The purpose of this paper is to bring to the fore how the configuration of space works with different parameters of specific economic values. It is an exploration of how street network –an important feature in urban design and spatial planning‐ functions as a resource that is priced within the globalization of economy and valued within a city’s own needs. Therefore, spatial configuration and different economic values are studied in order to explore the relationship between these factors. The main feature to be studied at this first stage of the research is the parameter of spatial accessibility. As an analytical theory, Space Syntax measures and identifies changes in the configuration of urban form, using accessibility as a main variable for its analyses. It is concerned about how connections and boundaries of spaces define the way people use and behave within them, and how they relate to one another. Within the study of how space impacts on society, the built space is to be understood as relational patterns of connections and interfaces. Hillier and Hanson (1984) made the distinction that underlying structures of space carry patterns of behaviour, which have a social function. Within the process of analysing how an urban system behaves according to its social functions, the corollary theory of Space Syntax literature is that spatial configuration governs the distribution of movement (Penn, et al, 1993). Movement is understood as the way to predict how people move and tend to use space dependant on configuration. The structure of the street network determines movement, and because street networks (grid configuration) shape movement it also generates land use patterns. In the changes of street connectivity attracting more people, this tends to attract retail and other land uses that depend on the volume of pedestrian traffic, and consequently the density of pedestrian movement and uses are multiplied (Hillier, 1996a). Economic values follow this process as well. If movement economies are based on the ‘multiplier effect’ that results from movement flows determined by the configuration of the grid, then it is argued that spatial configuration can determine price. DECODING ACCESSIBILITY Accessibility is a concept that has been fundamental for planning and design. Hansen (1959) described this concept as a means to measure relative nearness or proximity of one place/person to all other places/persons. Often, accessibility is seen as a measure of cost of getting from one destination to another, a trade‐off of benefits received once the destination is reached. It is defined as the simplicity with which activities in the society can be reached, including trade and public services that reflect the needs of the community. Distance measures are the simplest way of measuring accessibility, counting the distance from one location to different opportunities, in which the prime cost is time. This paper, however, considers accessibility not only as a measure of distance (connectivity), but it is also a distance that becomes a resource, in which the cost relates to the multiplied processes of density, distribution of land uses and the price to those spaces. Hence, the importance that accessibility functions as an (added) value in the spatial structure and that markets work as institutions that define a value of a resource. This value is a balance
8162:2
Proceedings: Eighth International Space Syntax Symposium Santiago de Chile: PUC, 2012.
between the satisfaction of needs (benefits) and the use of resources (expenditures) that consequently structures space (how we design) and defines place (urbanity). Accessibility as Space and Resource The syntax of accessibility is based on how we can understand the configuration of space in all its forms, as: space, society, culture, environmental, and economic form. Research (Webster, 2009) has proposed that accessibility can be priced and by doing so it could be allocated more efficiently. Furthermore, it considers an important urban public good: connectivity. Land value, for example, is a good indicator of pricing spatial accessibility because it derives from a general connectivity. According to Webster, accessibility can be priced by measuring it through different price mechanisms by distinguishing between access as a spatial (general) measure and access as an economic (special) measure. Batty (2009) argues that there are several issues that make important the measure of accessibility. He proposes, firstly, that measuring accessibility is a matter of scale. Secondly, is the difference between measuring the accessibility of how individuals behave in respect to economic and social activities, and how individuals implicitly react to the physical environment. The physical structure is mainly what we consider as the street network and the clusters of buildings. In this sense, we can consider how the aspect of scale is important from activities to infrastructure, where movement, opportunities, and interactions take place and relate to each other. Another recent study (Marcus, 2010) proposes an analytical theory of urbanism relating urban form and urban life with the social aspect in which it is called ‘urbanity’. By introducing Space Syntax analysis, the importance of this research is that it gives an added value to the relation of accessibility and diversity, proposed as a ‘spatial capital’. Spatial capital as a measure of urbanity: the higher accessibility, and higher diversity, the higher spatial capital. This can inform and measure how variables in the configuration of space acts as a determinant of giving an added value far more than spatial components. Following the idea of accessibility and spatial value, the idea of diversity is important. It is precisely diversity that results from the changes and patterns of economic properties. Diversity is also considered as an ‘added value’ to the configuration of space. Measuring diversity informs how spatial properties, socio‐economic, and cultural processes work together; it relates how the community perceives space (Penn & Perdikogianni, 2005). This has economic implications because it comprises diverse spatial structures in the urban network. There is a variety sense of behaviours (socially, culturally and economically), and space itself gives information on how people perceive the environment. The value of accessibility in the terms of diversity can help understand macro socio‐economic processes in the city. In terms of urban morphology, accessibility has an interesting relation on the effects of economic properties. The concept of fringe belt proposed firstly by Conzen (1960) and through contributions of J.W.R. Whitehand (1972) are clear examples of this. Firstly, the fringe belt model is based on the idea that the city as a physical entity has been created by a series of growth periods, rapid or slow growth. As a result, distinctive regions emerge at the edge of an urban area, and then embedded within it. This is what Conzen (1960) called a fringe belt, as “a belt‐like zone originating from the temporarily stationary or very slowly advancing of a town and composed of a characteristic mixture of land‐use units initially seeking a peripheral location.” The major contribution comes from Whitehand (1972). He linked the concept of fringe‐belt to neo‐classical economics ‘trade‐off’ model (land rent theories), showing the relationship between bid rent and distance from the edge of built‐up area. He employs the concept of bid rent curves to explain why demand for land,
8162:3
Proceedings: Eighth International Space Syntax Symposium Santiago de Chile: PUC, 2012.
and therefore, land‐use patterns, varies across an urban area. His theory is based on the changes that occur on the edge of the city, where land is developing from rural to urban land use. In the spectrum of land economy theory, classical economists (Ricardo, 1817; Henrich von Thunen, 1826; Alonso, 1964) have proposed with the spatial trade‐off’s of how different groups of land place different values on a city’s geometric accessibility. Von Thunen’s contribution (1826) was an agricultural land use model, which illustrates the balance between land cost and transportation costs. The city as a marketplace here is seen as a generator of value through distance relationships. Alonso’s model (1964) is grounded on the basis of bid rent theory, in which the urban user seeks central locations, but is willing to accept to be located further away from the and the variations of income used on land and transport costs, as well as goods and services. In more simple terms, Alonso’s model describes the spatial patterns of land value. The model produces equilibrium for the distance from the Central Business District (CBD), meaning the central area of a city and size of land occupied by mainly three land uses (residential, firms, and agriculture). Other related theories, such as the Central Place Theory (Christaller, 1933; and further developed by Krugman, 1995), have proposed the idea of location that relates to size and the distribution of settlements within a system. It is about how settlements are located in relation to one another, size market that a central place can control, and why central places function in different typologies (a town, a city, a village). Accessibility, then, offers a value that can be measurable in terms of how different types of land use are priced depending on their location and accessibility to its central area. Integrated and segregated street patterns, as understood in Space Syntax literature (Penn, et al, 1998: Hillier, et al, 1993, 1999b, 2005, 2007) also respond to how markets behave depending on the structure of the grid. Markets behave according to what the demand and supply needs are informing at a specific location and proximities. For example, main roads that tend to be have higher accessibility and higher diversity of uses have specific markets that are regulated for specific purposes–and different‐ from secondary roads, which tend to be more segregated from the builtup area. Neighbourhoods tend to be more private, and therefore, more segregated. However, segregation does not necessarily mean a negative outcome of markets. It is the market itself that positions on what it is more profitable depending on its location. Neighbourhoods will respond to a higher value of accessibility not only in terms of street network but also in terms of accessible services by being more segregated and markets for that specific targets will locate themselves in such areas. METHOD Within the theoretical background in Space Syntax literature, this paper considers important studies that relate socio‐economic properties and the impacts of strategic urban design. The i‐VALUL project, part of a large research development called UrbanBuzz Programme (http://www.urbanbuzz.org), explored the value of urban layout through different perspectives. It is an evidence‐based method to study the spatial and physical components that influence urban value, both in social and economic ways. The purpose relies on improving street layout design and provides knowledge to enable stakeholders to predict the response to policy implementation and the economic returns to be gained from investing in high quality layouts (primarily residential and town centre). One of the studies within this project was studying spatial analysis with residential property value patterns (Chiaradia, et al, 2009a), in which council tax band values are used as a proxy of property price, The study comprised a large sample of single and multiple dwellings in an outer Borough of north London, showing a relationship between locational indexing of street layout, property size, housing density, age and property value using space syntax analysis and council tax band values. The results
8162:4
Proceedings: Eighth International Space Syntax Symposium Santiago de Chile: PUC, 2012.
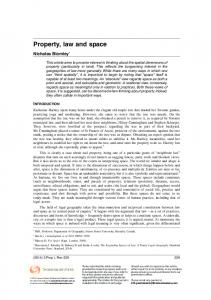
showed that council tax band is strongly and positively related to global integration (clustering). The higher tax property values the higher the integration value. This relationship varies across different metric radii. At a more local level (R300m) high tax properties have less local accessibility than low tax properties. Furthermore, the association with street segment length showed that high tax properties tend to form part of larger urban blocks than low tax properties (Hillier, et al, 2008, KIT4‐UrbanBuzz). This paper explores three economic properties using space syntax analysis: council tax band, sold house prices and average prices per housing typology. In the first set of the analysis, council tax band values are used, and based on existing research mentioned earlier, and the method used in the study of the Urban Buzz programme is tested and applied in the city of Cardiff, Wales. In this case, and as a first stage of the research, it is considered only on a sample of +24,000 dwellings that make two postcode districts (CF10, CF11), both located in the central area of Cardiff. The spatial variables considered where measures of integration at different metric radii, choice, and segment length. The second set of analysis refers to sold house prices, in which it was taken the price paid of all properties sold in the last three years (2008, 2009, 2010). These values where related to the same spatial variables and grouped in their corresponding council tax band. Thirdly, the last set of analysis considers the average prices for every housing typology (detached, semi‐detached, terraced, and flats). These average prices are considered at a postcode sector level or neighbourhood (i.e. CF10 1) in a period of one year (2010). For each sector it was created a 500‐metre buffer in order to have a more precise measure of the spatial variables, considering that within a postcode sector there are approximately 3,000 addresses (http://www.mrs.org.uk/standards/downloads/postcodeformat.pdf). The method is divided in two sections: First, background and profile of the case study. Second, the three tested analyses explained and their results. 1. CARDIFF, WALES Historically, Cardiff’s growth over time responded to a continuing processes of growth by decentralising. This process of growth in the outer areas of the city was accomplished by extensions of the borough’s boundaries. The decentralisation occurs because habitants lived in the two parishes, which had constituted the town in the mid nineteenth century. Recent planning and urban regeneration policies tried to stem this flow, in terms of attracting residents back to the city centre and Cardiff Bay. The form in which this decentralisation took was distinctive: mainly it was a response of housing affordability, the city constructed large areas of low density council housing from the late 1920s until 1960s, predominantly on the west and east side of the city. (Hooper & Punter, 2006). This was accomplished by the suburban growth of private housing developed in the north of the city; private housing became to dominate in the 1980s and 1990s. However, this distinction of decentralised growth marks a footprint in the configuration of the city (Figure 1). Future development that seeks to have an industrial expansion is the reclamation and redevelopment of the waterfront strip in 1977. Urban regeneration activity in the city was to highlight the theme of dockland redevelopment, institutionalised in the form of the Cardiff Bay Development Corporation (1987‐2000). New developments such as the Millennium Stadium, the Bay Area redevelopment (mainly as residential usage) and the booming of retail activity of major shopping malls in the city centre has made Cardiff an important city‐capital by its economic growth and its urban competitiveness.
8162:5
Proceedings: Eighth International Space Syntax Symposium Santiago de Chile: PUC, 2012.
Figure 1. Cardiff street network – Segment Choice Rn (Overlap Path)
1.1 Profile With a population of 341,054, Cardiff has an area of 6.652 km2 with a density of 4,392/km2 and a household average size of 2.41. The age structure (2009) is relatively young age with more than 21% of the total population are aged between 20 and 29. Of particular significance is the effect of Cardiff’s student population who now represent over 10% of the city’s residents. Most full‐time students are aged between 18‐29 (http://www.statistics.gov.uk/census2001/profiles/00pt.asp). The total number of households is 127,476, in which the three major types of dwellings in the city are terraced (34%), semi‐detached (31%) and detached (14%), most of them owned outright (34%) and mortgaged tenures (37%) (Table 1 and Table 2). In terms of transportation, 82,079 commute by car and 16,930 travels to work by using public transport.
8162:6
Proceedings: Eighth International Space Syntax Symposium Santiago de Chile: PUC, 2012.
DWELLING TYPE (%)
Cardiff South
Cardiff Central
Cardiff North
Cardiff West
Cardiff Total
9.20 31.18 38.06 16.39 4.04 0.98 0.15
10.10 18.27 45.27 13.26 11.60 1.45 0.05
22.42 44.29 20.76 10.44 1.37 0.69 0.03
12.50 31.98 34.68 14.16 5.64 0.86 0.19
14.28 31.78 34.44 13.28 5.16 0.95 0.11
Detached Semi‐Detached Terraced Flat (purpose built) Flat (conversion) Flat (commercial building) Temporary
Table 1. Dwelling Types. Census 2001 – Key Statistics for Cardiff and Wales (Office for National Statistics UK)
TENURE (%) Owned outright Mortgaged Part rented/Part mortgaged Council rented Housing Association rented Private rented Other rented
Cardiff South
Cardiff Central
Cardiff North
Cardiff West
Cardiff Total
25.71 39.21 0.68 13.86 9.48 7.70 3.37
26.64 36.29 0.52 5.04 6.86 21.47 3.20
35.69 46.84 0.75 6.32 3.26 4.87 2.26
28.17 41.02 0.64 10.34 6.60 10.12 3.11
33.9 36.85 0.49 13.73 4.17 7.43 3.34
Table 2. Housing Tenure. Census 2001 – Key Statistics for Cardiff and Wales (Office for National Statistics UK)
NORTH
WEST
CENTRAL
SOUTH
8162:7
Proceedings: Eighth International Space Syntax Symposium Santiago de Chile: PUC, 2012.
2. ANALYSES AND RESULTS This section shows the three economic variables tested using segment angular integration in the all cases. Figure 2 shows Cardiff at a global segment angular integration where its shows how the main artery of the city crosses the central area from West to East side of the city, being this the most highly integrated where the main retail and commercial activities take place. The global accessibility takes place in its main roads as well as the centre of the city, which is marked by its high density of retail activity. The north and south areas, where most of the residential usage remains, is still highly connected by main roads linked to the main and most accessible artery. At a more local level with a radius of 800 metres, the main roads on the west and east side of the central area become more locally accessible (Figure 3).
Figure 2. Cardiff street network – Segment Angular Integration (Rn)
8162:8
Proceedings: Eighth International Space Syntax Symposium Santiago de Chile: PUC, 2012.
Figure 3. Segment angular integration R800m – Central Area
2.1 Council Tax Band Council tax is a form of taxation that is undertaken by the Valuation Office Agency (VOA), part of the UK government agencies. This form of taxation is payable of each domestic property and the amount payable depends on the value of the property. It was introduced in England and Wales in 1993 to replace the Community Charge and bands are based on property value at 1st of April 1991. However, council tax bands for Wales were re‐valued from 1 April 2005. Bands were adjusted to reflect 2003 values and an extra band was added. “The purpose of the revaluation was to keep the assessments of houses in line with fluctuations in the property market. There was no change in the way homes were values for council tax.” (http://www.voa.gov.uk). The purpose of considering council tax banding as one of the variables of this research is to consider how taxation is a form of how property is priced, depending on its location and the price paid (or sold prices) that are made. This data will show only two district areas, CF10 and CF11 (Figure 4) of council tax values (Table 3). However, research is still being conducted for the whole city of Cardiff. An observation‐based land use survey was conducted in two central areas, in which the main use is commercial and retail in the City Centre (Figure 5) and new developments of residential usage in the Bay Area.
8162:9
Proceedings: Eighth International Space Syntax Symposium Santiago de Chile: PUC, 2012.
Figure 4. Sample data (CF10, CF11)
Figure 5. Land use sample – City Centre
8162:10
Proceedings: Eighth International Space Syntax Symposium Santiago de Chile: PUC, 2012.
Table 3. Sample summary (CF10, CF11)
The analysis with council tax band values and the spatial variables resulted similar to the previous research made in London (Chiaradia, Hillier, et al, 2008). The results show a clear correspondence between tax band value and integration. The higher the property tax values the higher the integration value. This result was consistent when using different metric radii (300, 800, 1000, 2000) as well as Choice measure resulting in the same positive relation. However, the difference is shown in the relation at R300m and segment length. At a radius of 300 metres, there is still a strong and positively relation with high tax properties, which means that high tax properties still remain with high local accessibility in the central area. Segment length proves to be in a negative relation to higher tax properties, meaning that the smaller urban blocks the higher tax property. This difference, compared to the UrbanBuzz research, might be hypothetically for several reasons: the size of the sample, which only considers the most integrated core of the city. And, that the relation of council tax band and integration might will depend also in the city’s specific morphology and size.
8162:11
Proceedings: Eighth International Space Syntax Symposium Santiago de Chile: PUC, 2012.
Council Tax Band – RESULTS
(A) (C)
(B)
(D)
Council Tax Bands with: (A) Global Integration Rn, (B) Choice (Overlap Path) Rn, (C) Integration R300m, (D) Segment Length
2.2 Sold House Prices: Price paid dataset, obtained from Land Registry, is used as a variable to test the average price and the number of sales within a period of three years, from 2008‐2010. This data was used with the purpose of testing how different typologies of dwellings according to their price per square metre is related to their integration in the whole system. Firstly, a general illustration shows how the average price of houses varies through the last 3 years and how an economic slump during 2009 results in higher number of sales at a lower price property (Figure 6). Furthermore, price paid data of properties within each year was collected for the whole city. Table 4 shows the number of sold properties grouped by its tax band, the average type of dwelling sold and the average price paid for each year.
8162:12
Proceedings: Eighth International Space Syntax Symposium Santiago de Chile: PUC, 2012.
Figure 6. Mapping sold house prices. Average and sales volume of dwellings in Cardiff from 2008‐2010. (http://www.landregistry.gov.uk)
Table 4. Summary of sold price properties (F=Flats; T=Terraced; S=Semi‐Detached; D=Detached)
This second set was measured firstly according to the sold price related to street network integration at different radii (Rn, R800m, R300m). The colours of the point represent the groups of tax band in which the sold properties correspond; circles in the graphs represent the area sample CF10, CF11. The results illustrate the sold prices for year 2010. However, these results are consistent for 2008 and 2009, where it shows the difference of integration measures with the same price paid of a property. This difference is mainly due to location of the property and its size. The main relation comes with the correspondence between banding and price, where it is clearly distinguished every group of council tax band within the price of the property.
8162:13
Proceedings: Eighth International Space Syntax Symposium Santiago de Chile: PUC, 2012.
Sold House Prices – RESULTS 2010
Moreover, the prices where normalised by price per square metre according to the type of dwelling for each year. The following graphs show how different types of dwellings (S=Semidetached, D=Detached, F=Flats, and T=Terraced) are averaged according to their price per square metre. It was considered the price paid divided by square metre area only of the dwelling itself (excluding plot size). The method was to average the price per square metre by each typology with the purpose of relating size of the property, using segment length as a measure of urban block size and local measures of integration within a radius of 400 metres. The graphs show for each year that Semi‐detached and Detached remain within a higher level of integration within the urban system. The difference in ever year results in Terraced houses and Flats. Terraced houses, despite being the highest number of types of dwellings that constitutes Cardiff, are highly more valuable in their cost per square metre because of their size. This can be inferred by the graphs showing segment length correlation. The higher the price per square metre the higher street segment (more land, bigger houses) and the less integrated (more private areas or located in the suburbs). In contrast, Flats are the most variable types of dwellings that tend to change easily in matters of their access –that can be within the city centre or in more residential areas but remaining with a the higher cost than the rest. Price (£) per square metre by Typology of Dwelling 2010
8162:14
Proceedings: Eighth International Space Syntax Symposium Santiago de Chile: PUC, 2012. 2009
2008
The relationship between these measures by typology of dwelling is also reflected in considering the average price per square metre by each council tax band. Price per square metre at a global measure of integration shows that the higher cost per square metre is within the lowest and the highest council tax band value (A, I). This means that for higher cost is for more segregated areas with larger street blocks. Yet, council tax band A reflects, other things being equal, that property size is the smallest among the rest. This may be inferred that smaller living spaces tend to be almost equally expensive as for terraced houses.
8162:15
Proceedings: Eighth International Space Syntax Symposium Santiago de Chile: PUC, 2012.
CONCLUSION The study shows a sample of the city of Cardiff that reveals how different economic variables are related to spatial variables. The first set of analysis showed –and proved by existing research‐ that council tax band is highly correlated with integration at a global level. However, high tax properties still remain with a high local accessibility at a more local radius. It can be argued that, in contrast with London’s case, Cardiff is a much smaller city, which might also influence that the value of band for properties may vary in the accessibility of the grid. The morphology of a city can influence on how property value is assigned and located. It is also important that the sample is +24,000 that includes only two (out of 8) postcode districts. Density was also a factor measured and similar to London’s, in which the lower the density the higher the tax properties. This was made by calculating area*height/3.6 for each polygon or block (3.6 being the average storey height) and relate it to each dwelling and its correspondent street. On the other hand, an interesting result is shown with the length of streets segments, where higher tax properties tend to be on smaller blocks. It can be suggested that besides location, the allocation of land uses may have an effect on how property value is assigned. In the central area where the main markets are retail and commercial, higher tax properties tend to be more accessible where the street network is with least length of to‐movement. Further research, however, is being conducted to complete the tax banding of the whole city. The second set of analyses showed firstly that price itself is independent to the level of integration. In these terms, location is an important factor to consider. It can be understood that accessibility is a scale to understand the degree of ease in which similar economic activities are performed in one area. Sold prices are the result of market trends, but they also represent people’s choice of purchase. It is not the intention to discuss these decision‐making processes of choices, but the factors that are related to the sale of properties under different scales and economic activities. The co‐relation of variables in this second set is between price per square metre and local integration. The price per square metre for each dwelling reflects how the cost is higher in dwellings with larger urban blocks and less integrated spaces in the network, in which larger dwellings (terraced) and perhaps more accessible yet smaller dwellings such as flats are with the highest price per square metre. A third test with volume prices was tested, in which data was collected at a
8162:16
Proceedings: Eighth International Space Syntax Symposium Santiago de Chile: PUC, 2012.
postcode sector level (i.e. CF10 1). Testing a total of 45 postcode sectors, the analysis included the average prices for every type of dwelling for the years 2009 and 2010. The results showed little correlation to the spatial variables with different metric radii that requires further network distance measures to be performed. REFERENCES Alonso, W. 1964. Location and land use. Cambridge: Harvard University Press. Christaller, W. 1933. Central Places in Southern Germany, trans. C. W. Baskin (Englewood Cliffs, NJ, 1967). First published in 1933. Conzen, M. R. G. 1960. Alnwick, Northumberland: A Study in Town‐Plan Analysis. Institute of British Geographers Publication No. 27. London: George Philip. Chiaradia, A; Hillier, B; Barnes, Y; Schwander, C. 2009a. Residential Property Value Patterns in London. Proceedings, 7th International Space Syntax Symposium, KTH Royal Institute of Technology, Stockholm, Sweden. Chiaradia, A; Hillier, B; Schwander, C; Wedderburn, M. 2009b. Spatial Centrality, Economic Vitality/Viability. Proceedings, 7th International Space Syntax Symposium, KTH Royal Institute of Technology, Stockholm, Sweden. Desyllas, J. 2004. The relationship between urban street configuration and office rent patterns in Berlin. PhD Thesis. University College London. Fujita, M; Krugman, P; Venables, AJ. 1999 The Spatial eEconomy. Cambridge MA: MIT press. Hayek, F. A. (1944) The Road to Serfdom. Chicago: University of Chicago Press. Hillier, B. and J. Hanson (1984) The Social Logic of Space, Cambridge University Press. Hillier, B; Penn, A; Hanson, J; Grajewski, T; Xu, J. (1993) Natural movement: or configuration and attraction in urban pedestrian movement, in: Environment & Planning B: Planning & Design (20): 29‐66. Hillier, B. (1996a) Cities as movement economies, in: Urban Design International, 1: 49‐60. Hillier, B. (1996b) Space is the Machine, Cambridge University Press. Hillier, B. (1999a) Centrality as a process: accounting for attraction inequalities in deformed grids, in: Urban Design International, 3(4): 107‐127. Hillier, B. (1999b) The Hidden Geometry of Deformed Grids: Or, Why Space Syntax Works When It Looks As Though It Shouldn’t. Environment and Planning B, 26, pp.169–191. Hillier, B. (2001) A Theory of the City as Object, or how spatial laws mediate the social construction or urban space. Proceedings, 3rd International Space Syntax Symposium, Atlanta.
8162:17
Proceedings: Eighth International Space Syntax Symposium Santiago de Chile: PUC, 2012.
Hillier, B; Iida, S. (2005) Network effects and psychological effects: a theory of urban movement. Proceedings, 5th International Space Syntax Symposium, Delft, TU Delft, pp.553‐564. Hillier, B; Turner, A; Yang, T; Park, H. (2007) Metric and Topo‐geometric Properties of Urban Street Networks: Some convergences, divergence, and new results. Proceedings, 6th International Space Syntax Symposium, Istanbul Technical University, Cenkler, Istanbul, pp. 001.01‐22. Hillier, B. (2009) Spatial Sustainability in Cities, Organic Patterns and Sustainable Forms. Proceedings, 7th International Space Syntax Symposium, KTH Royal Institute of Technology, Stockholm, Sweden. Hillier, B. and O. Sahbaz. 2005. High resolution analysis of crime patterns in urban street networks: an initial statistical sketch from an ongoing study of a London borough. In Fifth International Space Syntax Symposium, Vol I, edited by A. van Nes, 451‐478. Delft: TU Delft. Hillier B and S Shu. 2000. Crime and urban layout: the need for evidence. In Key Issues in Crime Prevention and Community Safety, edited by V MacLaren, S Ballantyne and K Pease. London: IPPR. Hillier, B. and S Shu. 1999. Do Burglars Understand Defensible Space? Planning in London, Designing for Secure Spaces, 29, 36‐39 Hooper, A; Punter, J. (2006) Captial Cardiff 1975‐2020, Regeneration, Competitiveness and the Urban Enviornment. University of Wales Press. Jacobs, J. (1970) The Economy of Cities. Vintage. US Krugman, P. (1991) Increasing returns and economic geography. Journal of Political Economy 99, 484–99. Kubat, A. S; Topcu, K; Topcu, M. (2007) Movement Economy Dependent on Urban Design. 6th International Space Syntax Symposium, Istanbul. Lloyd, P.; Dicken, P. (1972) Location in Space: A theoretical approach to economic geography. Harper & Row. Losch, A. (1954) The Economics of Location. New Haven: Yale University Press. Marcus, L. (2010) Spatial Capital and how to measure it – an outline of an analytical theory of urban form. The Journal of Space Syntax, Vol 1, No. 1 Min, K; Moon, J; Kim, Y (2007) The Effect of Spatial Configuration on Land Use and Land Value in Seoul. Proceedings, 6th International Space Syntax Symposium, Istanbul. Penn, A., Hillier, B., Banister, D. and Xu, J., (1998) Configurational modelling of urban movement networks, Environment and Planning B: Planning and Design, 24, p. 59‐84. Peponis, J. (2006) On the formulation of spatial meaning in architectural design. Proceedings, 4th International Space Syntax Symposium, London. Perdikogianni, I; Penn, A. (2006) Is urban diversity synonymous with urban sustainability? What do people “suggest” for Clerkenwell in London? Annual General Conference of the Canadian Society for Civil Engineering, Calgary, Alberta, Canada.
8162:18
Proceedings: Eighth International Space Syntax Symposium Santiago de Chile: PUC, 2012.
Ricardo, D. [1817] (1986) On the Principles of Political Economy and Taxation. Edited by Piero Sraffa. Cambridge University Press. Smith, A. (1776) An Inquiry into the Nature and Causes of the Wealth of Nations. London: Printed for W. Strahan and T. Cadell. Wai, Lawrence; Lai, Chung (2004) Spontaneous Catallaxis in Urban & Rural Development Under Planning by Contract in a Small Open Economy: The ideas of Hayek and Mises at work in town & country planning in Hong Kong. Review of Austrian Economics, 17: 155‐186. Webster, C. (2002) Property Rights and the public realm: gates, green belts, and Gemeinschaft. Enviornment and Planning B: Planning and Design, volume 29, pages 397‐412. Webster, C. (2009) Pricing Accessibility: Urban form, missing markets and the efficient allocation of property rights over shared urban resources. Urban Buzz Position Paper. Proceedings, 7th International Space Syntax Symposium, KTH Royal Institute of Technology, Stockholm, Sweden. Whitehand, J.W.R. (1972b) Urban‐Rent Theory, Time Series and Morphogenesis: An Example of Eclecticism in Geographical Research. Wiley Blackwell Publishers on behalf of the Royal Geographical Society. Vol. 4, No. 4 (1972), pp. 215‐222 Whitehand, J. W. R. and Morton, N. J. (2003) Fringe belts and the recycling of urban land: an academic concept and planning practice, Environment and Planning B, 30, pp. 819–839. Whitehand, J. W. R. and Morton, N. J. (2006) The Fringe‐belt Phenomenon and Socioeconomic Change. Urban Studies, Vol. 43, No. 11, 2047‐2066, October 2006 Wilson, A. (2000) Complex Spatial Systems. The Modelling Foundations of Urban and Regional Analysis. Prentice Hall.
8162:19