ARTICLE DOI: 10.1038/s41467-017-00180-9
OPEN
Sparse orthogonal population representation of spatial context in the retrosplenial cortex Dun Mao1,2, Steffen Kandler1,3, Bruce L. McNaughton1,2 & Vincent Bonin1,3,4,5
Sparse orthogonal coding is a key feature of hippocampal neural activity, which is believed to increase episodic memory capacity and to assist in navigation. Some retrosplenial cortex (RSC) neurons convey distributed spatial and navigational signals, but place-field representations such as observed in the hippocampus have not been reported. Combining cellular Ca2+ imaging in RSC of mice with a head-fixed locomotion assay, we identified a population of RSC neurons, located predominantly in superficial layers, whose ensemble activity closely resembles that of hippocampal CA1 place cells during the same task. Like CA1 place cells, these RSC neurons fire in sequences during movement, and show narrowly tuned firing fields that form a sparse, orthogonal code correlated with location. RSC ‘place’ cell activity is robust to environmental manipulations, showing partial remapping similar to that observed in CA1. This population code for spatial context may assist the RSC in its role in memory and/or navigation.
1 Neuro-Electronics Research Flanders, Kapeldreef 75, Leuven B-3001, Belgium. 2 Canadian Centre for Behavioural Neuroscience, Department of Neuroscience, University of Lethbridge, 4401 University Drive, Lethbridge, Canada AB T1K 3M4. 3 Imec, Kapeldreef 75, Leuven B-3001, Belgium. 4 VIB, Leuven 3001, Belgium. 5 Department of Biology, KU Leuven, Naamsestraat 59, Leuven 3000, Belgium. Correspondence and requests for materials should be addressed to V.B. (email:
[email protected])
NATURE COMMUNICATIONS | 8: 243
| DOI: 10.1038/s41467-017-00180-9 | www.nature.com/naturecommunications
1
ARTICLE
NATURE COMMUNICATIONS | DOI: 10.1038/s41467-017-00180-9
A
s early as 1969, Marr pointed out that making neural codes sparse (minimizing the proportion of active units) and orthogonal (making codes as statistically uncorrelated as possible) maximizes the number of different patterns that can be stored in associative memory networks such as the cerebellar cortex, hippocampus, and neocortex. A prime example of such a code is neural activity in the rodent hippocampus during spatially extended behaviour. At the neurophysiological level, hippocampal neurons show discrete patches of high-rate discharges localized to specific places1, which are referred to as place fields. The activity of hippocampal place cells is characterized by overall low probability of activation, and precise tuning and a nearly uniform allocation of place fields over the environment. The integration of self-motion cues (path integration) has been shown to be sufficient for the generation of hippocampal place cells; however, the
1
0 0
150 cm
0
A L
V1
150 Position (cm)
Position 1 mm
Speed 10 s
g
Position
31
1
1
0
Neuron no.
Neuron no.
31
1 20 s
Time
i
Pop. Corr. Mat. (n = 1 animal) 150
0 0
1
Position (cm)
Position (cm)
0.5
Pop. Corr. Mat. (n = 4 animals) 150
1
150 0 Position (cm)
0.5 0
Corr. Coef.
h
150 0 Position (cm)
Norm. mean dF /F
f
Neuron
10
Trial
20
e
Raw Deconv.
Neuron
Trial no.
30
Speed (cm s–1)
53
d
30 150 15% 300% cm s–1 cm
c
b
a
path integration mechanism appears to require frequent correction from external cues2. Computationally, place-cell activity can be viewed as basis vectors upon which the animal’s spatial location and other contextual events are encoded3. Place cell activity is sparse and approximately orthogonal (statistically uncorrelated)4, features that are thought to be important for spatial learning and memory, route planning, and navigation1, 5–8. Is the hippocampus unique in its sparse contextual coding scheme? Considering the sparse firing of neurons in the superficial neocortex9, it is possible that similar orthogonal codes of location are expressed in immediately interconnected cortical regions10. Notably, the retrosplenial cortex (RSC) is densely connected with the hippocampal system11–13, including direct input from dorsal hippocampal CA1. Moreover, the RSC has been directly linked to spatial behaviours. For example,
0 0
150 Position (cm)
0
150 Position (cm)
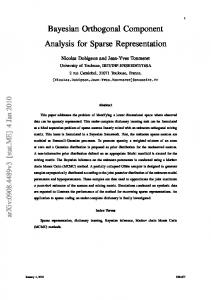
Fig. 1 Sparse orthogonal population representation of spatial location in the retrosplenial cortex. a Head-fixed locomotion assay. Mice moved a 150-cm linear treadmill (top) with tactile cues on its surface (bottom). A drop of sucrose water (blue) was delivered at a fixed location for every completed lap. b Lap running behaviour. Movement speed as a function of location for 53 consecutive laps from one experimental session. The animal moved robustly and slowed down or paused most frequently near the reward (as shown by dark colours on the left). c Cellular imaging of neural activity in the retrosplenial cortex (RSC) during head-fixed treadmill running. (top) Illustration of superficial and deep RSC neurons labelled with calcium indicator GCaMP6m (green dots). Calcium imaging was performed with a two-photon microscope through a glass window. (bottom) Tangential view of the labelled superficial RSC neurons with an example imaging field of view (black square). Red lines indicate superior sagittal sinus and transverse sinuses. Scale bar, 1 mm. A: anterior; L: lateral. d Calcium fluorescence signals (top, red) and inferred neural activity (top, black) of six example superficial agranular RSC neurons showing place cell activity; speed and treadmill position are at the bottom. Neural activity was inferred using a fast non-negative deconvolution algorithm 64. e Normalized activity of the six RSC place cells in d as a function of location for multiple laps. The y axis in each colour map corresponds to trial number. Note how neurons were activated as the animal crossed specific locations. Activity was normalized to the time spent at individual locations. f Raster plot showing activation time points for 31 simultaneously imaged RSC place cells, for the same session as in e, together with position (top). Activation time points defined as time points of peak response in each lap for each neuron. Cells ordered by the location that evoked largest responses. Note the repeated sequences of activation during movement and lack of activation when the animal was not moving. g Average normalized activity as a function of location for the 31 RSC place cells shown in f. h Correlation matrix (Pearson correlation coefficient) of population vectors as a function of position for data shown in g. i Correlation matrix (Pearson correlation coefficient) of population vectors as a function of position for data from four mice. (Data from WT mice with AAV1-hSyn-GCaMP6m injections.) 2
NATURE COMMUNICATIONS | 8: 243
| DOI: 10.1038/s41467-017-00180-9 | www.nature.com/naturecommunications
ARTICLE
NATURE COMMUNICATIONS | DOI: 10.1038/s41467-017-00180-9
inactivating the RSC impairs spatial behaviours14 and path integration in darkness15. Likewise, lesions of the RSC produce spatial and contextual memory deficits that are similar to those observed after hippocampal lesions14, 16–21. Studies of RSC neurons during spatially extended behaviour have shown navigation-related signals, including head-direction selective, speed selective and goalrelated signals22–24. Recent studies have also shown evidence of route encoding25–27 but reported only broad spatial and behavioural selectivity23, 25. To date, few studies have achieved simultaneous recordings from a sufficiently large number of neurons to characterize the RSC population code. The purpose of the present investigation was therefore to characterize population activity in the RSC during spatially extended behaviour. We performed cellular Ca2+ imaging across subregions of the RSC in mice that used natural locomotion to move a treadmill linear track. We discovered a substantial group of RSC neurons, most numerous in the superficial subregions,
that show spatially-localized activity that closely resembles the activity of CA1 place cells measured in the same behavioural assay. Like CA1 place cells, these RSC neurons fire in sequences during movement, and show narrowly tuned firing fields that form a sparse, orthogonal representation of the environment. RSC ‘place’ cell activity is robust to environmental manipulations, showing partial random remapping of its activity. This RSC place code may be useful for spatially guided behaviour such as goal-directed navigation, and for memory encoding in general. Whether this hippocampus-like activity is independent of the hippocampus, inherited from it, or helps shape it will require further investigation. Results Hippocampal place cell activity during treadmill locomotion. To study spatial coding in the RSC, we combined a head-fixed locomotion assay28 with chronic cellular imaging (Fig. 1a; see also
a 176
0
30 150 cm s–1 cm
Speed (cm s–1)
1 Position Speed Reward
1
Neuron no.
1
Norm. dF /F
Neuron no.
176
1
0
Norm. mean dF /F
Cue belt
30 0 0
10 s
b
150 Position (cm)
Neuron no.
0
Norm. dF /F
Neuron no.
1
30 150 cm s–1 cm
Speed (cm s–1)
1 Position Speed Reward 10 s
d
Blank belt
1
Position (cm)
0.5 0
1
0
30 0 0
150 Position (cm)
1
Cum. Prob.
Cue belt 150
Corr. Coef.
c
1
Norm. mean dF /F
Blank belt 135
135
Blank belt (n = 224) Cue belt (n = 493) 0
0 0
150
0
Position (cm)
150
0
2 4 Spatial info. (bits)
Fig. 2 Tactile stimuli enhance stability of RSC place cell activity. a (left) Normalized calcium activity of 176 simultaneously imaged RSC place cells on a belt with tactile cues. Cells were ordered by the positions of their peak average activity. Position and speed traces are shown below. Dashed lines and blue drops represent reward delivery. (right) trial-averaged position activity for the 176 RSC place cells shown on the left. Belt diagram (top) and speed traces as a function of position (bottom) are shown. Grey lines, speed traces for individual trials; black line, average speed trace. b Same, for 135 neurons imaged during movement on a belt devoid of salient tactile cues. Note the increased positional jitter of RSC place-cell activity in absence of salient tactile stimuli. c Correlation matrices (Pearson correlation coefficient) of population vectors as a function of position for RSC place cells on the cue belt (left) and on the blank belt (right). d Cumulative distributions of spatial information for all RSC place cells on the cue belt (red) and on the blank belt (blue). (Data from Thy1 GP4.3 transgenic mice.) NATURE COMMUNICATIONS | 8: 243
| DOI: 10.1038/s41467-017-00180-9 | www.nature.com/naturecommunications
3
ARTICLE
NATURE COMMUNICATIONS | DOI: 10.1038/s41467-017-00180-9
b
c
d
0.8
1
1
0 CA1
0.2 0.1
Fraction
0.1 0.5 CA1 0
50 100 150 Position (cm)
0.4
CA1
RSC
0
50
100
0.5
RSC CA1
0
0 1 2 3 Number of place fields per place cell
0
0
RSC
Population Corr.
RSC 0.2
Cum. Prob.
Place-field fraction
a
150
Place-field width (cm)
0
75 150 Distance (cm)
Fig. 3 Similar spatial response properties of RSC and CA1 place cells. a Place-field fraction as a function of place field location on the track. (top) RSC place cells (n = 297); bottom: CA1 place cells (n = 611, electrophysiology and imaging). Error bars: s.e.m. b Cumulative probability distributions of place-field widths for RSC place cells (black, n = 297) and CA1 place cells (red, n = 452, imaging). c Distribution of place field count per cell for RSC (black bars, n = 297) and CA1 (red bars, n = 611, electrophysiology and imaging) place cells. d Population vector correlation (Pearson correlation coefficient) as a function of distance for RSC (black) and CA1 (red) place cells. Shaded areas represent s.d. Note that the periodicity occurred because of the periodicity of the track. (Data from WT mice with AAV1-hSyn-GCaMP6m injections.)
Methods). C57Bl/6j mice (n = 14 wild-type (WT); n = 4 Thy1 GP4.3 transgenic mice29) were trained to run on a treadmill with tactile stimulus patches on its surface and a fixed reward site (Supplementary Fig. 1a). The animals alternated between highspeed movement and pauses, which were mostly but not exclusively near the reward location (Fig. 1b). Movement speed was approximately constant in between reward events (18.5 ± 5.5 cm s−1, mean ± s.d.; n = 18 mice, 40 runs). Experimental sessions lasted 11.3 ± 2.8 min (mean ± s.d.), yielding 33 ± 17 (mean ± s.d.) complete laps (trials) per session. We expected that treadmill running would entrain neural activity in the hippocampus28 as observed in freely moving animals. To confirm this, we measured cellular activity in dorsal CA1 using chronic cellular imaging30, 31 (n = 1758 neurons, n = 2 WT mice; n = 1 Thy1 transgenic mice) and multisite silicon probe recordings (n = 337 neurons, n = 8 mice) (Supplementary Fig. 1b, e). Consistent with studies in freely moving animals4, CA1 neuronal activity was sparse (calcium transient rate = 0.8, 2.6, 11.3 min−1; 10, 50 and 90% percentiles) and the distribution of firing rates of isolated single units was skewed (10, 50 and 90% percentiles of firing rate = 0.6, 1.8 and 4.7 spikes s−1). To assess spatial modulation of neuronal activity, calcium time courses were deconvolved32 (Fig. 1d) and expressed as a function of the animal’s location on the treadmill, in 1.5 cm intervals, and normalized by the time spent at each location. We used the resulting position-related activity profiles as measures of spatial tuning. Similar to cellular imaging measurements made in real4 and virtual28, 30 environments, 47% (159/337) of electrically recorded and 26% (452/1758) of optically recorded hippocampal CA1 neurons met established criteria for place cell activity (see Methods) (Supplementary Fig. 1c, f)30, 33. The active neurons showed sequential firing during movement (Supplementary Fig. 1g) and discrete, minimally-overlapping place fields that continuously, but sparsely, covered the treadmill belt (Supplementary Fig. 1d, h)1, 28. In the electrical recordings, place-cell activity was phase locked to low frequency local-field potential oscillations (5–12 Hz; Supplementary Fig. 1c), as observed in freely moving animals34, 35. Thus, running on the treadmill entrains hippocampal CA1 activity in a way that resembles that observed during free running in linear environments. Spatial activity in the retrosplenial cortex. Next, we used the head-fixed treadmill assay to investigate neural correlates of spatial location in the RSC. We first examined the calcium time courses of 2256 (n = 4 WT mice, 14 sessions) neurons in the superficial agranular region of RSC. The neurons were labelled via 4
AAV1-hSyn-GCaMP6m viral vector injections and imaged with a two-photon microscope through a cranial glass window implanted over the midline31 (Fig. 1c). To study spatial tuning, we expressed neuronal activity as a function of the animal’s location on the treadmill and averaged the result across laps, using the same procedure used for the CA1 recordings (see Methods). About 13% (297/2256) of RSC neurons labelled with AAV1 viral vector injections had discrete spatially-localized firing fields that resembled the place fields of CA1 neurons. Accordingly, we refer to these cells as RSC place cells. Similar to CA1 place cells (Supplementary Fig. 1d, g, h), the RSC place cells showed spatially localized activity with distinct neurons firing as the animal crossed distinct treadmill locations (Fig. 1e). Within simultaneously imaged neuronal populations, the firing of RSC place neurons sparsely but continuously covered the full length of the treadmill (Fig. 1e–g). The RSC neurons fired in continuous, reproducible sequences during movement but not during stillness (Figs 1f and 2a). Similar results were obtained in Thy1 GP4.3 transgenic mice (n = 3)29 (Fig. 2), which specifically express GCaMP6 in a subset of cortical excitatory neurons. In these mice, the fraction of place cells was larger (56%, 1416/2544, n = 3 mice, eight sessions), possibly due to a bias in favour of a specific group of excitatory neurons. Importantly, there were many active cells in the RSC whose activity did not show place-cell characteristics. The characteristics of these ‘non-place’ cells will be reported elsewhere. Similarity of the RSC and CA1 place codes. The spatial tuning properties of RSC and CA1 place cells were strikingly similar. RSC and CA1 neurons did not differ in the number (Fig. 3c; P = 0.21, χ2-test) and width of place fields (RSC: 39.6 ± 1.2 cm; CA1: 37.0 ± 0.8 cm; both mean ± s.e.m.; P = 0.57, two-sample KS test) (Fig. 3b). In both areas, place fields were distributed over the length of the treadmill; and there was a tendency of higher density of place fields around the reward location (Fig. 3a). This is sometimes observed in CA1 of freely moving animals34. To quantify spatial tuning at the level of cell populations, we computed the correlation matrix of the neurons’ position-related activity vectors sorted by their peak location, which quantifies response similarity between cells tuned to distinct locations. Consistent with a sparse orthogonal code, RSC population vectors showed high correlations between nearby locations (i.e., near the main diagonal) and weak correlations between more distant locations (Fig. 1h, i). Averaging the data across positions, the neuronal population vectors showed a steep drop in correlation with distance (Fig. 3d). The correlation structure of RSC activity closely resembled that of CA1 neurons during the same behaviour
NATURE COMMUNICATIONS | 8: 243
| DOI: 10.1038/s41467-017-00180-9 | www.nature.com/naturecommunications
ARTICLE
NATURE COMMUNICATIONS | DOI: 10.1038/s41467-017-00180-9
a b
c
b Sup. agr.
1
0 –0.5
d
0.8
0.4
Cum. Prob.
1 Sup.agr. Deep Sup.gr.
150
Fraction
c
0 150 Distance (cm) Sup.agr. Deep Sup.gr.
0
0 0
50 100 Place field width (cm)
Sup. gr.
0.5
0
0.5
Deep
1 2 3 Number of place fields per place cell
0
e
0.2
Place-cell fraction
a - Sup. agr. b - Deep c - Sup. gr.
Population Corr.
a
0.1
150
0 Sup. Deep Sup. agr. gr.
Fig. 4 RSC place cells are more prevalent in superficial layers. a Diagram of three RSC sub-regions. Sup. agr.: superficial agranular; Deep: deep agranular and granular; Sup. gr.: superficial granular. Green dots represent GCaMP6m labelled neurons. Imaging at different depths revealed neurons in different subregions. b Mean population vector correlation as a function of distance for the three sub-regions. Shaded areas represent s.d. c Cumulative probability distributions of place-field widths for superficial agranular (black, n = 123), deep (purple, n = 60), and superficial granular (blue, n = 30) RSC place cells. d Distribution of place field count per cell for superficial agranular (black bars), deep (purple bars) and superficial granular (blue bars) RSC place cells. e Place cell fraction in superficial agranular (black bar), deep (purple bar), and superficial granular (blue bar) RSC. Error bars: s.e.m. (Data from WT mice with AAV1-hSyn-GCaMP6m injections.)
(Fig. 3d and Supplementary Fig. 1i) and during free movement on real linear tracks35. Thus, RSC neurons during linear treadmill running show highly tuned spatial activity that resemble the sparse, orthogonal code of location generally observed in the hippocampus and is characteristic of CA1 neurons’ activity measured during the same behaviour. Place-cell activity across subregions of the RSC. Distinct subregions of the RSC receive distinct inputs and make synaptic connections to distinct targets11, 36, 37, which could indicate functionally specialized domains. To compare spatial activity across subregions of the RSC, we imaged in each animal (n = 3 WT mice) neurons at two distinct depths (150 and 400 µm) and used the lack of GCaMP6 expression in layer 4 to determine the boundaries of RSC subregions in the in vivo images (Fig. 4a and Supplementary Fig. 2a). While hippocampus-like place cells were observed across all subregions of the RSC (Supplementary Fig. 2b), they were substantially more prevalent in superficial regions (agranular and granular). Place cells were found in the superficial agranular (n = 123/861), superficial granular (n = 31/198) and deep layers (n = 60/1237) of the RSC. A similar steep drop in population activity correlation with distance was observed in the three RSC subregions (Fig. 4b). Place cells across RSC subregions had similar spatial response properties (Figs. 4c and d; P = 0.58 for place-field width comparison, One-way analysis of variance; P = 0.27 for place field number comparison, χ2-test); however, there were about 2.5 times more place cells in the superficial agranular and superficial granular layers than the deep layers (superficial agranular: 15 ± 3%; superficial granular: 15 ± 1%; deep layers: 6 ± 2 %; mean ± s.e.m.; superficial vs. deep, both P < 0.05, paired t-test) (Fig. 4e). These results are consistent with the anatomical connections between dorsal hippocampus CA1 and superficial but not deep RSC12. Tactile stimuli enhance stability of RSC place-cell activity. In CA1, place fields in absence of ‘allocentric’ cues from external stimuli reflect path integration between reward events38, 39. Placecell activity in the RSC could depend on the integration of selfNATURE COMMUNICATIONS | 8: 243
motion cues (that is, from belt and limb movement), but, if so, would require anchoring to external stimuli, of which only the reward delivery and the tactile cues on the belt were available. To assess the specific contribution of tactile inputs, we compared activity on treadmill belts with and without tactile stimuli. Mice were well-trained in both conditions. We compared the impact of tactile stimuli on CA1 (n = 1 Thy1 transgenic mouse) and RSC (n = 3 Thy1 transgenic mice) activity. Place-cell activity in the hippocampus was maintained in the reference frame of the reward stimulus in absence of tactile stimuli (Supplementary Fig. 3). CA1 neurons showed seamless sequential firing during movement on belts with and without tactile stimuli (Supplementary Fig. 3a, b). The tactile stimuli had little impact on population spatial tuning, showing the same rapid decrease in correlation with distance in presence and absence of tactile stimuli (Supplementary Fig. 3c). Spatial information (SI) encoded in the neurons’ activities was also similar, differing by