water Article
Spatial and Seasonal Variation of Biomineral Suspended Particulate Matter Properties in High-Turbid Nearshore and Low-Turbid Offshore Zones Michael Fettweis 1 and Byung Joon Lee 2, * 1 2
*
Operational Directorate Natural Environment, Royal Belgian Institute of Natural Sciences, Gulledelle 100, B-1200 Brussels, Belgium;
[email protected] Department of Disaster Prevention and Environmental Engineering, Kyungpook National University, 2559 Gyeongsang-daero, Sangju, Gyeongbuk 742-711, Korea Correspondence:
[email protected]; Tel.: +82-54-530-1444
Received: 3 August 2017; Accepted: 11 September 2017; Published: 12 September 2017
Abstract: Suspended particulate matter (SPM) is abundant and essential in marine and coastal waters, and comprises a wide variety of biomineral particles, which are practically grouped into organic biomass and inorganic sediments. Such biomass and sediments interact with each other and build large biomineral aggregates via flocculation, therefore controlling the fate and transport of SPM in marine and coastal waters. Despite its importance, flocculation mediated by biomass-sediment interactions is not fully understood. Thus, the aim of this research was to explain biologically mediated flocculation and SPM dynamics in different locations and seasons in marine and coastal waters. Field measurement campaigns followed by physical and biochemical analyses had been carried out from 2004 to 2011 in the Belgian coastal area to investigate bio-mediated flocculation and SPM dynamics. Although SPM had the same mineralogical composition, it encountered different fates in the turbidity maximum zone (TMZ) and in the offshore zone (OSZ), regarding bio-mediated flocculation. SPM in the TMZ built sediment-enriched, dense, and settleable biomineral aggregates, whereas SPM in the OSZ composed biomass-enriched, less dense, and less settleable marine snow. Biological proliferation, such as an algal bloom, was also found to facilitate SPM in building biomass-enriched marine snow, even in the TMZ. In short, bio-mediated flocculation and SPM dynamics varied spatially and seasonally, owing to biomass-sediment interactions and bio-mediated flocculation. Keywords: suspended particulate matter; aggregates; flocculation; biomass; sediment
1. Introduction Suspended particulate matter (SPM), produced by biological and geophysical actions on the Earth’s crust, enters into marine and coastal waters and is dispersed by flow-driven transportation, such as advection and dispersion [1–3]. The SPM concentration is an important parameter to understand the marine ecosystem as it controls the water turbidity and mediates many physical and biochemical processes [4–6]. SPM comprises a wide variety of biomineral clay to sand sized particles, comprising living (microbes, phyto- and zooplankton) and non-living organic matter (fecal and pseudo-fecal pellets, detritus and its decomposed products from microbial activity such as mucus, exopolymers), and minerals from a physico-chemical (e.g., clay minerals, quartz, feldspar) and biogenic origin (e.g., calcite, aragonite, opal), which are practically grouped into organic biomass and inorganic sediments [7]. It is important to note that when clays or other charged particles and polymers are in suspension, they become attached to each other and form fragile structures or flocs with compositions, sizes, densities,
Water 2017, 9, 694; doi:10.3390/w9090694
www.mdpi.com/journal/water
Water 2017, 9, 694
2 of 15
and structural complexities that vary as a function of turbulence and biochemical composition [3,8–11]. Flocculation combines biomass and sediments into larger aggregates (i.e., flocs) that can be classified as either mineral, biomineral, or biological aggregates. Flocculation usually integrates aggregation and disaggregation (i.e., breakup) kinetics, depending on the hydrodynamics of a suspension. Electrostatic and colloidal chemistry is the fundamental driver for flocculation in a cohesive suspension. For example, high ionic strength reduces the electrostatic repulsion between colloidal particles, thereby increasing the aggregation of colloidal suspension. Also, regarding the heterogeneity of a natural suspension with various biomass and sediments, physical and biochemical conditions are favorable for flocculation, like low turbulence intensity, high ionic strength, and sticky polymeric substances, which help individual biomineral particles to build large aggregates. Clay mineralogy is also important for determining electrochemistry and flocculation capability. Depending on the biomass composition, such aggregates are classified into mineral, biomineral, and biological aggregates [12,13]. Mineral and biomineral aggregates form in the sediment-enriched environment, such as a turbidity maximum zone (TMZ) or a nearshore area [6,14,15], while biological aggregates (i.e., marine snow) form in the mineral-depleted environment typically found in an offshore zone (OSZ) [16]. Flocculation mediated by biological composition determines the size, density, and settling velocity of aggregates [12,14,17]. For example, in a tidal cycle, low flow intensity during slack water enhances flocculation capability, building large, settleable aggregates, whereas high flow intensity at peak flow reduces flocculation capability, breaking down aggregates to small, less (or hardly) settleable aggregates or primary particles [5,18]. Moreover, sticky biomass (e.g., extracellular polymeric substances (EPSs) or transparent extracellular polymers (TEPs)) helps build large biomineral aggregates [7,19–22]. Flocculation which can be mediated by biological factors consequently controls sedimentation, resuspension, deposition, and erosion, and determines the overall SPM dynamics in marine and coastal waters [12,23]. Bio-medicated flocculation and SPM dynamics are important in science and engineering because they eventually control the sediment, carbonaceous, and nitrogenous mass balances at the regional or global scale [24,25]. Despite their importance, bio-mediated flocculation and SPM dynamics are not fully understood in coastal and marine waters. Geologists and hydraulic engineers have focused more on sediments and less on biomass [3,14], and marine biologists vice versa [16]. In our opinion, the biomass-sediment interactions in coastal and marine waters have only recently been studied in a systematic and quantitative way [7,9,13,26–29], and mathematical models which can take into account the heterogeneous composition/morphology of biomineral aggregates were developed only a few years ago [12,30]. These efforts should be paid more attention. Therefore, the aim of the study was to add to our current understanding of bio-mediated flocculation and its impact on the SPM in marine and coastal waters. First, we investigated the spatial variation of SPM dynamics in a sediment-enriched TMZ and a mineral-depleted OSZ, especially concerning bio-mediated flocculation. Second, we investigated the seasonal variation of SPM dynamics in a TMZ to understand how seasonal changes in biological activity, especially algae blooms, affect bio-mediated flocculation and SPM dynamics. This paper describes and discusses bio-mediated flocculation and SPM dynamics for different locations and seasons. 2. Materials and Methods 2.1. Site Description The study area is situated in the Southern Bight of the North Sea, specifically in the Belgian coastal zone. Measurements have indicated SPM concentrations of 20–70 mg/L in the nearshore area; reaching 100 to more than a few g/L near the bed; lower values ( did not show such a clear difference < Turbidity Maximum < Off-Shoreduring Zone > the entire study 0.25 0.25 Regular Period (MOW1) period, and their 95% confidence levels overlapped (Figure 2b). (a) B-Bank Water 2017, 9, 694 6 of 15 0.20 0.20 Reported Algae Bloom Period (MOW1) 95 % Conf Level
0.15 0.10
< Turbidity Maximum Zone >
0.25
POC / SPM
0.05
(a)
0.20
0.00 0.15 04 05 0.25 PON / POC
0.20
0.10
0.25
12
06
07
08
09
10
11
1000
200
06
07
08
09
10
11
12
05
06
07
08
09
10
11
12
0.10
0.20 0.15
06
05
07
08
09
10
11
0.00 0.10 04 12 0.05
06
07
08
09
10
11
12
05
06
07
08
09
10
11
12
0.00 04
100
05
06
07
08
09
10
11
12
1000
(c)
10 100
100 Measured in a Spring Tide with High Peak Flow
1 10
10
05 1 (d) 04
250
05
1000
04
10
0.10
0.20 0.00 12 0.15 04 0.25
(c) 0.00
100
0.00 0.15 04
0.05
0.05
SPM (mg/L)
SPM (mg/L)
11
0.15
1 04
250
150 D50 (m)
D50 (m)
10
(b)
0.20
PON / POC
05
0.00 0.10 04 05
0 04
200
06 07a Spring 08 09 Peak Flow 10 Measured in Tide with High 05
06
07
08
09
10
11 11
12 12
04 2501 200
04
05
06 06
07 07
08 08
09 09
10 10
11 11
12
12
150 200
150
100 150
100
50 100 50 0
50 0 05 04
05
250
(d)
06
05 1.6 1.4 (e) 1.6 1.4 (e) 1.2 1.2 1.0 1.0 0.8 0.8 0.6 0.6 0.4 0.4 0.2 0.2 0.0 0.0 04 05 06 04 05
07
08
09 08
10
11
06
07
09
10
11
0607
07 08 08 09 09 YearYear
10 10
1111
U (m/s)
U (m/s)
09
B-Bank G-Bank K-Bank
0.25 0.05
0.00 04
0.05
50
08
0.20
(b)
0.10
100
0.25
0.05
0.05
0.15
1000
07
< Off-Shore Zone >
0.10
Regular Period (MOW1) Reported Algae Bloom Period (MOW1) 95 % Conf Level
06
G-Bank K-Bank
0.15
12 12
004 04
1.6 1.4 1.6 1.4 1.2 1.2 1.0 1.0 0.8 0.8 0.6 0.6 0.4 0.4 0.2 0.2 0.0 0.0 12 04 12 04
05
06
07
05
06
07
05 05
0606
0707
08 08
09 09
10
11
10
11
12
08 08 09 09 10 Year Year
10 11
1112
12
12
2. Spatial seasonal variation experimental indices indices in sites, during the the FigureFigure 2. Spatial Spatial and and seasonal variation ofofexperimental experimental indices inthe themeasurement measurement sites, during the Figure 2. and seasonal variation of in the measurement sites, during entire measurement period, from 2004 to 2011. The left and right panels illustrate the data obtained entire measurement measurementperiod, period,from from 2004 2011. right panels illustrate the obtained data obtained entire 2004 to to 2011. TheThe leftleft andand right panels illustrate the data from from the turbidity maximum zone (TMZ) and the offshore zone (OSZ), respectively. (a) POC content from the turbidity maximum zone (TMZ) and the offshore zone (OSZ), respectively. (a)content POC content the turbidity maximum zone (TMZ) and the offshore zone (OSZ), respectively. (a) POC in the in the SPM; (b) POC/PON ratio; (c) SPM concentration; (d) D50: median of the volumetric in the(b)SPM; (b) POC/PON ratio; (c) SPM concentration; (d)of D50: median of the volumetric SPM; POC/PON ratio; (c) SPM concentration; (d) D50: median the volumetric particle/aggregate particle/aggregate size distribution; (e) U: flow velocity; MOW1: measurement site in the TMZ; particle/aggregate size distribution; (e) U: flow velocity; MOW1: measurement site in the TMZ; size distribution; (e) U: velocity; MOW1:sites measurement B-Bank, G-Bank, andflow K-Bank: measurement in the OSZ. site in the TMZ; B-Bank, G-Bank, and B-Bank, G-Bank, and K-Bank: sites in the OSZ. K-Bank: measurement sites in measurement the OSZ.
Figure 3. Scatter plot of POC content (% of SPM) versus SPM concentration. The coupled data sets of POC content and SPM concentration were obtained from all the 13 h measurement campaigns.
Figure 3. Scatter plot of POC content (% of SPM) versus SPM concentration. The coupled data sets of FigureSPM 3. Scatter plot of POC (%are of SPM) SPM concentration. The coupled sets of concentrations in content the TMZ aboutversus an order magnitude higher than those data in the OSZ POC content content and SPM SPM concentration concentration were were obtained obtained from from all all the the13 13hhmeasurement measurementcampaigns. campaigns. POC (Figure 2c), and similar to the satellite images of SPM concentration in Figure 1. This observation
SPM concentrations in the TMZ are about an order magnitude higher than those in the OSZ (Figure 2c), similar to the satellite images of SPM concentration in Figure 1. This observation
Water 2017, 9, 694
7 of 15
SPM concentrations in the TMZ are about an order magnitude higher than those in the OSZ (Figure 2c), similar to the satellite images of SPM concentration in Figure 1. This observation suggests that a substantial amount of sediment resides in the TMZ, which is transported back and forth in the flood and ebb tides. In addition, SPM concentrations in the TMZ were more vulnerable to flow intensity. High flow velocity (U) was found to increase SPM concentrations (e.g., 29 March 2006, 7 February 2008, 10 February 2009 and 21 March 2011, in Figure 2), because it increases sediment erosion and resuspension from the sea floor. It is also important to note that the TMZ had a two to three times smaller aggregate size (D50; median of the volumetric particle/aggregate size distribution) than the OSZ (Figure 2d) [15]. Thus, the TMZ enriched with sediments (i.e., higher SPM concentration and lower POC/SPM) had a lower flocculation capability (i.e., lower D50) than the OSZ. Tang and Maggi reported that small, dense aggregates are formed in sediment(mineral)-enriched environments, such as the TMZ in this study, whereas large, fluffy aggregates are formed in biomass-enriched environments [13,29]. The former was defined as mineral or biomineral aggregates, and the latter as biological aggregates. SPM and POC concentrations and D50 in the TMZ were subject to ups and downs during the 13-h tidal cycle (Figure 4a). Generally, SPM and POC concentrations increased to their maximum around the peak flows. Biomass and minerals were likely combined in large, settleable biomineral aggregates, because SPM and POC concentrations had the same up-and-down movement during a tidal cycle. Such biomineral aggregates in the TMZ are vulnerable to aggregation and disaggregation (i.e., breakup), depending on the flow intensity (turbulence), available aggregation time to reach the equilibrium aggregate size, and organic matter content, therefore changing D50 in a flow-varying tidal cycle [5,18]. D50 increased to the maximum when approaching slack water, but decreased to a minimum around peak flow. Regarding flocculation kinetics, aggregation kinetics dominated over disaggregation kinetics for the slack water, and vice versa for the peak flow [5,18]. In contrast, SPM and POC concentrations and D50 in the OSZ were rather constant, randomly scattered without apparent ups and downs (Figure 4b), showing that aggregation kinetics dominate over disaggregation kinetics for the entire period. SPM in the OSZ might be mainly composed of biomass and some mineral particles, building more shear-resistant and less settleable marine snow [46]. Although biological aggregates (i.e., marine snow) are usually much larger, up to several millimeters, than mineral or biomineral aggregates, they settle more slowly because of their low density and fluffy structure [30]. The latter is confirmed by an earlier study [38], where the excess density of aggregates has been calculated for some of the tidal cycles investigated here; the mean excess density was 550 kg/m3 and the mean D50 of the aggregates 65 µm (five tidal cycles) in the TMZ versus 180 kg/m3 and 115 µm (three tidal cycles) in the OSZ. Although both the TMZ and the OSZ are governed by tidal dynamics, small differences in the current regime occur between both areas [15], as is also shown in Figure 4. The TMZ is situated in the nearshore, where the current ellipses are more elongated, whereas more offshore, the ellipses tend to be more spherical. This will cause higher velocity gradients, stronger turbulence, more stress exerted on the aggregates, and a reduction of the time needed for the aggregates to reach equilibrium size in the TMZ. Considering these differences in hydrodynamics, the mineral and biomineral aggregates in the TMZ are more susceptible to the hydrodynamics than the biological aggregates in the OSZ. Time series of the PSDs during the 13 h tidal cycles are shown in Figure 5, for the TMZ and OSZ, respectively. PSDs in the TMZ skewed toward a smaller size around peak flow (e.g., t = 3, 4 h at location MOW1 on 10 July 2007) and then to a larger size around slack water (e.g., t = 6, 7 h). Except for the PSDs in 23 October 2007, the other PSDs in the TMZ showed bimodality, comprising microflocs (20–200 µm) and macroflocs (>200 µm), as reported in the earlier studies [5]. The primary peak of microflocs in a PSD was prominent around the peak flow. However, while approaching the slack water, the secondary peak of macroflocs became dominant over the primary peak. Low flow/turbulence intensity might promote the aggregation of microflocs (i.e., mineral, biomineral aggregates) to macroflocs (i.e., biological aggregates) [4,5,18]. On the other hand, large hardly-settleable biological aggregates
Water 2017, 9, 694
8 of 15
which were suspended in the water column might dominate in the slack water. Maggi and Tang recently reported that larger biological aggregates can be lighter and even settle slower than smaller Water 2017, 9, 694 8 of 15 in the mineral, bio-mineral aggregates [13]. Here, larger biological aggregates can be suspended slack water, while smaller mineral, bio-mineral aggregates settle and deposit, thereby developing the aggregates can be suspended in the slack water, while smaller mineral, bio-mineral aggregates secondary peak of biological aggregates. settle and deposit, thereby developing the secondary peak of biological aggregates. (a) Turbidity Maximum Zone
0.5 0.0
D50 (m)
100
0.0 2
4
6
8
10
12
6
8
10
12
200 150
N/A for Flow Velocity
100 50 0
2
4
6
8
10
0
12
MOW1 Nov / 5 / 2008 D50 (m)
200 160 120 80 40
2
4
200
1.0
150
0.8 0.6
100
0.4
50
0.2
0
0 2
4
6
1000
8
10
MOW1 Feb / 10 / 2009
800 600 400 200
0.0 0
12
D50 (m)
SPM (mg/L)
0.2 0
12
MOW1 Oct / 23 / 2007
0
POC (mg/L)
10
200
0 14 12 10 8 6 4 2 0
8
300
240
SPM (mg/L)
POC (mg/L)
2
6
400
0
4
0.4
50
0
8 6
4
500
SPM (mg/L)
POC (mg/L)
16 14 12 10 8 6 4 2 0
2
0.8 0.6
100
0 0
1.0
Flow Velo (m/s)
1.0
150
2
4
6
8
10
12
200
1.6
150
1.2
100
0.8
50
0.4
0
0 0
2
4
6
8
10
12
Flow Velo (m/s)
1.5
Flow Velocity Floc Size (D50)
200
MOW1 Jul / 10 / 2007
Flow Velo (m/s)
2.0
SPM POC
140 120 100 80 60 40 20 0
D50 (m)
2.5
SPM (mg/L)
POC (mg/L)
3.0
0.0 0
2
4
6
8
10
12
Hours
1 0
0.0
6
8
10
0.6
100
0.4
12
0.2
G-Bank Jun / 25 / 2009
6 4 2
0.0 0
2
4
6
8
10
12
300
1.2
250
1.0
200
0.8
150
0.6
100
0.4
50
0
0.2
0 2
4
6
50
8
10
12
K-Bank Feb / 1 / 2011
40 30 20 10
0.0 0
D50 (m)
SPM (mg/L)
0.5
4
D50 (m)
SPM (mg/L)
POC (mg/L) POC (mg/L)
1.0
2
8
0
1.5
0.8
150
0
10
2.0
1.0
200
50 0
0.7 0.6 0.5 0.4 0.3 0.2 0.1 0.0
1.2
250
2
4
6
8
10
12
300
1.2
250
1.0
200
0.8
150
0.6
100
0.4
50
0.2
0
0 0
2
4
6
Hours
8
10
12
Flow Velo (m/s)
2
300
Flow Velo (m/s)
3
K-Bank May / 3 / 2007 D50 (m)
4
SPM (mg/L)
POC (mg/L)
5
40 35 30 25 20 15 10 5
Flow Velo (m/s)
(b) Off Shore Zone 6
0.0 0
2
4
6
8
10
12
Hours
Figure 4. Dynamic behaviors of suspended particulate matter (SPM) and particulate organic carbon
Figure 4. Dynamic behaviors of suspended particulate matter (SPM) and particulate organic carbon (POC) concentrations and aggregate size (D50) in 13-h tidal cycles, in (a) the turbidity maximum (POC) concentrations and aggregate size (D50) in 13-h tidal cycles, in (a) the turbidity maximum zone (TMZ) and (b) the offshore zone (OSZ). Each set of the SPM/POC and D50 data was measured zone (TMZ) and (b) the offshore zone (OSZ). Each set of the SPM/POC and D50 data was measured on a specific date of a field campaign. MOW1: measurement site in the TMZ; K-Bank and G-Bank: on ameasurement specific date of in a field campaign. MOW1: measurement site in the TMZ; K-Bank and G-Bank: sites the OSZ. measurement sites in the OSZ. However, PSDs in the OSZ remained rather constant during the entire tidal cycle, consistently skewing toward a in larger 5b). rather A substantial fraction of the the entire PSDs occupied the consistently upper However, PSDs the size OSZ(Figure remained constant during tidal cycle, most measuring bin of the LISST-100X instrument (i.e., 500 μm). Aggregates in the OSZ, even with skewing toward a larger size (Figure 5b). A substantial fraction of the PSDs occupied the upper such a large size, apparently did not properly settle but floated in the water column (see also the most measuring bin of the LISST-100X instrument (i.e., 500 µm). Aggregates in the OSZ, even previous paragraph and Figure 4). Thus, SPM in the OSZ is likely composed of large but light, withfluffy, such and a large size, apparently did not properly settle but floated in the water column (see also hardly-settleable biological aggregates (i.e., marine snow), whereas SPM in the TMZ the comprises previous paragraph and Figure 4). Thus, SPM in the OSZ is likely composed of large dense, compact, and readly-setteable mineral, biomineral aggregates, as well as but light, fluffy, and hardly-settleable (i.e., marineissnow), whereas SPM in the biological aggregates [13,29,30,46].biological However, aggregates note that this argument supported by a rather
Water 2017, 9, 694
9 of 15
TMZ comprises dense, compact, and readly-setteable mineral, biomineral aggregates, as well as Water 2017, 9, 694 9 of 15 biological aggregates [13,29,30,46]. However, note that this argument is supported by a rather indirect measurement of SPM dynamics this research and observations from earlier studies. ways of indirect measurement of SPMindynamics in this research and observations from earlierDirect studies. measuring aggregate morphology might be required in the future to explain realistic structures Direct ways of measuring aggregate morphology might be required in the future to explain realistic and behaviors of mineral, biomineral, andbiomineral, biological and aggregates. structures and behaviors of mineral, biological aggregates.
dF / dln(D) ( /m)
dF / dln(D) ( /m)
dF / dln(D) ( /m)
dF / dln(D) ( /m)
(a) Turbidity Maximum Zone Peak Flow t = 3 hr
0.6
4 hr
Slack Water 6 hr
5 hr
0.4
MOW1 - Jul/10/2007
7 hr Meas
8 hr
0.2 0.0 1 0.6
10
100
1
10 100
1
Peak Flow 4 hr
t = 3 hr
10
100
1
5 hr
10
100
1
10
100
1
6 hr
10 100
dF / dln(D) ( /m) dF / dln(D) ( /m)
1
10
100
MOW1 - Oct/23/2007
Slack Water 7 hr
8 hr
9 hr
0.4 0.2 0.0 1
10 100
1
Peak Flow t = 2 hr
0.6
10
100
1
3 hr
10
100
1
10
100
1
4 hr
10
100
1
10
100
1
10
100
MOW1 - Nov/5/2008
Slack Water 5 hr
6 hr
7 hr
8 hr
0.4 0.2 0.0 1 0.6
10 100
1
t = 3 hr
10
100
1
10
100
1
Peak Flow 4.5 hr
4 hr
10
100
1
10
100
7 hr
6 hr
1 10 100 1 10 100 Slack Water MOW1 - Feb/10/2009 9 hr 8 hr
0.4 0.2 0.0 1
10
100
1
10
100
1
10 100
1 10 100 1 Floc Diameter (m)
10 100
1
10
(b) Off Shore Zone
dF / dln(D) ( /m)
9 hr
0.6
Peak Flow 4 hr
t = 3 hr
5 hr
1
10 100
K-Bank - May/3/2007
Slack Water 7 hr
6 hr
100
8 hr
9 hr
0.4 0.2 0.0 1 0.6
10
100
1
10
100
1
Peak Flow 4 hr
t = 3 hr
10
100
1
5 hr
10
100
1
10
100
1
6 hr
10
100
1
10
100
G-Bank - Jun/25/2009
Slack Water 7 hr
8 hr
9 hr
0.4 0.2 0.0 1 0.6
10
100
1
10
100
1
Peak Flow 4 hr
t = 3 hr
10
100
5 hr
1
10
100
1
6 hr
10
100
1
10
100
1
10
100
K-Bank - Feb/1/2011
Slack Water 7 hr
8 hr
9 hr
0.4 0.2 0.0 1
10
100
1
10
100
1
10
100
1 10 100 1 Floc Diameter (m)
10
100
1
10
100
1
10
100
Figure 5. Particle size distributions (PSDs) of suspended particulate matter (SPM) in 13-h tidal
Figure 5. Particle size distributions (PSDs) of suspended particulate matter (SPM) in 13-h tidal cycles, cycles, for (a) the turbidity maximum zone (TMZ) (MOW1) and (b) the offshore zone (OSZ) (K-Bank for (a) the turbidity maximum zone (TMZ) (MOW1) and (b) the offshore zone (OSZ) (K-Bank and and G-Bank). Each set of the PSDs was measured on a specific date of a field campaign. Each PSD G-Bank). Each on setaof the PSDsscale, was and measured on aofspecific date a field campaign. Each was plotted logarithmic the fraction a size bin wasofnormalized by the width of PSD the was plotted on a logarithmic scale, and the fraction of a size bin was normalized by the width of the size size bin in y-axis. Thus, dF/dln (D) is the normalized volumetric fraction by the width of the size bin in y-axis. is the normalized volumetric fractionfunction by the width interval in Thus, the logdF/dln scale, in(D) accordance with the lognormal distribution [5,47]. of the size interval in the log scale, in accordance with the lognormal distribution function [5,47].
Water 2017, 9, 694
10 of 15
Water 2017, 9, 694
10 of 15
3.3. 3.3. SPM SPM Dynamics Dynamics during during the the Algae Algae Bloom Bloom and andNormal NormalPeriods Periodsin inthe theTMZ TMZ Flow Flow intensity intensity of of the the spring spring and and neap neap tides tides was was found found to to alter alterSPM SPMproperties properties (e.g., (e.g., aggregate aggregate size and settling velocity) and SPM dynamics (e.g., flocculation, sedimentation, and deposition) size and settling velocity) and SPM dynamics (e.g., flocculation, sedimentation, and deposition) in in the the TMZ TMZ (i.e., (i.e., the the MOW1 MOW1 site). site). A A spring spring tide, tide, associated associated with with aa strong strong peak peak flow flow (up (upto to1.5 1.5m/s), m/s), increased substantially, compared compared to toaaneap neaptide tidewith witha aweak weakpeak peak flow (up increased SPM SPM concentrations concentrations substantially, flow (up to to 1.0 m/s). For example, SPM concentrations increased up to 800 mg/L during a spring tide 1.0 m/s). For example, SPM concentrations increased up to 800 mg/L during a spring tide (e.g., (e.g., MOW1—10 February in Figure 4a), whereas remained under mg/L during a neap MOW1—10 February 20092009 in Figure 4a), whereas theythey remained under 120 120 mg/L during a neap tide tide (e.g., MOW1—10 July 2007). When the pairs of the maximum SPM concentration (SPM ) and max (e.g., MOW1—10 July 2007). When the pairs of the maximum SPM concentration (SPMmax) and peak peak velocity (U ) in each tidal cycle plotted (Figure6),6),they theyare are proportional. proportional. A flow flow velocity (Umax ) max in each 13-h13-h tidal cycle areare plotted (Figure A spring spring tide tide with withhigh highUUmax max resulted resulted in in high high SPM SPMmax max,, because it it enhanced enhanced the the disaggregation, disaggregation, erosion, erosion, and and resuspension of sediment particles/aggregates. However, a neap tide with low U resulted in low resuspension of sediment particles/aggregates. However, a neap tide with low Umax max in low SPM aggregation, sedimentation, and deposition. Thus, the fate and SPMmax max, because becauseit itenhanced enhanced aggregation, sedimentation, and deposition. Thus, the transport fate and of SPM in the by aggregation-disaggregation, transport ofTMZ, SPMwhich in was the governed TMZ, which was governed by sedimentation-resuspension, aggregation-disaggregation, and erosion-deposition, highly depended on flow intensity. However, exception against the sedimentation-resuspension, and erosion-deposition, highly depended onan flow intensity. However, SPM-flow intensity relation was found duringrelation an algae bloom period. an exception against the SPM-flow intensity was found during an algae bloom period. 1200
Spring Tide
SPMmax (mg/L)
1000 800 600 400
Neap Tide 200 0 0.0
0.5
1.0
1.5
2.0
U max (m/s) Figure6.6.Plots Plots of maximum suspended particulate matter concentration versus Figure of maximum suspended particulate matter concentration (SPMmax)(SPMmax) versus maximum maximum flow velocity (Umax). SPM concentration and flow velocity were measured in the middle flow velocity (Umax). SPM concentration and flow velocity were measured in the middle of the water of the water Each point represents a pairand of SPMmax and Umax a 13-h column. Eachcolumn. point represents a pair of SPMmax Umax measured in ameasured 13-h tidal in cycle. Alltidal the cycle. All the data were measured the turbidity maximum zone (TMZ) from 2004 to 2011. data were measured in the turbidityinmaximum zone (TMZ) from 2004 to 2011.
During the the reported reported spring spring algae algae bloom bloom (MOW1—26 (MOW1—26 April April 2011 2011 in in Figure Figure 7a), 7a), SPM SPM and and POC POC During concentrationsdid didnot notshow showa aclear clearup-and-down up-and-down trend with tide, behaved similar to those in concentrations trend with tide, butbut behaved similar to those in the the OSZ. The aggregate sizes during the algae bloom period (26 April 2011 in Figure 7a) were two OSZ. The aggregate sizes during the algae bloom period (26 April 2011 in Figure 7a) were two to three to three times larger than aggregates normal period,atmeasured at the site later four times larger than aggregates during the during normalthe period, measured the same site foursame months months later (18inAugust in Figureaggregates 7b). Although wereµm) enlarged μm) during (18 August 2011 Figure 2011 7b). Although wereaggregates enlarged (>100 during(>100 the algae bloom the algae bloom period, they did not show a clear sign of downward settling. Considering that such period, they did not show a clear sign of downward settling. Considering that such large aggregates large aggregates duringperiod the algae period were subject to afloatation a clear sign of during the algae bloom werebloom subject to floatation without clear signwithout of sedimentation and sedimentationthey andwere resuspension, were found to be lighter lessa settleable than and during resuspension, found to bethey lighter and less settleable than and during regular period, thusa regular period, and thus more similar to the marine snow (i.e., biological aggregates) found in the more similar to the marine snow (i.e., biological aggregates) found in the OSZ (see Section 3.2). In the OSZ (see Section 3.2). In the TMZ, two different aggregates may thus occur: (1) sediment-enriched, TMZ, two different aggregates may thus occur: (1) sediment-enriched, dense, and settleable biomineral dense, and during settleable biomineral aggregates during normal periods; andless (2) biomass-enriched, light, aggregates normal periods; and (2) biomass-enriched, light, and settleable marine snow and less settleable marine snow during algal bloom periods (Figure 8). The latter type of aggregate during algal bloom periods (Figure 8). The latter type of aggregate corresponds better to the one corresponds better to the one observed in the OSZ. The aggregates occurring during algae bloom observed in the OSZ. The aggregates occurring during algae bloom periods or in the OSZ have a lower periods or in the OSZ have a lower settling velocity as a larger fraction is composed of organic matter and sticky bio-polymers organized in a fluffy structure [16,48].
Water 2017, 9, 694
11 of 15
settling velocity as a larger fraction is composed of organic matter and sticky bio-polymers organized in a Water fluffy structure [16,48]. 1111ofof1515 Water2017, 2017,9,9,694 694 (a) (a)Algal AlgalBloom BloomPeriod Period(TMZ): (TMZ):MOW1 MOW1- -26/Apr/2011 26/Apr/2011
11 00
180 180 160 160 140 140 120 120 100 100 8080 6060 4040 2020 00 00
D50 (m) D50 (m)
22
SPM (mg/L) SPM (mg/L)
POC (mg/L) POC (mg/L)
33
SPM SPM POC POC
7070 6060 5050 4040 3030 2020 1010 00 00
44
22
44
66
88
1010
1212
Flow FlowVelocity Velocity Floc FlocSize Size(D50) (D50)
N/A N/AforforFlow FlowVelocity Velocity 22
44
66
dF / dln(D) ( /m) dF / dln(D) ( /m)
Hours Hours 0.6 0.6 t =t =3 3hrhr
7 6 5 4 3 2 1 0
200 200
5 5hrhr
4 4hrhr
88
1010
1212
Hours Hours 6 6hrhr
7 7hrhr
8 8hrhr
9 9hrhr
0.4 0.4 0.2 0.2 0.0 0.0 11
1010 100 100
11
11
1010 100 100
1010 100 100
1 1 1010 100 11 100 Floc FlocDiameter Diameter(m) (m)
1010 100 100
11
1010 100 100
11
1010 100 100
100 100
Col 1 vs Col 2 2 Col 1 vs Col
5050 0 0 0 0
2 2
4 4
6 6
8 8
1010
1212
dF/ dln(D) ( /m) dF/ dln(D) ( /m)
Hours Hours
Slack Water Slack Water
0.6 0.6 t = 22 hrhr t =
44 hrhr
100 100
1.2 1.2
8080
1.0 1.0
D50(m) D50(m)
150 150
0.8 0.8
6060
0.6 0.6
4040
0.4 0.4
2020 0 0 0 0
0.2 0.2 0.0 0.0 2 2
4 4
Peak Flow Peak Flow 55 hrhr
66 hrhr
77 hrhr
6 6
8 8
1010
FlowVelo. (m/s) FlowVelo. (m/s)
SPM(mg/L) SPM(mg/L)
POC(mg/L) POC(mg/L)
(b) (b)Regular RegularPeriod Period(TMZ): (TMZ):MOW1 MOW1- -18/Aug/2011 18/Aug/2011 7 6 5 4 3 2 1 0
1212
Hours Hours 88 hrhr
99 hrhr
0.4 0.4 0.2 0.2 0.0 0.0 11
10 10
100 100
11
10 10
100 100
11
10 10
100 100
11 10 11 10 100 100 Floc Diameter (m) Floc Diameter (m)
10 10
100 100
11
10 10
100 100
11
10 10
100 100
Figure Figure7.7.Dynamic Dynamicbehaviors behaviorsofofsuspended suspendedparticulate particulatematter matter(SPM) (SPM)and andparticulate particulateorganic organiccarbon carbon
Figure 7. Dynamic behaviors of suspended particulate matter (SPM) and particulate organic carbon (POC) (POC)concentrations, concentrations,aggregate aggregatesize size(D50), (D50),and andparticle particlesize sizedistribution distribution(PSD) (PSD)ininaa13-h 13-htidal tidalcycle. cycle. (POC) concentrations, aggregate size (D50), and particle size distribution (PSD) in a 13-h tidal cycle. The Thetwo twodata datasets setswere werecollected collectedininthe theTMZ TMZ(i.e., (i.e.,the theMOW1 MOW1site) site)on ondifferent differentdates datesinin2011, 2011, The representing two data sets(a) were collected in theand TMZ theperiods. MOW1 algal bloom (b) regular representing (a) algal bloomperiod period and (b)(i.e., regular periods.site) on different dates in 2011, representing (a) algal bloom period and (b) regular periods.
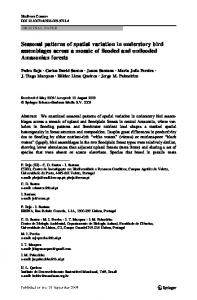
Figure 8. Schematic diagrams ofof (a) biomineral aggregates maximum zone(TMZ) (TMZ) and Figure 8.8.Schematic diagrams biomineral aggregates ininthe the turbidity Figure Schematic diagrams of(a) (a) biomineral aggregatesin theturbidity turbiditymaximum maximumzone zone (TMZ) (b) biological marine snow in the offshore zone (OSZ). EPS: extracellular polymeric substances. and and(b) (b)biological biologicalmarine marinesnow snowininthe theoffshore offshorezone zone(OSZ). (OSZ).EPS: EPS:extracellular extracellularpolymeric polymericsubstances. substances.
Previous Previousstudies, studies,carried carriedout outininthe thesame sameTMZ, TMZ,reported reportedthat thatlarge largeand andsettleable settleablebiomineral biomineral Previous studies, carried out in the same TMZ, reported that large and settleable biomineral aggregates aggregateswere weredominant dominantSPM SPMspecies speciesduring duringbio-enriched bio-enrichedspring springand andsummer summerperiods periods[31,32]. [31,32]. aggregates were dominant SPM species during bio-enriched spring and summer periods [31,32]. These Theselarge, large,settleable settleablebiomineral biomineralaggregates aggregatesare arecontrary contrarytotoless lesssettleable settleablebiological biologicalaggregates aggregates These large, in settleable biomineral aggregates are contrary tothat lessthe settleable biological aggregates observed study. ititisisimportant totonote SPM ininthis observed inthis thiscurrent current study.However, However, important note that the SPMsamples samples thisstudy study observed in this current study. However, it is important to note that the SPM samples in this study were taken in the middle of the water column, well above the near-bed layer. Dense, compacted, were taken in the middle of the water column, well above the near-bed layer. Dense, compacted, wereand taken in the middle of the water column, well above the near-bed layer. Dense, compacted, settleable biomineral aggregates might be stored in the near-bed layer, causing and settleable biomineral aggregates might be stored in the near-bed layer, causing and mineral-depletion column, hence and hardly mineral-depletion inthe thewater watermight column, and hence lessdense, dense,fluffy, fluffy, and hardlysettleable settleablebiological biologicalin the settleable biomineral in aggregates beand stored in less the near-bed layer, causing mineral-depletion aggregates be and around ininthe Enhanced primary production aggregates might beformed formed andfloat float around thewater watercolumn. column. Enhanced primarymight production water column, might and hence less dense, fluffy, and hardly settleable biological aggregates be formed an period generates more particle-binding polymeric such during analgal algal bloom period generates moresticky, sticky, particle-binding polymeric substances, suchasas and during float around inbloom the water column. Enhanced primary production duringsubstances, an algal bloom period EPSs and TEPs. These sticky polymeric substances can not only enhance flocculation, but also EPSs and TEPs. These sticky polymeric substances can not only enhance flocculation, but also generates more sticky, particle-binding polymeric substances, such as EPSs and TEPs. These sticky reduce reducethe theerosion erosionand andresuspension resuspensionofofmuddy muddydeposits depositsfrom fromthe theseabed seabedtotothe thewater watercolumn column[49]. [49].
polymeric substances can not only enhance flocculation, but also reduce the erosion and resuspension
Water 2017, 9, 694
12 of 15
of muddy deposits from the seabed to the water column [49]. A large amount of cohesive sediments are thus stored in or on the seafloor as a fluid-mud layer or a muddy deposit, and the marine snow with more biomass and less sediments is suspended in the water column [3]. This SPM behavior during an algal bloom period with high primary production agrees with the satellite images of low SPM and high Chl concentrations in summer (Figure 1). Similar observations were made in the port of Zeebrugge. High primary production and low turbulence in summer provoked a large amount of mud deposition in the near-bed layer (or formation of a fluid mud layer) and reduction of the SPM concentration in the water column. Reviewing other studies [28,50] revealed similar SPM dynamics around an algal bloom period. Proliferation of a specific algae group could enhance flocculation and store sediments in the near-bed layer, and hence could cause large but suspended biological aggregates and a low SPM concentration in the water column. Maerz and co-workers [51] have been looking at the whole gradient from the nearshore TMZ to the OSZ; they have found a maximum settling velocity in the transition zone between the TMZ and the OSZ where the aggregates are larger as compared to near-coast TMZ and denser as compared to the low turbid OSZ. This maximum in settling velocity is caused by similar gradients in aggregate size, POC content, density, and chlorophyll concentration than found in our data. The fact that algae are involved in these observed gradients points to seasonal influences. Another study [52], however, does not confirm the leading role of the algae bloom on SPM dynamics. The reason for these different findings may be due to differences in, amongst others, hydrodynamics, wave climate, nutrient availability, and algae species at the different study sites. The importance of each of these parameters will explain to a smaller or larger part the observed seasonal variations in SPM dynamics. Biomineral and biological aggregates are often approximated by a single parameter (e.g., a characteristic diameter) in practical applications, although they are very different in composition and mechanical property. For example, a traditional aggregate structure model, based on fractal theory, includes only mineral particles and disregards organic matter, which is instead assumed to be part of the pore space for simplicity and ease [53,54]. This approximation might not be valid for biological aggregates (i.e., marine snow) with a high content of organic matter or in environments where aggregate properties change in time (regular versus algae bloom period) or space (inside and outside harbours). Thus, the heterogeneity of aggregates, at least the two fractions of biomass and sediments, should be considered when developing a rigorous aggregate structure model and accurately predicting the fate and transport of biomass and sediments in marine and coastal waters [30]. A higher biomass content (indicated by a higher POC/SPM ratio) was generally found to enhance flocculation, thereby increasing aggregate size. However, the quantity of biomass is not the only factor determining the flocculation capability. For example, in June 2009 at G-Bank (Figure 2a), aggregate size increased to over 200 µm, even with a low POC/SPM. Besides the quantity of biomass, the quality, such as stickiness, is important for controlling flocculation kinetics, as reported in previous research [50,55]. Specifically, extracellular polymeric substances (EPSs) or transparent extracellular polymers (TEPs) are sticky and increase flocculation [19,20,22,23]. Long polymeric chain structures of EPSs and TEPs, which are produced by aquatic microorganisms (e.g., algae), can bind biomass and sediment particles to large mineral, biomineral, and biological aggregates. Even in an unfavorable chemical condition for flocculation (e.g., terrestrial water with low ionic strength), a small amount of EPSs and TEPs can cause substantial flocculation, because they can overcome the electrostatic repulsive force of negatively-charged colloidal particles and bind such particles to large aggregates [56,57]. Therefore, qualitative measures of biomass, such as EPS and/or TEP concentration, likely need to be included to explain bio-mediated flocculation and SPM dynamics in marine and coastal waters. 4. Conclusions The monitoring and analysis of SPM dynamics explained how organic biomass and inorganic sediment interact with each other to build large biomineral aggregates or marine snow in marine and coastal waters. SPM in the TMZ and OSZ had a similar mineralogical composition, but encountered
Water 2017, 9, 694
13 of 15
different fates in association with biomass. SPM in the TMZ built sediment-enriched, dense, and settleable biomineral aggregates, whereas SPM in the OSZ was composed of biomass-enriched, light, and less settleable marine snow. Biological proliferation, such as an algae bloom, also facilitated the occurrence of marine snow in the water column, even in the TMZ. Enhanced flocculation in summer could also scavenge SPM in the water column down to the sea bed, resulting in a low SPM concentration in the water column. In short, bio-mediated flocculation and SPM dynamics were found to vary spatially and seasonally, affected by the biota. The proposed concept to combine organic and mineral particles in aggregates will help us to better understand and predict bio-mediated flocculation and SPM dynamics in marine and coastal waters. Acknowledgments: This research was supported by the Basic Science Research Program through the National Research Foundation of Korea (NRF) funded by the Ministry of Education (No: NRF-2017R1D1A3B03035269), the Maritime Access Division of the Flemish Ministry of Mobility and Public Works (MOMO project), and the Belgian Science Policy (BELSPO) within the BRAIN-be program (INDI67 project). The ship time RV Belgica was provided by BELSPO and the RBINS–Operational Directorate Natural Environment. Author Contributions: M.F. conceived, designed, and performed the experiments; B.J.L. analyzed the experimental data; and M.F. and B.J.L. wrote the paper. Conflicts of Interest: The authors declare no conflict of interest.
References 1.
2. 3. 4. 5. 6. 7. 8. 9. 10.
11. 12. 13. 14. 15.
Ouillon, S.; Douillet, P.; Andrefouet, S. Coupling satellite data with in situ measurements and numerical modeling to study fine suspended-sediment transport: A study for the lagoon of New Caledonia. Coral Reefs 2004, 23, 109–122. Perianez, R. Modelling the transport of suspended particulate matter by the Rhone River plume (France). Implications for pollutant dispersion. Environ. Pollut. 2005, 133, 351–364. [CrossRef] [PubMed] Winterwerp, J.; van Kesteren, W. Introduction to the Physics of Cohesive Sediment in the Marine Environment; Elsevier B.V.: Amsterdam, The Netherlands, 2004. Lee, B.J.; Toorman, E.; Molz, F.J.; Wang, J. A two-class population balance equation yielding bimodal flocculation of marine or estuarine sediments. Water Res. 2011, 45, 2131–2145. [CrossRef] [PubMed] Lee, B.J.; Fettweis, M.; Toorman, E.; Molz, F.J. Multimodality of a particle size distribution of cohesive suspended particulate matters in a coastal zone. J. Geophys. Res. Oceans 2012, 117, C03014. [CrossRef] Chen, M.S.; Wartel, S.; Temmerman, S. Seasonal variation of floc characteristics on tidal flats, the Scheldt estuary. Hydrobiologia 2005, 540, 181–195. [CrossRef] Droppo, I.G. Rethinking what constitutes suspended sediment. Hydrol. Process. 2001, 15, 1551–1564. [CrossRef] Eisma, D. Flocculation and de-flocculation of suspended matter in estuaries. Neth. J. Sea Res. 1986, 20, 183–199. [CrossRef] Droppo, I.; Leppard, G.; Liss, S.; Milligan, T. Flocculation in Natural and Engineered Environmental Systems; CRC Press Inc.: Boca Raton, FL, USA, 2005. Jago, C.F.; Kennaway, G.M.; Novarino, G.; Jones, S.E. Size and settling velocity of suspended flocs during a phaeocystis bloom in the tidally stirred Irish Sea, NW European Shelf. Mar. Ecol. Prog. Ser. 2007, 345, 51–61. [CrossRef] Tan, X.L.; Zhang, G.P.; Yi, H.; Reed, A.H.; Furukawa, Y. Characterization of particle size and settling velocity of cohesive sediments affected by a neutral exopolymer. Int. J. Sediment Res. 2012, 27, 473–485. [CrossRef] Maggi, F. Biological flocculation of suspended particles in nutrient-rich aqueous ecosystems. J. Hydrol. 2009, 376, 116–125. [CrossRef] Maggi, F.; Tang, F.H.M. Analysis of the effect of organic matter content on the architecture and sinking of sediment aggregates. Mar. Geol. 2015, 363, 102–111. [CrossRef] Van Leussen, W. Estuarine Macroflocs: Their Role in Fine-Grained Sediment Transport. Ph.D. Thesis, Utrecht University, Utrecht, The Netherlands, February 1994. Fettweis, M.; Francken, F.; Pison, V.; Van den Eynde, D. Suspended particulate matter dynamics and aggregate sizes in a high turbidity area. Mar. Geol. 2006, 235, 63–74. [CrossRef]
Water 2017, 9, 694
16. 17. 18. 19. 20. 21.
22. 23.
24.
25. 26. 27. 28.
29. 30. 31. 32. 33.
34. 35.
36. 37. 38.
14 of 15
Alldredge, A.; Silver, M. Characteristics, dynamics and significance of marine snow. Prog. Oceanogr. 1988, 20, 41–82. [CrossRef] Markussen, T.N.; Andersen, T.J. A simple method for calculating in situ floc settling velocities based on effective density functions. Mar. Geol. 2013, 344, 10–18. [CrossRef] Lee, B.J.; Toorman, E.; Fettweis, M. Multimodal particle size distributions of fine-grained sediments: Mathematical modeling and field investigation. Ocean Dyn. 2014, 64, 429–441. [CrossRef] Passow, U. Transparent exopolymer particles (TEP) in aquatic environments. Prog. Oceanogr. 2002, 55, 287–333. [CrossRef] Engel, A.; Thoms, S.; Riebesell, U.; Rochelle-Newall, E.; Zondervan, I. Polysaccharide aggregation as a potential sink of marine dissolved organic carbon. Nature 2004, 428, 929–932. [CrossRef] [PubMed] Sahoo, G.B.; Nover, D.; Schladow, S.G.; Reuter, J.E.; Jassby, D. Development of updated algorithms to define particle dynamics in Lake Tahoe (CA-NV) USA for total maximum daily load. Water Resour. Res. 2013, 49, 7627–7643. [CrossRef] Mari, X.; Passow, U.; Migon, C.; Burd, A.; Legendre, L. Transparent Exopolymer Particles: Effects on carbon cycling in the ocean. Prog. Oceanogr. 2017, 151, 13–37. [CrossRef] Jouon, A.; Ouillon, S.; Douillet, P.; Lefebvre, J.P.; Fernandez, J.M.; Mari, X.; Froidefond, J. Spatio-temporal variability in suspended particulate matter concentration and the role of aggregation on size distribution in a coral reef lagoon. Mar. Geol. 2008, 256, 36–48. [CrossRef] Tranvik, L.J.; Downing, J.A.; Cotner, J.B.; Loiselle, S.A.; Striegl, R.G.; Ballarore, T.J.; Dillon, P.; Finlay, K.; Fortino, K.; Knoll, L.B.; et al. Lakes and reservoirs as regulators of carbon cycling and climate. Limnol. Oceanogr. 2009, 54, 2298–2314. [CrossRef] Gudasz, C.; Bastviken, D.; Premke, K.; Steger, K.; Tranvik, L.J. Constrained microbial processing of allochthonous organic carbon in boreal lake sediments. Limnol. Oceanogr. 2012, 57, 163–175. [CrossRef] Barkmann, W.; Schafer-Neth, C.; Balzer, W. Modelling aggregate formation and sedimentation of organic and mineral particles. J. Mar. Syst. 2010, 82, 81–95. [CrossRef] Burd, A.; Jackson, G. Modeling steady-state particle size spectra. Environ. Sci. Technol. 2002, 36, 323–327. [CrossRef] [PubMed] De Lucas Pardo, M.A.; Sarpe, D.; Winterwerp, J.C. Effect of algae on flocculation of suspended bed sediments in a large shallow lake. Consequences for ecology and sediment transport processes. Ocean Dyn. 2015, 65, 889–903. [CrossRef] Tang, F.H.M.; Maggi, F. A mesocosm experiment of suspended particulate matter dynamics in nutrient- and biomass-affected waters. Water Res. 2016, 89, 76–86. [CrossRef] [PubMed] Maggi, F. The settling velocity of mineral, biomineral, and biological particles and aggregates in water. J. Geophys. Res. Oceans 2013, 118, 2118–2132. [CrossRef] Fettweis, M.; Baeye, M.; Van der Zande, D.; Van den Eynde, D.; Lee, B.J. Seasonality of floc strength in the southern North Sea. J. Geophys. Res. Oceans 2014, 119, 1911–1926. [CrossRef] Fettweis, M.; Baeye, M. Seasonal variation in concentration, size and settling velocity of muddy marine flocs in the benthic boundary layer. J. Geophys. Res. Oceans 2015, 120, 5648–5667. [CrossRef] Fettweis, M.; Francken, F.; Van den Eynde, D.; Verwaest, T.; Janssens, J.; Van Lancker, V. Storm influence on SPM concentrations in a coastal turbidity maximum area with high anthropogenic impact (southern North Sea). Cont. Shelf Res. 2010, 30, 1417–1427. [CrossRef] Lacroix, G.; Ruddick, K.; Ozer, J.; Lancelot, C. Modelling the impact of the Scheldt and Rhine/Meuse plumes on the salinity distribution in Belgian waters (southern North Sea). J. Sea Res. 2004, 52, 149–163. [CrossRef] Fettweis, M.; Nechad, B.; Van den Eynde, D. An estimate of the suspended particulate matter (SPM) transport in the southern North Sea using SeaWiFS images, in situ measurements and numerical model results. Cont. Shelf Res. 2007, 27, 1568–1583. [CrossRef] Zeelmaekers, E. Computerized Qualitative and Quantitative Clay Minerology: Introduction and Application to Known Geological Cases. Ph.D. Thesis, Katholieke Universiteit Leuven, Leuven, Belgium, April 2011. Agrawal, Y.; Pottsmith, H. Instruments for particle size and settling velocity observations in sediment transport. Mar. Geol. 2000, 168, 89–114. [CrossRef] Fettweis, M. Uncertainty of excess density and settling velocity of mud flocs derived from in situ measurements. Estuar. Coast. Shelf Sci. 2008, 78, 426–436. [CrossRef]
Water 2017, 9, 694
39. 40. 41.
42.
43. 44. 45. 46.
47. 48. 49.
50. 51.
52.
53. 54. 55.
56.
57.
15 of 15
Mikkelsen, O.; Curran, K.; Hill, P.; Milligan, T. Entropy analysis of in situ particle size spectra. Estuar. Coast. Shelf Sci. 2007, 72, 615–625. [CrossRef] Andrews, S.; Nover, D.; Schladow, S. Using laser diffraction data to obtain accurate particle size distributions: The role of particle composition. Limnol. Oceanogr. Methods 2010, 8, 507–526. [CrossRef] Graham, G.W.; Davies, E.; Nimmo-Smith, A.; Bowers, D.G.; Braithwaite, K.M. Interpreting LISST-100X measurements of particles with complex shape using digital in-line holography. J. Geophys. Res. Oceans 2012, 117, C05034. [CrossRef] Mikkelsen, O.A.; Hill, P.S.; Milligan, T.; Chant, R.J. In situ particle size distributions and volume concentrations from a LISST-100 laser particle sizer and a digital floc camera. Cont. Shelf Res. 2005, 25, 1959–1978. [CrossRef] Smith, S.J.; Friedrichs, C.T. Size and settling velocities of cohesive flocs and suspended sediment aggregates in a trailing suction hopper dredge plume. Cont. Shelf Res. 2011, 31, S50–S63. [CrossRef] Davies, E.; Nimmo-Smith, A.; Agrawal, Y.; Souza, A. LISST-100 response to large particles. Mar. Geol. 2012, 307–311, 117–122. [CrossRef] Kastner, M. Oceanic minerals: Their origin, nature of their environment, and significance. Proc. Natl. Acad. Sci. USA 1999, 96, 3380–3387. [CrossRef] [PubMed] Bainbridge, Z.; Wolanski, E.; Alvarez-Romero, J.G.; Lewis, S.E.; Brodie, J.E. Fine sediment and nutrient dynamics related to particle size and floc formation in a Burdekin River flood plume, Australia. Mar. Pollut. Bull. 2012, 65, 236–248. [CrossRef] [PubMed] Hinds, W. Aerosol Technology: Properties, Behavior, and Measurement of Airborne Particles, 2nd ed.; John Wiley: New York, NY, USA, 1999. Fennessy, M.; Dyer, K.; Huntley, D. INSSEV: An instrument to measure the size and settling velocity of flocs in situ. Mar. Geol. 1994, 117, 107–117. [CrossRef] Vos, P.; De Boer, P.; Misdorp, R. Sediment stabilization by benthic diatoms in intertidal sandy shoals: Qualitative and quantitative observations. In Tide-Influenced Sedimentary Environments and Facies; D. Reidel Publishing: Dordrecht, The Netherlands, 1988; pp. 511–526. Van der Lee, W.T.B. Temporal variation of floc size and settling velocity in the Dollard estuary. Cont. Shelf Res. 2000, 20, 1495–1511. [CrossRef] Maerz, J.; Hofmeister, R.; van der Lee, E.M.; Grawe, U.; Riethmuller, R.; Wirtz, K.W. Maximum sinking velocities of suspended particulate matter in a coastal transition zone. Biogeosciences 2016, 13, 4863–4876. [CrossRef] Van der Hout, C.M.; Wittbaard, R.; Bergman, M.J.M.; Duineveld, G.C.A.; Rozemeijer, M.J.C. The dynamics of suspended particulate matter (SPM) and chlorophyll-a from intratidal to annual time scales in a coastal turbidity maximum. J. Sea Res. 2017. [CrossRef] Khelifa, A.; Hills, P.S. Models for effective density and settling velocity of flocs. J. Hydraul. Res. 2006, 44, 390–401. [CrossRef] Maggi, F. Variable fractal dimension: A major control for floc structure and flocculation kinematics of suspended cohesive sediment. J. Geophys. Res. Oceans 2007, 112, C07012. [CrossRef] Van der Lee, W.T.B. Parameters affecting mud floc size on a seasonal time scale: The impact of a phytoplankton bloom in the Dollard estuary, The Netherlands. In Coastal and Estuarine Fine Sediment Transport Processes; McAnally, W.H., Mehta, A.J., Eds.; Elsevier: Amsterdam, The Netherlands, 2001; Volume 3, pp. 403–421. Furukawa, Y.; Reed, A.H.; Zhang, G. Effect of organic matter on estuarine flocculation: A laboratory study using montmorillonite, humic acid, xanthan gum, guar gum and natural estuarine flocs. Geochem. Trans. 2014, 15, 1–9. [CrossRef] [PubMed] Lee, B.J.; Hur, J.; Toorman, E. Seasonal Variation in Flocculation Potential of River Water: Roles of the Organic Matter Pool. Water 2017, 9, 335. [CrossRef] © 2017 by the authors. Licensee MDPI, Basel, Switzerland. This article is an open access article distributed under the terms and conditions of the Creative Commons Attribution (CC BY) license (http://creativecommons.org/licenses/by/4.0/).