affects almost all areas in Jordan. Daily grass minimum temperatures at seven stations repre- senting the three geographic zones (the Jordan. Valley, mountains ...
Spatial and Temporal Distribution of Frost in Jordan Ibrahim M. Oroud Department of Geography, College of Social Sciences, Mu’tah University, Kerak, Jordan Surface frost is a permanent natural hazard that affects almost all areas in Jordan. Daily grass minimum temperatures at seven stations representing the three geographic zones (the Jordan Valley, mountains, and desert) in the country were used to carry out the analysis. A set of years ranging from 68 (for Amman Airport) to 24 years was used in this investigation. Data were tested for normality using a variety of robust statistical procedures. The main objective of the present study is to describe the stochastic nature of frost at these stations. Early and late frost and number of frost-free days were extracted in this investigation. Frost in Jordan occurs as early as the beginning of October, and late frost can last until May or even as late as June, as is the case in the southern mountains. The probability of early and late dates of frost is presented for the various stations. Compensation provided by the government should take into account the probability of frost hazard before / after the date of occurrence. There should be a critical threshold date for each region for the purposes of determining relief provided by the government following a frost event; this would minimize inefficiencies and limit risk transfer to the public domain.
port d’Amman). Ces données ont été soumises à des tests de normalité en utilisant des procédures statistiques variées. Le principal objectif de cette étude est de décrire la nature stochastique du gel en ces lieux. Les dates du gel précoce et tardif et le nombre de jours sans gel ont été extraits des relevés. En Jordanie, le gel peut se manifester dès le début du mois d’octobre, et le gel tardif peut se produire jusqu’à fin mai et même en juin, comme dans les montagnes méridionales. La probabilité des dates de gel précoce ou tardif est présentée pour les différentes stations. Les dédommagements fournis par l’État devraient prendre en compte ces probabilités du risque de gel avant et après la date des faits. Une date-seuil devrait être établie pour chaque région, de manière à déterminer le montant de l’aide accordée par l’État après un épisode de gel. Cela réduirait les inefficacités et limiterait le report des risques sur le domaine public.
Key words: natural hazard, surface frost, nocturnal cooling, hazard mitigation, hazard insurance, agriculture risk in Jordan
Introduction
Le gel de surface est un risque naturel permanent qui affecte presque toutes les régions de la Jordanie. Les températures journalières minima au niveau de l’herbe dans sept stations représentant les trois zones géographiques du pays (la vallée du Jourdain, les montagnes et le désert) ont été utilisées pour cette analyse couvrant des périodes variant de 24 à 68 années (pour l’aéro-
Mots-clés : risque naturel, gel de surface, refroidissement nocturne, mitigation des risques, assurances des risques, risque agricole en Jordanie
Frost is a natural hazard that affects most areas located outside the tropics. This hazard has deleterious consequences on many aspects of public life, such as public safety (e.g., road conditions, traffic accidents), agricultural production, water pipes, and water meters (see, e.g., Gustavsson 1990; Oroud 1993). The formation of ice on roads substantially increases traffic hazards (e.g., Knollhoff et al. 2003; Shao and Lister 1994).
The Arab World Geographer/Le Géographe du monde arabe Vol 10, No 2 (2007) 81–91 © 2007 by AWG Publishing, Toronto, Canada
82
Ibrahim M. Oroud
Drought and frost are the most damaging natural hazards in Jordan. With the exception of an intermittent narrow strip extending from the Dead Sea to the Gulf of Aqaba, frost occurs everywhere in Jordan during the cold part of the year (October through April). Additionally, the frequent occurrence of sub-freezing temperatures results in the destruction of metal water pipes and water meters, leading to significant loss of potable water (Oroud 1993). Each year thousands of water meters are damaged in Jordan during the cold season. As a result, the Ministry of Water and Irrigation (MWI) has issued new codes under which damaged water meters are replaced at owners’ expense. The most significant economic impact of sub-freezing temperatures, however, is on the agricultural sector, and this impact has become progressively more costly with the expansion of irrigated agriculture in the Badia (desert region) and the spread of frostsensitive tropical plants in the Jordan Valley (J.V.). Irrigated agriculture in the Badia increased from virtually nil in the early 1970s to more than 16 000 hectares (ha) in 2003 (MWI 2005). A large portion of this area is planted with frost-sensitive vegetables (e.g., tomatoes, zucchini, peppers), which are usually harvested during the last quarter of the year (September through December). Although the J.V. enjoys a tropical-like climate, a large portion of it is prone to subfreezing temperatures. Following the 1990 Kuwait crises, which resulted, among many other things, in a complete halt of exports of Jordanian agricultural products (mainly vegetables) to the Arabian Gulf countries, many farmers started to grow banana and citrus orchards instead of vegetables because of the stable prices these crops command. Aside from their heavy toll on water resources (Oroud 2006), bananas and citrus are also vulnerable to sub-freezing temperatures. The area planted with these crops grew from ~7 500 ha in 1990 to ~13 000 ha in 2003
and is still increasing. This trend reflects the impact of regional politics on decisions made at the farm level. Thus, the substantial increase in irrigated agriculture, along with the changing agricultural patterns in the J.V., exacerbates the economic losses resulting from freezing episodes. Sub-freezing temperatures could leave the entire Badia barren within one or two nights and can also inflict significant losses on the agricultural sector in the J.V., leading to a substantial rise in the prices of vegetables, which may triple or quadruple within one week following a spell of sub-freezing temperatures. During the second half of December 2004, for instance, a spell of subzero temperatures prevailed over most areas of Jordan and caused substantial economic losses to the agricultural sector in the Badia (damage > 90%) and to most of the J.V. More than 1 600 farmers and around 4 000 ha planted with vegetables (mainly in the Badia) and fruit trees in the J.V. were seriously damaged by this cold-air intrusion. Following that cold spell, the prices of tomatoes, for instance, jumped from ~0.2 J.D. ($0.30) to ~0.7–1.0 J.D. (~$1.00–1.50) per kilogram within less than a week. The same scenario was repeated in December 2006, inflicting great losses on farmers in the J.V. More than 1 500 ha planted with vegetables and bananas were completely destroyed. Despite the seriousness of the frost problem in Jordan, there is very little research dealing specifically with this hazard (Maayah 2003; Sariereh 2006), and the existing treatments are relatively simple and provide little insight. Thus, the objective of the present investigation was to examine the stochastic nature of spatial and temporal patterns of subfreezing temperatures in Jordan. The investigation provides a quantitative risk-assessment measure to the most likely dates when subfreezing temperatures begin and end in various parts of the country, thus providing the geographic distribution of probability of frost risk to the agricultural sector.As a result, frostprone areas can be delineated, along with risk
The Arab World Geographer/Le Géographe du monde arabe 10, no 2 (2007)
Spatial and Temporal Distribution of Frost in Jordan
83
Study Area and Data Quality
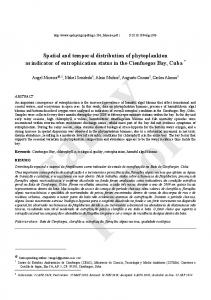
Figure 1: Geographical distribution of stations used in this study. Numbers in parentheses indicate station elevation.
levels. The study also provides insight into the likely physical mechanisms controlling frost and its types and severity in the various parts of the country.
Although Jordan is a relatively small country, it encompasses three distinct climatic zones: a tropical, dry climate within the Jordan Valley (BWh), a Mediterranean climate (Csa + Csb), and a desert climate (mostly BWk). Seven stations located in these three geographic zones were chosen for this study (see Figure 1); all these stations provide first-class meteorological data. The data set for Amman Airport covers 68 years; a period of 24 years (1981–2004) was used in the analysis for the other stations. Daily grass minimum temperatures measured at about 0.05 m above the surface in the open were used to carry out the analysis. The resolution of the instruments used is ~ ± 0.5°C, with an absolute deviation of about 1°C. The relative error is less than this, however. Data were obtained for the cold part of the year, October through May,1 when surface frost occurs. Table 1 displays the geographical attributes of the stations used in the analysis.
TABLE 1 Some geographic parameters of the stations used in the analysis Station
Latitude Longitude
Irbid Amman Rabbah Shoubak Mafraq Jafer Baqura
32° 33’ N 31° 59’ N 31° 16’ N 30° 31’ N 32° 22’ N 30° 17’ N 32° 38’ N
35° 51’ E 35° 59’ E 35° 45’ E 35° 32’ E 36° 15’ E 36° 09’ E 35° 37’ E
Elevation (m)
Annual precipitation (mm/year)
616 780 920 1365 686 865 -170
472 269 337 312 161 33 396
Annual average Ta (°C)
Days with) Ta≤0
Days with Tg≤0
Index of dryness*
17.8 17.4 16.2 12.6 16.6 18.0 22.2
4.5 6.3 7.4 77.9 19.1 32.8 0.2
21.5 48.5 52.1 120.7 67.5 47.2 5.7
2.5 4.7 3.9 3.9 8.2 38 4.0
Ta = air minimum temperature Tg = grass minimum temperature * The dryness index (dimensionless) is calculated using the formulation presented by Budyko (1974): = Rn/(LE.P), where Rn, LE, and P are yearly net radiation, latent heat of vaporization, and precipitation. The Arab World Geographer/Le Géographe du monde arabe 10, no 2 (2007)
84
Ibrahim M. Oroud
3. Theoretical Considerations Types of Frost Both radiative and advective frosts occur in Jordan. Advective frost occurs when continental polar air advances toward the eastern Mediterranean; this type of frost is usually associated with clear skies and easterly or north-easterly winds. The consequence of an advective frost is usually a widespread hard freeze. Air and ground temperatures can dip much below zero without the deposition of ice on the ground surface or other exposed objects, because atmospheric vapour pressure is extremely low (ea < 0.3 hPa) and, as a result, the frost-point temperature is well below the freezing point (Tf < -10°C). Such frost is very damaging to plants and other exposed objects, such as metal water pipes and water meters, for two reasons: first, the windy conditions associated with sub-freezing temperatures lead to rapid cooling, because heat loss from objects is substantial (see, e.g., Oroud 1993); second, the lack of frost deposition on plants deprives them of latent heat release and also of the insulating effects of ice. When water changes from the gaseous phase to the solid phase, a large amount of heat is liberated (~2.85 × 10⁶ J kg1). Additionally, when ice is deposited on plants, it forms a thin layer that insulates them from the cold ambient environment. Advective frost is generally known as “black frost.” Radiative frost occurs primarily under clear, calm conditions; the thermophysical properties of surfaces and topography play an important role. Deposition of ice crystals on the ground surface and other exposed objects usually occurs under these conditions. Ice deposition is very prominent over isolated surfaces or those with small heat capacities (e.g., grass, car roofs, car windshields, dry straw). Generally, paved roads show less ice accumulation because of vigorous upward heat flow from the subsurface layer during the nocturnal period. In
very cold conditions and following rainy or snowy conditions, however, a thick layer of ice forms on paved surfaces, which makes them a potent traffic hazard in the earlymorning hours (until one or two hours after sunrise). The relative importance of advective and radiative frost in Jordan depends primarily on geographic location, which influences cloud cover, wind speed, and the thermophysical properties of the soil. Radiative frost represents approximately 80% of total frost events in the desert areas of Jordan, whereas it is less common in the mountains, ranging from ~30% in the northern mountains to ~60% in the southern mountains. Deserts experience frequent radiative frost during the cold part of the year, for several reasons: first, the combined effects of low cloud cover and little atmospheric moisture in the lower troposphere reduce atmospheric emissivity (e.g., Oroud and Nassrallah 1998); second, low or calm wind speeds enhance strong differential cooling near the surface; and, third, the small heat capacity of desert soils, which is due to their composition and lack of soil moisture, causes the ground surface to cool rapidly at night. Air Minimum Temperature (Ta) versus Grass Minimum Temperature (Tg) Meteorological stations report minimum grass and air temperatures. The minimum air temperature, a widely reported element in weather forecasts, is the coldest air temperature observed within a shielded screen at about 2 m above the surface. The grass minimum temperature, which is the lowest nighttime temperature recorded for an exposed thermometer situated about 5 cm above the surface, resembles the ground temperature very closely. This element is the most significant in the evaluation of frost hazard, because temperatures of surface features (e.g., plant canopies, roads, grass, pavements, car bodies) resemble closely the grass minimum.
The Arab World Geographer/Le Géographe du monde arabe 10, no 2 (2007)
Spatial and Temporal Distribution of Frost in Jordan
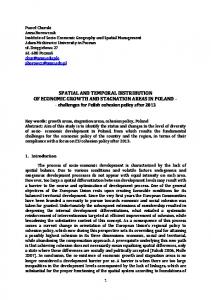
Figure 2 Nocturnal cooling at ~0.05 m and ~2 m during a clear, calm winter night in central Jordan
Minimum air and grass temperatures differ substantially from each other, particularly during relatively clear, calm nights, when air and surface temperatures start to diverge around or shortly before sunset, indicating that a temperature inversion near the ground surface has begun. Figure 2, observed by the author during a relatively clear, calm winter night in central Jordan, shows the progression of nocturnal cooling at ~0.05 m and ~2 m respectively. Because of substantial variations in their radiative properties, the ground surface and all other surfaces (e.g., grass, tops of trees, car shields, roof surfaces) cool more rapidly than the contiguous atmosphere during the nighttime hours (Garrat and Broost 1981; Trought et al. 1999). These surfaces act as a boundary separating two different media with distinct thermophysical properties. The rate of nocturnal cooling at and very close to the ground surface reaches ~1.5–2°C/hour after sunset and levels off after several hours to ~0.5°C/hour (see Figure 2). Radiative cooling of the adjacent atmosphere is ~0.1– 0.2°C/hour (∂T/∂z becomes progressively smaller as one moves away from the interface; see, e.g., Stull 1988). Cooling usually propagates upward via intermittent turbulence. This process explains why atmospheric layers close to the ground surface cool more than the layers above. The intensity and depth of this inversion
85
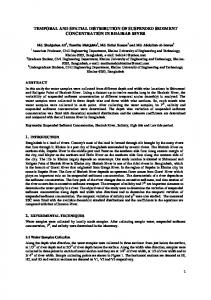
layer increase as night passes and reach maximum around sunrise (e.g., Stull 1988, 499–543). The establishment and strengthening of this inversion layer enhance vertical differential cooling, because atmospheric turbulence and, as such, downward transport of momentum and heat are strongly suppressed. Under strong inversions, a decoupling may occur between the surface and the atmosphere aloft (Matthias 1990; Oroud 1998, 2001), and, therefore, the surface may become virtually detached from processes occurring aloft. The temperature difference between the ground surface and the screen level (~2 m above the surface) ranges from ~1–2°C in windy/cloudy (or both) conditions to ~6– 10°C during calm, clear nights. Figure 3 shows the linkage between grass minimum temperature (~0.05 m) and air temperature at the screen level in two locations: Irbid (1 October–30 April) and Baqura in the J.V. (January–February). The regression equations for the grass minimum temperature in Irbid and Baqura are respectively as follows: Tg = -3.54 + 0.94Ta (1) Tg = -4.36 + 0.96Ta (2) Equations (1) and (2) show that Tg, on average, is lower than Ta by about 3–5°C in both locations. The slopes are also similar and are very close to unity. One may infer from the above two relations the wind-speed patterns and cloud cover. A smaller intercept (close to zero) indicates a higher wind speed and probably more cloud cover at night. Climatological data reported by Jordan’s Department of Meteorology, show that the duration of calm conditions prevail in Irbid and Baqura, on average, ~36% and 54%, respectively. Thus, these statistical signatures could provide insight into the likely physical mechanisms controlling the general climates in different locations. The grass and air minimum temperatures depart from each
The Arab World Geographer/Le Géographe du monde arabe 10, no 2 (2007)
86
Ibrahim M. Oroud
Figure 3 Relationship between air minimum temperature (Ta) and grass minimum temperature in two stations, Irbid (3.a) and Baqura (3.b) in the Jordan Valley.
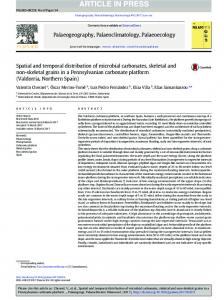
Figure 4 The earliest and latest recorded dates of air and ground frost in Amman: (a) early frost; (b) late frost.
other temporally also, as the physical mechanisms controlling their behaviour are not very similar. Table 2 shows the early and late dates of frost for several locations in Jordan; Figure 4 shows the dates for early and late frost in Amman for a period of 17 years. The difference between air and ground surface in terms of the onset of early frost is 16 days. The difference for late frost is quite substantial (~38 days). For instance, the average last day for air frost and surface frost in Amman during this limited period is 1 March and 8 April respectively. Although minimum air temperature is widely reported in weather forecasts and in climatological summaries, Tg is the proper parameter to use in studying the timing, frequency, and severity of agricultural frost. Method of Investigation Statistical analysis is used to examine whether data on early and late frost follow the normal distribution. Skewness, kurtosis,
and the chi-square (χ2) goodness of fit test are used to test the data. The skewness statistic measures the degree of asymmetry in a distribution about the mean. The distribution may be normally distributed or positively or negatively skewed (most data are gathered at one end of the curve). The coefficient of skewness (γ) may be written in the following form (Snedecor and Cochran 1980): (3) where x and x- are observations and average, respectively, and n and s are sample size and sample standard deviation. If the sample comes from a normal distribution, then γ is approximately normally distributed, with mean 0 and standard deviation of √6/n. The kurtosis test measures the peakedness (pointed or flat) of frequency curves. For a normal distribution, the kurtosis ratio (g) has a value of ~3 and a standard error of kurtosis of √24/n. If the ratio exceeds 3, the
The Arab World Geographer/Le Géographe du monde arabe 10, no 2 (2007)
Spatial and Temporal Distribution of Frost in Jordan
87
TABLE 2 Absolute dates of early and late frost at selected stations in Jordan Station Rabbah Wadi Wala Naour Shoubak Azraq Mafraq Zerka refinery Amman airport
Early frost Ta (2 m)
Tg (0.05 m)
Late frost Ta (2 m)
Tg (0.05 m)
23/11 27/11 7/12 7/10 26/11 6/11 6/11 22/11
11/11 6/11 5/11 30/8 6/11 5/11 5/11 9/11
30/3 2/3 6/3 18/5 4/3 5/4 23/3 1/4
23/4 26/3 4/5 22/6 24/3 10/5 6/4 9/5
distribution is flatter than the normal distribution (i.e., has longer tails); when it is smaller than 3, the distribution is narrower than the normal distribution, or flat-topped (Snedecor and Cochran 1980). The χ2 goodness of fit is used to test whether the frequency distribution of samples fits a given distribution (in this case, the normal distribution). The χ2 can be calculated as follows: (4)
=
Where O and E are observed and theoretically expected frequencies, respectively; the summation is for the entire class of numbers. For a sample of n classes, the degrees of freedom (υ) are (k - 1 - number of fitted parameters). Because fitted parameters are s and x-, (υ) would be (k - 3). The expected frequency for a given class is computed as follows: Ei = N (f(yu) - f(yl))
(5)
Where f( ) is the cumulative normal distribution function, yu and yl are the upper and lower limits of the class, and N is the sample size. The class width may be approximated by 2N0.4 or 0.3s, where s is the standard deviation. The hypothesis that the distribution follows a specific distribution (in this case, the normal distribution) is rejected if χ2 > χ 2 (α, k - c), where χ2 (α, k - c) is the percent point function with k - c degrees of freedom
and a significance level of α (e.g., 0.05 or 0.01). The individual z-score for each interval is calculated as follows: (6) Where z(i) is the probability of a given class, and s is the standard deviation for the population. The probability of frost at Baqura station, located in the northern J.V., is dealt with using the Poisson distribution, since no frost was recorded in certain years: (7) Where p(f) is frost probability, λ and x are the average and number of events, respectively. Results Table 3 displays the statistical results for the various stations. With the exception of a mountainous station located in southern Jordan, all skewness values are less than , or within 1 standard error of skewness (SES). The value for Shoubak is slightly larger than 1 SES but is still less than 2 SES. This station is located in a high, dry mountainous area, where frost can occur as early as the end of August. Such extreme values (outliers) will affect both skewness and kurtosis (Decarlo 1997). Table 4 shows the χ2 goodness of fit for the various stations; χ2 values are signifi-
The Arab World Geographer/Le Géographe du monde arabe 10, no 2 (2007)
88
Ibrahim M. Oroud
TABLE 3 Absolute dates of early and late frost at selected stations in Jordan Station
Period of investigation
Early frost s
Jafer Mafraq Irbid Amman Airport Rabbah Shoubak
1981–2004 1981–2004 1981–2004 1923–1973, 1981–2004 1981–2004 1981–2004
Late frost g
s
g
12.49 12.34 15.17
0.125 0.22 0.27
2.43 2.43 2.40
14.64 13.095 15.52
-0.066 -0.38 0.098
2.21 2.48 2.99
15.147 12.24 16.86
0.0589 ≈0 -0.546
2.24 3.21 2.54
13.53 7.2 16.61
-0.153 0.099 0.29
2.46 3.97 2.78
TABLE 4 The 2 goodness of fit for early and late frost at all seven stations Station Amman Airport Irbid Rabbah Shoubak Mafraq Jafer
2
(early frost) 11.28 2.1 4.12 4.35 3.5 0.5
Critical value = (n, 0.05) =(6, 0.05) = 12.59 = (4, 0.05)=9.49 = (4, 0.05)=9.49 = (4, 0.05)=9.49 = (2, 0.05)=5.99 = (5, 0.05)=11.07
cant at a = 0.95. Figures 5 and 6 show the predicted and observed frequency distributions of early and late frost in Amman and Rabbah as examples of the χ2 goodness of fit. The statistical measures used here show that the dates of early and late frost follow the normal distribution, and, as such, this distribution can be used to infer the various statistical properties of surface frost.
Figure 5 Observed versus theoretically derived frequency distribution in Amman, 1923 through 2004
2
(late frost) 8.5 2.2 1.1 5.05 1.4 3.9
Critical value = (n, 0.05) = (4, 0.05) = 9.49) = (4, 0.05) = 9.49 = (4, 0.05) = 9.49 = (4, 0.05) = 9.49 = (4, 0.05) = 9.49 = (4, 0.05) = 9.49
Discussion and Conclusion The average date of early frost ranges from mid-October, as in the southern mountains (Shoubak), to the beginning of December, as in Irbid and at Amman Airport (see Table 5). Tables 6 and 7 display the probability of early and late frost in the various parts of the country. These dates reflect the combined effects of surface parameters and atmospheric dynamics. Late frost ends as early as 23 March (in the plains of northern Jordan) and as late as mid-May (in the southern mountains). Early frost is more serious in the desert region, where large-scale areas planted with vegetables are in the producing stage. Frost in November has proved to be a serious hazard to the agricultural sector there. The probability of early frost in the north-eastern desert before 15 November exceeds 50%. Corresponding figures for other regions (except the
The Arab World Geographer/Le Géographe du monde arabe 10, no 2 (2007)
Frequency Day
Spatial and Temporal Distribution of Frost in Jordan