for the 1992 Landers, California, Earthquake ..... the epicenter along the Eureka Peak fault (Hart et al., .... verting for slip on the Big Bear and Eureka Peak fault:.
Bulletin of the Seismological Society of America, Vol. 84, No. 3, pp. 668-691, June 1994
Spatial and Temporal Distribution of Slip for the 1992 Landers, California, Earthquake by David J. W a l d and Thomas H. Heaton
Abstract We have determined a source rupture model for the 1992 Landers earthquake (Mw 7.2) compatible with multiple data sets, spanning a frequency range from zero to 0.5 Hz. Geodetic survey displacements, near-field and regional strong motions, broadband teleseismic waveforms, and surface offset measurements have been used explicitly to constrain both the spatial and temporal slip variations along the model fault surface. Our fault parameterization involves a variable-slip, multiple-segment, finite-fault model which treats the diverse data sets in a self-consistent manner, allowing them to be inverted both independently and in unison. The high-quality data available for the Landers earthquake provide an unprecedented opportunity for direct comparison of rupture models determined from independent data sets that sample both a wide frequency range and a diverse spatial station orientation with respect to the earthquake slip and radiation pattern. In all models, consistent features include the following: (1) similar overall dislocation patterns and amplitudes with seismic moments of 7 to 8 x 1026 dyne-cm (seismic potency of 2.3 to 2.7 km3); (2) very heterogeneous, unilateral strike slip distributed over a fault length of 65 km and over a width of at least 15 kin, though slip is limited to shallower regions in some areas; (3) a total rupture duration of 24 sec and an average rupture velocity of 2.7 km/sec; and (4) substantial variations of slip with depth relative to measured surface offsets. The extended rupture length and duration of the Landers earthquake also allowed imaging of the propagating rupture front with better resolution than for those of prior shorter-duration, strike-slip events. Our imaging allows visualization of the rupture evolution, including local differences in slip durations and variations in rupture velocity. Rupture velocity decreases markedly at shallow depths, as well as near regions of slip transfer from one fault segment to the next, as rupture propagates northwestward along the multiply segmented fault length. The rupture front slows as it reaches the northern limit of the Johnson Valley/Landers faults where slip is transferred to the southern Homestead Valley fault; an abrupt acceleration is apparent following the transfer. This process is repeated, and is more pronounced, as slip is again passed from the northern Homestead Valley fault to the Emerson fault. Although the largest surface offsets were observed at the northern end of the rupture, our modeling indicates that substantial rupture was also relatively shallow (less than 10 kin) in this region.
In~oducfion distributions and rupture time histories has been well established over the last decade. Constraints on slip duration and heterogeneity, rupture velocity, and faulting complexity have provided insights into the earthquake rupture process and allowed higher-quality forward predictions of ground motions (for a summary, see Wald, 1992).
The 28 June 1992 Landers earthquake is the largest well-recorded earthquake in the United States to date. The large rupture length (70 km) and long duration (24 sec), in addition to the high quality and variety of data, provide an unprecedented opportunity to model the rupture history of this event with a variable-slip, finite-fault rupture model. The value of determining earthquake slip 668
Spatial and Temporal Distribution of Slip for the 1992 Landers, California, Earthquake
Unfortunately, it has always been difficult to evaluate the resolution and accuracy of these slip models and to compare results of different studies. This problem occurs in part because different studies rely on different data sets or subsets, and is further complicated by the various parameterizations and procedures used in determining faulting history. These two variables can be directly responsible for major differences in resulting fault models. To alleviate this particular problem, we have performed independent inversions of three important data sets for constraining the rupture process of the Landers earthquake using a single-fault model parameterization. We also explicitly include constraints from another important data set--observations of fault surface offset. In this way, we gain more confidence in our solution as we match more and more independent observations. There are several important advantages in combining the multiple data sets. First, neither the geodetic nor the strong-motion stations uniformly cover the near-field region (i.e., one fault length). As a combined data set, the spatial sampling is enhanced. Further, the addition of the vertically propagating teleseismic body waves allows sampling of the focal sphere with up- and downgoing ray parameters that are not sampled well by the near-field waveforms, thereby enhancing vertical resolution of our models. Second, the range of frequencies covered is from DC to 0.5 Hz, allowing comparison of slip models which sample only co-seismic slip (teleseismic and strong motions) and co-seismic slip plus immediate afterslip (geodesy), if any occurred. As will be shown, the consistency of slip distributions derived from these two data bandwidths requires short-duration slip histories, and suggests little, if any, immediate afterslip. Finally, the complexity of the Landers fault model parameterization precludes testing the entire temporal faulting parameter space (e.g., fully allowing variable rise times, rupture velocities, rupture delays, and the possibility of rerupturing, etc.). Consequently, a priori assumptions on the timing of the rupture must be made. Since the geodetically determined slip pattern is completely independent of the rupture timing, insisting that the final static slip in the waveform inversions also fit the geodetic data provides an independent check on any timing assumptions. This is a great advantage over bandlimited waveform studies alone, where there can be tradeoff between the rupture timing and the slip location. Of course, the geodetic data alone provide no information on the rupture evolution or temporal slip variations, so the waveform data, while more difficult to model, ultimately provide more information about the rupture dynanlics. Since the Landers earthquake occurred on a series of stepping fault segments, a further goal of this study is to image the history of rupture propagation from segment to segment. Dynamics of strike-slip step-overs have
669
recently been addressed theoretically (Harris and Day, 1993), and we now have the opportunity to constrain the dynamic slips and stresses controlling the segmentation observationally (or, at least, one step removed). We further hope that being able to visualize this rupture process will bring particular aspects of the earthquake rupture process to light. Critical to our investigation is our use of a uniform parameterization for many data sets. By representing slip on the fault with numerous subfaults, and slip on each subfault by the summation of many point sources over the subfault area, we can generate near-field static, strongmotion, or teleseismic synthetic Green's functions with identical fault models. Complete waveform strong-motion responses are calculated with frequency-wavenumber integration techniques, and teleseismic P and SH waveforms are simulated using the generalized ray methodology. The static displacements for each subfault are computed from the analytic expressions for slip in an elastic half-space. We then use a constrained, damped, linear least-squares inversion to determine the slip on each subfault. We also allow slip to occur in multiple time windows to accommodate complexity of the slip function on each subfault and to model variations in rupture times (effectively allowing the rise time and rupture velocity to vary spatially).
Fault Rupture Model Fault Parameterization We model the Landers earthquake with a fault model consisting of three linear, vertical fault segments as shown in map view in Figure 1 (hatchured lines) and displayed in cross section in Figure 2. As indicated in these figures, the three segments represent, from south to northwest, the Johnson Valley and Landers faults (strike 355°), the Homestead Valley Fault (strike 334°), and the Emerson and Camp Rock faults (strike 320°). This segmentation was chosen based on the locations of the surface rupture expression (Sieh et al., 1993) and the aftershock seismicity (Hauksson et al., 1994), both of which are depicted in Figure 1. The three segments generously contain and closely approximate the correct strike of the fault segments which ruptured. Noting that significant seismicity, though little surface slip, occurred south of the epicenter (star), we allowed for the possibility of extended rupture into this region as well. The choice of three segments represents a trade-off between accommodating the obviously complex faulting geometry observed at the surface, and the desire to keep the problem tractable. For example, the straight segment approximation to the complex surface trace and aftershock pattern near strong-motion station LUC (Fig. 1) fits the overall fault trend, but may be inadequate to
670
D.J. Wald and T. H. Heaton
properly model the higher-frequency aspects of the waveforms recorded there. Fortunately, the complexity of the faulting at depth appears to be less intricate than the surficial offset would lead us to believe (see numerous cross sections in Hauksson et al., 1994).
,
•
O
\
We discretize the three fault planes into a total of 186 subfaults (Fig. 2) in order to represent variable slip along the fault. The fault parameterization and modeling procedure we employ is after that described by Hartzell and Heaton (1983).
o
•\
\ I
\
Hypocenter
\ &
\ k
O¸
'r~
~.
0
-
0
•
USGS
•
CDbIG
•
S.C.E.
o
MAG
> 3.0
o
MAG
> 4.0
o
MAG > 5.0
0
MAG
\
"
.
~-.
i.
oO o
°,...~ \~ .''.
LUC
34.5
)
\
o
Hornest~ead\~ValleyJ z ' i
[\\
\
\
,
\
x )o
°~-~
oo
"~... \.:\
o ~; o
~\
~
Landers'F.
\
o
\
?o
,
> 6.0
' \ \
o
\
\
\
\
~ Johnso~n • Valleyl ~ \ F.
'0\
\
\
,~oxo ~t'
mG
~o_o
\ \
•
.
,-o o
"+ .
,
I I
I0
-I0
I
II 30
. . . . . . . . . . . . . . . . .
I
,
I
--I 40
~ t l I
,
, 22.0-23.0
-i0 ' s
I I I I
20
10
I
I
0
-10
'
I
) , "II
I
I
I
I II
II
60
50
40
30
20
I
I' ' I I
10
1
0
D i s t a n c e along Strike ( k m )
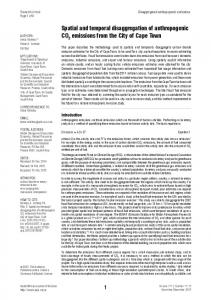
Figure 16. Time progression of the Landers rupture for the combined data model given at intervals of 1 sec as labeled. The contour interval is 0.5 m. For reference, a rupture velocity roset is given with arrows. Lines indicate selected regions of fairly constant rupture velocity. From top to bottom, these lines represent 3.6, 1.0, 1.4, 4.0, and 2.1 km/sec, respectively, as labeled.
-10
688
D.J. Wald and T. H. Heaton
San Francisco earthquake had an Ms of 8.3, yet an Mw of 7.8 (Wald et al., 1993). Similarly, Mw is 6.4 for the Imperial Valley event (Hartzell and Heaton, 1983), while Ms is 6.9. This trend holds true for most other moderate to large California earthquakes (with the exception of the 1980 Ms 8.0 Eureka and the 1971 Ms 6.5 San Fernando events) and thus may be independent of focal mechanism. Since for events in this magnitude range Ms is approximately the same as Mw, the above disparity between Ms and Mw suggests that the Ms values for these events are overestimated. This bias can be partially explained by higher than average amplitudes along the travel path from California to Europe, where a disproportionately large number of stations are usually used for the Ms determinations. Shallow versus Deep Slip Fault slip from the Landers earthquake had several significant characteristics. It had greater dislocations than many previous well-studied events, and the majority of the shallow rupture was within competent bedrock, rather than within sedimentary basins and valleys. It is often assumed that the surface offset from large earthquakes is simply related to the amount of faulting at depth. Our experience with moderate-sized events, however, should make this assumption questionable. Consider the many events in the magnitude 6 to 7 range for which adequate images exist for slip at depth that had little or no surface offset (e.g., 1992 Joshua Tree, 1989 Loma Prieta, 1984 Morgan Hill). Further, for the Landers earthquake, slip observed along the Camp Rock fault at the northern end of the rupture seems to be limited to the shallow portion of the fault. This feature is not only indicated by the geodetic and waveform modeling, but can also be inferred from the northwestern limit of aftershock activity (Fig. 1). That is, there were few aftershocks in the northernmost region in which large surface offsets were observed. Although agreement between the amount of surface slip and dislocation at depth is apparent in a general sense for the Landers rupture, the peak surface slip is further north (Fig. 14, 45 km) than that at depth (Fig. 14, 33 km). A similar situation is seen for the central Homestead Valley fault section (Fig. 14, 20 to 25 km) where slip is also confined to the shallow portion of the fault. In contrast, slip is primarily deep in the region near the hypocenter. The occurrence of a mismatch between surficial and deeper slip may be partially explained in terms of prior slip history (Wald, 1992). Since many magnitude 6 to 7 events have little or no slip at the surface, either shallow slip must "catch up" by creep, or be made up during larger, through-going events. In the latter case, we would expect more shallow slip than deep slip over substantial lengths of the fault. Such observations recommend caution when relying on paleoseismic surface offset mea-
surements to infer earthquake size, since they usually sample only a few points along a given rupture and may not be representative of slip that occurred at depth. Figure 17 summarizes the effect of constraining slip in the top subfaults to be the surface offset. There are two regions which show a discrepancy between the shallow slip estimated with and without these slip constraints. The modeled slips (both unconstrained and constrained) along the Homestead Valley fault show a peak slip (at 16 kin) that is greater than the observed slip. In contrast, slip in the unconstrained model is less than was observed for most of the central Camp Rock/Emerson segment. These features suggest several possibilities, First, we expect the largest variations in material properties near the free surface. Green's functions for our shallowest subfaults are likely to be less accurate than for deeper subfaults. Thus, our ability to resolve very shallow slip may be poor unless we use surface offset data. Second, our assumption that surficial slip is representative of the slip within the upper 2.5 km may be inappropriate. In fact, close examination of the surface offset data (Sieh et al., 1993) shows that the slip can change by more than a meter per kilometer along any fault trace. Such variations may not be representative of slip at depth. Although the unconstrained model favors shallow slip that deviates in places from that observed, we can still fit the surface offset observations without substantially diminishing the fit to the other data. Furthermore, in-
NW
SE
Homestead Valley Fault
I
I
1
Camp Rock/Emerson Faults
I
I Landers/Johuson Valley FaultsI
GEODETIC
~,.~
~,.sr ,
~
~7.5 5f -~ 2.5
o ~ ~ ~ _ . .
,'i " ~
--"
. --"
O0
."
6
lZ
18
--
Unconstrained Constrained
24
COMBINED
.9 2.5
O0
6
12
18
24
~7.5[-
30
36
-0
8
12
18
24
.,,
~ 2.5 0 ~ °." " ~ 0 8 12 18 24 Distance Along Strike
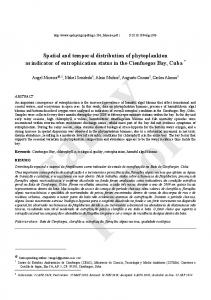
Figure 17. Comparison of shallow subfault slip values determined from the constrained (solid lines) and unconstrained (dashed lines) rupture models for both the geodetic and combined inversions. The fault segments are indicated at the top. Shaded areas represent observed surface slip as averaged over the subfault lengths.
30
Spatial and Temporal Distribution of Slip for the 1992 Landers, California, Earthquake eluding the shallow-slip constraint does not significantly degrade the fit to the geodetic displacement vectors. Since we can adequately fit the surface-slip data as well as all the other observations, our preferred model includes the surface-slip constraint. We attempted to correlate the spatial distribution of aftershock hypocenters from the Southern California Seismic Network (SCSN) catalog with our slip model. Inverse correlations between the spatial density of hypocenters and slip (such as summarized by Mendoza and Hartzell, 1988) are not clearly evident. However, there are serious questions about the accuracy of the hypocentral depths listed in the SCSN catalog for Landers aftershocks (Ma, 1993; Zhao and Kanamori, 1993). Thus, we feel it is inappropriate to show a correlation until future analysis can provide better depth control for the aftershocks. Forward Prediction of Ground Motions It was fortunate for souihem Californians that the Landers earthquake struck such a sparsely populated region. Considering the size of this earthquake, it caused relatively little damage. Unfortunately, the near-source region was not only sparsely populated with people, but was also sparsely populated with strong-motion instruments. What were the ground motions like in the nearsource region? Although there was one station that recorded the near-source ground motions, it seems unlikely that the LUC record captured the largest ground motion, or that the LUC record is representative of all near-source sites. One way to estimate near-source ground motions is to use our preferred slip model to synthesize near-source ground motions at sites for which there are no recordings. Because we only inverted for ground motions that were low-pass filtered at 2 sec, we can only predict ground motions in this frequency range. Synthetic ground velocities and displacements were computed on a 4-km grid of stations within an 84-km by 56-kin rectangular region (circles in Fig. 18) using the strong-motion dislocation model for the source (Fig. 12). Ground motions were computed at 330 locations in addition to the 16 original station locations (Table 2). The peak value of ground velocity was determined at each grid station, and then these values were contoured over the region. The contours of peak velocity are displayed in Figure 18 with a contour interval of 10 cm/sec. The peak velocity amplitudes are only valid within the bandwidth of the inversion modeling (2 to 14 sec), and although the results shown are for unfiltered synthetic waveforms, the F-K Green's functions were computed only up to 1 Hz. For this reason, the predicted velocities represent a minimum estimate. For example, the observed peak velocities, when bandpassed similarly, were reduced in amplitude by over 30%. The westward concavity of fault rupture results in a slight focusing toward the west and defocusing toward
689
the east as seen by the extension of the contours southwestward (Fig. 18). This is consistent with the observations; for example, there are comparable displacement amplitudes at Amboy (AMB) and Pasadena (PAS), although PAS is about 160 km from the central portion of the fault, and AMB is only 70 km away. While this exercise was aimed at near field predictions, it is straightforward to predict far-field time histories at particular locations in order to investigate triggered seismicity and similar phenomena elsewhere. As a further exercise, to test the long-period aspects of our dislocation model, we predicted the TERRAscope displacement waveforms out to 100-see periods. Recall, the long-period cutoff used in our inversions was 13 sec, and this limitation was introduced by the long-period noise from integrating the digitized SMA1 film recordings. The TERRAscope strong motions, however, have much better fidelity, and waveform predictions from our combined inversion model produced waveform fits at the longer periods comparable to the match to the more bandlimited data shown in Figure 11. This supports the validity of our source model over a broad range of frequencies.
35
\..PPeakGround
\
Velocity
\
84.6
\, \
34 '.\
I
....
/
kl
":. . . . . . . . . . . . . . . . .
-117
~.~-
-..
\EWC •
I .......
.
;x
..........
-118.5 Longitude
Figure 18. Map illustrating the grid of stations and the contoured distribution of peak ground velocities from the strong-motion forward prediction.
"i16
690
D.J. Wald and T. H. Heaton Conclusions
Geodetic survey displacements, near-field and regional strong motions, broadband teleseismic waveforms, and surface offset measurements have been used, both independently and collectively, to determine a robust source rupture model for the 1992 Landers earthquake. Details of both the spatial and temporal slip variations determined from our inversions models are summarized below. The strong ground motions required slip patterns and total dislocations comparable to longer-period teleseismic models and geodetic models (all the models have seismic moments in the range of about 7 to 8 × 1027 dyne-cm, and seismic potencies are 2.3 to 2.7 km3). The consistency in the slip models suggests that the total duration of slip was short. Furthermore, afterslip during the first month was limited to at most a few percent of the co-seismic slip. Slip was extremely heterogeneous, both along strike and downdip, with peak slips near 7 m and variations of several meters over a distance of just a few kilometers. This spatial heterogeneity in the slip is inferred not only from the inverse modeling, but it is also observed in the surface offset data (Sieh et al., 1993). Variations of slip with depth relative to measured surface offsets were also clear; although the largest surface offsets were observed at the northern end of the rupture, substantial rupture was relatively shallow in that area compared to other regions of the fault where large slips persisted to a depth of at least 15 km. These large slip variations seem to indicate that both strain increases and decreases were as large as 10 -3 on the rupture surface. In some instances, fault rupture apparently results in a negative stress change. That is, regions with small slips (e.g., Fig. 13, 20 to 25 km along strike and 6 to 11 km deep) are often juxtaposed against regions of much higher slip. We speculate that this unusual behavior may be caused by dynamic instabilities in the rupture process (Heaton, 1990). Alternatively, the slip heterogeneity can be attributed to earlier rupture sequences on these faults. For example, the slip of gap mentioned above may have been the location of an asperity during a prior magnitude 6 earthquake. Similarly, the lack of slip at depth on the northernmost portion Camp Rock fault, which showed much shallow slip, may be complementing prior slip from an event which never broke the surface (similar to the Joshua Tree earthquake). We suspect, though, that both prior rupture history and instabilities in the dynamic rupture process act in unison to control the overall rupture dimensions and slip variations. As with other earthquakes modeled with sufficiently high-frequency data sets, the 1992 Landers earthquake requires short slip durations relative to the rupture duration, implying that only a portion of the fault is slipping at a particular time (as was emphasized by Heaton,
1990). Perhaps no better example of a propagating "slip pulse" has yet been imaged than that found in Figure 16. In general though, the capacity to resolve rupture propagation for the Landers earthquake can be attributed primarily to the large dimension and duration of the rupture and data diversity rather than superior strong-motion data coverage and quality. In fact, relative to many other strong-motion, finite-fault inversions for rupture characteristics, the near-field strong-motion station coverage for the Landers earthquake is rather sparse. From our slip imaging, we can visually follow the progression of the rupture front. Over the 24-sec rupture duration of the earthquake, the average rupture velocity was 2.7 km/sec. In a general sense then, faulting proceeded from segment to segment as a single continuous rupture. In detail though, significant rupture velocity variations were apparent. Most notably, the rupture front slowed within regions of slip transfer from one fault segment to the next and near the termination of rupture at the northern Camp Rock fault. In conclusion, we presented a finite-fault slip model that seems to explain most of the features of the surface offset data, the geodetic data, the strong-motion data (longer than 2-sec period), and the broadband teleseismic data. The most striking characteristics of the model are that the slip varies strongly with position on the fault and the slip duration is short, with little or no indication of afterslip. Acknowledgments We owe thanks to many for providing information and data. Jim Mori and Sue Hough helped access USGS FBA records, Dennis Ostrum and Bill Iwan helped with the SMA-2 data and response, Egill Hauksson supplied the relocated aftershock seismicity, and Jeff Freymueller, Ken Hudnut, and Mike Lisowski generously provided their surveyed and corrected (GPS and trilateration) displacements. Discussions with B. Cohee, D. Dreger, H. K. Thio, E: Hauksson, D. Helmberger, K. Hudnut, K. Sieh, and H. Kanamori added significantly to this work. Reviews by S. Hartzell, B. Cohee, and C. Ammon improved this manuscript. This work was supported in part by SCEC contract through USC No. 569933 funded by NSF EAR 89-20136 and by the U.S. Geological Survey under Contract No. 1433-93-G2322 while D.J.W. was at Caltech.
References Abercrombie, R. and J. Moil (1994). Local observations of the onset of a large earthquake: 28 June 1992 Landers, California, Bull. Seism. Soc. Am. 84, no. 3, 725-734. Dreger, D. (1994). Investigation of the rupture process of the June 28, 1992 Landers Earthquake utilizing TERRAscope, Bull. Seism. Soc. Am. 84, no. 3, 713-724. Dullien, R. (1972). Laboratory evaluation of the SMA-2 magnetic tape-type strong motion accelerograph, C.I.T. Earthquake Engineering Research Laboratory, Pasadena, California. Earthquake Engineering Research Institute (1992). EERI special earthquake report, August 1992, EERI Newsletter 26, 1-12. Futterman, W. I. (1962). Dispersive body waves, J. Geophys. Res. 67, 5279-5291.
Spatial a n d T e m p o r a l Distribution o f Slip f o r the 1992 Landers, California, Earthquake
Harris, R. A. and S. M. Day (1993). Dynamics of fault interaction: parallel strike-slip faults, J. Geophys. Res. 98, 4461-4472. Hart, E. W., W. A. Bryant, and J. A. Treiman (1993). Surface faulting associated with the June 1992 Landers earthquake, California, Calif. Geol. 46, 10-16. Hartzell, S. H. and T. H. Heaton (1983). Inversion of strong ground motion and teleseismic waveform data for the fault rupture history of the 1979 Imperial Valley, California earthquake, Bull. Seism. Soc. Am. 73, 1553-1583. Hartzell, S. H. and T. H. Heaton (1986). Rupture history of the 1984 Morgan Hill, California, earthquake from the inversion of strong motion records, Bull. Seism. Soc. Am. 76, 649-674. Hartzell, S. H. and C. Langer (1993). Importance of model parameterization in finite fault inversions application to the 1974 Mw 8.0 Peru earthquake, J. Geophys. Res. 98, 22123-22134. Hartzell, S. H. and C, Mendoza (1991). Application of an iterative least squares waveform inversion of strong motion and teleseismic records to the 1978 Tabas, Iran, earthquake, Bull. Seism. Soc. Am. 81, 305-331. Hauksson, E., L. M. Jones, K. HuRon, and D. Eberhart-Phillips (1993). The 1992 Landers Earthquake sequence: seismological observations, J. Geophys. Res. 98, 19835-19858. Heaton, T. H. (1990). Evidence for and implications of self-healing pulses of slip in earthquake rupture, Phys. Earth Planet. Interiors 64, 1-20. Hill, D. P., P. Rosenberg, A. Michael, W. Arabasz, G. Beroza, J. Brune, D. Brumbaugh, R. Castro, S. Davis, D. dePolo, W. Ellsworth, J. Gomberg, S. Harmsen, L. House, S. Jackson, M. Johnston, L. Jones, R. Keller, S. Malone, L. Munguia, S. Nava, J. Pechmann, A. Sanford, R. Simpson, R. Smith, M. Stark, M. Stickney, A. Vidal, S. Walter, V. Wong, and J. Zollweg (1993). Seismicity in the Western United States remotely triggered by the M 7.4 Landers, California, earthquake of June 28, 1992, Science 260, 1617-1623. Hough, S. E., J. Mori, E. Sembera, G. Glassmoyer, C. Mueller, and S. Lydeen (1993). Southern surface rupture associated with the 6/28/92 M7.4 Landers earthquake: did it all happen during the mainshock? Geophys. Res. Lett. 20, 2615-2618. Hudnut, K. W., Y. Bock, M. Cline, P. Fang, J. Freymueller, K. Gross, D. Jackson, S. Larson, M. Lisowski, Z. Shen, and J. Svarc (1994). Co-seismic displacements in the Landers sequence, Bull. Seism. Soc. Am. 84, no. 3, 625-645. Jennings, C. W. (1975). Fault map of California, with locations of volcanoes, thermal springs, and thermal wells, Calif. Div. Mines Geol., Geologic Data Map 1, scale 1:750,000. Jones, L. E. and D. V. Helmberger (1992). Broadband modeling of aftershocks from the Landers, Big Bear, and Joshua Tree events, EOS 73, 383. Kanarnori, H., H. K. Thio, D. Dreger, E. Hauksson, and T. Heaton (1992). Initial investigation of the Landers, California, earthquake of 28 June 1992 using TERRAscope, Geophys. Res. Lett. 19, 2267-2270. Kennett, B. L. N. and E. R. Engdahl (1991). Traveltimes for global earthquake location and phase identification, Geophys. J. 105, 429-465.
691
Ma, Q. F. (1993). Broadband waveform observations of local earthquakes, Ph.D. Thesis, California Institute of Technology, Pasadena. Langston, C. A. and D. V. Helmberger (1975). A procedure for modeling shallow dislocation sources, Geophys. J. 42, 117-130. Mansinha, L. and D. E. Smylie (1971). The displacement field of inclined faults, Bull. Seism. Soc. Am. 61, 1433-1440. Mendoza, C. and S. H. Hartzell (1988). Aftershock patterns and main shock faulting, Bull. Seism. Soc. Am. 61, 1438-1449. Mendoza, C., S. H. Hartzell, and T. Monfret (1994). Wide-band analysis of the 3 March 1985 central Chile earthquake: overallsource process and rupture history, Bull. Seism. Soc. Am. (in press). Murray, M. H., J. C. Savage, M. Lisowski, and W. K. Gross (1993). Coseismic displacements--1992 Landers, California, earthquake, Geophys. Res. Lett. 20, 623-626. Shakal, A., M. Huang, T. Cao, R. Sherburne, R. Sydnor, P. Fung, P. Malhotra, C. Cramer, F. Su, R. Darragh, and J. Wampole (1992). CSMIP strong motion records from the Landers, California earthquake of 28 June, 1992. Report No. OSMS 92-09, California Strong Motion Instrumentation Program, 330 pp. Sieh, K., L. Jones, E. Hauksson, K. Hudnut, D. Eberhart-Phillips, T. Heaton, S. Hough, K. Hutton, H. Kanamori, A. Lilje, S. Lindval, S. F. McGill, J. Moil, C. Rubin, J. A. Spotila, J. Stock, H. Thio, J. Treiman, B. Wernicke, and J. Zachariasen (1993). Near-field investigation of the Landers earthquake sequence, April to July, 1992, Science 260, 171-176. Sylvester, A. G. (1993). Investigation of nearfield postseismic slip following the Mw 7.3 Landers earthquake sequence of 28 June 1992, California, Geophys. Res. Lett. 20, 1079-1082. Wald, D. J., T. H. Heaton, and D. V. Helmberger (1991). Rupture model of the 1989 Loma Prieta earthquake from the inversion of strong motion and broadband teleseismic data, Bull. Seism. Soc. Am. 81, 1540-1572. Wald, D. J., H. Kanamori, and D. V. Helmberger, and T. H. Heaton (1993). Source study of the 1906 San Francisco earthquake, Bull. Seism. Soc. Am. 83, 981-1019. Wald, D. J. (1992). Rupture characteristics of California earthquakes, Ph.D. Thesis, California Institute of Technology, Pasadena. Wald, D. J. and T. H. Heaton (1992). Comments on earthquake slip dynamics from comparative asperitology, EOS 73, 383. Wald, D. J., D. V. Helmberger, and S. H. Hartzell (1990). Rupture process of the 1987 Superstitions Hills earthquake from the inversion of strong motion data, Bull. Seism. Soc. Am. 80, 10791098. Wald, D. J., D. V. Helmberger, and T. H. Heaton (1991). The rupture initiation process of a large earthquake: Loma Prieta, Seism. Res. Lett. 62, 29. Zhao, D. and H. Kanamori (1993). The 1992 Landers earthquake sequence: earthquake occurrence and structural heterogeneities, Geophys. Res. Lett. 20, 1083-1086. U.S. Geological Survey Pasadena, California, 91106 Manuscript submitted 28 July 1993.